

Abstract
Many cross-sectional studies have investigated the relationship between neighborhood physical environment and physical activity. However, few studies have examined this relationship longitudinally, and no study has examined the association between change in objective measurements of physical activity resources and change in physical activity in adults. We used longitudinal data from the Multi-Ethnic Study of Atherosclerosis (2000–2007) of 6,814 adults who were aged 45–84 years at baseline. Physical activity was assessed via a semiquantitative questionnaire at baseline and at 2 follow-up visits (approximately 1.6 and 3.2 years later). We measured the density of recreational facilities within 1 mile of each participant's home address and used linear mixed-effects models to estimate the association between change in recreational facility density and change in physical activity. After adjusting for potential confounders, we found that a greater increase in recreational density was associated with a less pronounced decline in physical activity (mean difference in annual change in physical activity for each 1-unit increase in recreational density over time = 10.3 (95% confidence interval: 0.7, 19.9)). This association was stronger in older adults. Better access to recreational facilities may benefit middle-aged and older adults by enabling them to maintain activity levels as they age.
Keywords: longitudinal studies, neighborhood environment, physical activity, recreational facilities
After smoking, physical inactivity is the second leading modifiable risk factor for chronic disease and has a significant impact on mortality in Western countries (1). Previous research examining the worldwide burden of chronic disease attributable to physical inactivity found that the elimination of physical inactivity would increase the life expectancy of the world's population (2), and a recent longitudinal study found that reduction in physical activity over time was related to increased functional disability (3). Individual-level factors, such as lower socioeconomic status, are associated with decreased leisure-time physical activity (4, 5). However, recent research has suggested that contextual factors may also be important in influencing physical activity. Creating social and physical environments that are conducive to physical activity may be especially important in motivating individuals to engage in physical activity and in enhancing the impact of individual-targeted interventions (6).
Mixed land use and residential density have been shown to be associated with activities such as walking or biking for transportation (7–11). In addition, previous studies have found that the availability of physical activity equipment was associated with vigorous physical activity/sports participation, and that recreational facility availability and neighborhood aesthetics were related to recreational physical activity (RPA) (12–19). Conversely, some studies have found weak associations between neighborhood environment and physical activity (20–22). A systematic review found that several studies investigating the relationship between neighborhood environment and physical activity had null/inconclusive findings, noting that the environmental attributes investigated in many studies may be defined incorrectly in relationship to the type of physical activity studied (23). This lack of specificity may weaken the relationship between the predictor and outcome variables (24). Stronger associations have been found in studies that investigated hypotheses linking more narrowly defined combinations of environmental attributes with the specific activities to which they may be related (23).
One limitation of existing research is that most analyses are cross-sectional, and because of the possibility of residential self-selection, causal inferences are limited. Longitudinal data that track both persons and neighborhoods over time are needed to examine whether changes in environment are related to changes in physical activity (25, 26). This type of change-versus-change analysis is uncommon in neighborhood health research and is needed to address limitations that arise in cross-sectional analyses. A second limitation is the absence of large population studies with time-varying measures of neighborhood attributes.
We used longitudinal data from a large, multiethnic study of adults to investigate the association between baseline recreational facility density and change in physical activity over time, as well as the association between change in density and change in physical activity. We hypothesized that individuals living in neighborhoods with better availability of recreational facilities at baseline would experience more favorable changes in physical activity compared with individuals living in neighborhoods with poorer availability of facilities. We also hypothesized that individuals living in neighborhoods with greater increases in the availability of recreational facilities would experience more favorable changes in physical activity compared with individuals living in neighborhoods with smaller increases (or declines) in facilities.
MATERIALS AND METHODS
Study sample
The sample consisted of participants from the Multi-Ethnic Study of Atherosclerosis (MESA), a longitudinal study of cardiovascular disease that comprises a population-based, multisite (Baltimore, Maryland; Chicago, Illinois; Forsyth County, North Carolina; Los Angeles, California; New York, New York; and St. Paul, Minnesota), multiethnic (approximately 38% white, 28% African American, 23% Hispanic, and 11% Chinese descent) sample of 6,814 men and women aged 45–84 years who were free of clinical cardiovascular disease at baseline. We based our analyses on data from the baseline visit (from July 2000–September 2002) and 2 follow-up visits (approximately 1.6 and 3.2 years later). Participants were observed on at least 2 occasions, and 94% had 3 observations.
Recreational facilities
Recreational facility data were purchased from the National Establishment Time-Series database from Walls & Associates (Oakland, California). Home addresses were geocoded by using EZ-Locate (TomTom North America, Inc., Lebanon, New Hampshire). Data were purchased for 2000–2007, spanning the time range for the MESA examinations used in our analyses. A total of 133 Standard Industrial Classification codes (US Occupational Safety and Health Administration, Washington, DC) were selected on the basis of existing lists (27, 28). Densities were created for different categories of facilities for the years 2000–2007. We summed the densities of facilities offering indoor conditioning, biking, hiking, team sports, racquet sports, swimming, physical activity instruction, and water activities to obtain a summary measure that corresponded to exercise-related activities.
Densities were calculated for several buffer sizes around each MESA participant's home address for each year. Densities were matched to each MESA participant at each time point, such that densities changed over time if the neighborhood resources changed or if the participant moved. The 1-mile buffer (1 mile = 1.6 km) was selected for analyses on the basis of a study in a subsample of this cohort, in which a majority of physically active participants reported that they always exercised within 1 mile of their residences or did so at least half the time (19). Kernel estimation (29) was used to calculate the densities, such that facilities closer to participants' addresses were given more weight than facilities farther away. Densities are expressed in units per mile2 (henceforth, “densities” indicates units/mile2) and were created by using ArcGIS software (Esri, Redlands, California).
Physical activity assessment
Physical activity was assessed at baseline and at 2 subsequent follow-up examinations via a semiquantitative questionnaire adapted from the Cross-Cultural Activity Participation Study (30). Previous work has provided evidence for the validity and reliability of this survey (30). Participants were asked on how many days a week and the average amount of time per day they engaged in activities during “a typical week in the past month.” Minutes of activity were summed for each activity and multiplied by the activity's metabolic equivalent (MET) (31). We used a summary measure of physical activity, which included the activities that we hypothesized would be related to recreational facilities. RPA was calculated to include walking for exercise, dance, team sports (e.g., softball, basketball), dual sports (e.g., tennis), individual activities (e.g., golf, yoga), and conditioning activities (e.g., running, swimming, bicycling) and was measured in MET minutes per week. Higher MET minutes per week for an activity indicated a higher total volume of physical activity. Individual records indicating total physical activity of more than 24 hours per day were excluded.
Measurement of covariates
Covariate data were obtained at baseline and follow-up visits and included age, race/ethnicity (white, non-Hispanic black, Hispanic, or Chinese), education (less than high school, high school, some college, or college graduate/graduate school), household income (<$20,000, $20,000–49,999, $50,000–74,999, or >$75,000), season of examination visit (December–February, March–May, June–August, or September–November), employment status, and move status (never moved or moved at least once). Neighborhood-level covariates obtained from census data included percentage of unemployment, percentage of people living in poverty, and median household income.
Statistical analyses
We analyzed the distribution of individual-level variables across the 3 examinations and estimated the mean annual changes in recreational density and RPA. We categorized recreational density and RPA into tertiles and examined the distribution of individual-level variables across the highest and lowest tertiles. Finally, we estimated unadjusted associations of the individual-level variables with baseline levels and changes in RPA.
After conducting preliminary analyses by using categories and smoothed lines to check the linearity assumption, we included RPA and recreational density as continuous variables in longitudinal models. We used linear mixed-effects models to estimate the association between recreational density and change in RPA over time, adjusting for age, sex, race/ethnicity, education, household income (time-varying), and season of examination (time-varying) in the final models. To estimate the association between baseline density and change in RPA (model A), we used linear mixed-effects models to model repeated physical activity measurements on each participant as a function of recreational density at baseline, time since baseline, an interaction between density and time, and time-invariant and time-varying covariates. The interaction between time and baseline recreational density was used to estimate the impact of baseline recreational density on changes over time in RPA.
To assess the association between change in density and change in RPA (model B), we used similar mixed-effects models with the addition of change in density since baseline as a time-varying covariate and an interaction between change in density and time. This interaction term was used to assess whether change in recreational density over time modified the change over time in RPA.
All models included a random intercept and a random time slope for each participant to allow the baseline responses, as well as the time slope, to vary between individuals. Coefficients from the final model were used to compare the physical activity trajectories over time for different levels of baseline densities and change in densities.
We also stratified by age at baseline, whether participants moved (32% of participants moved during follow-up), income, and race/ethnicity to assess effect measure modification or whether the association between recreational density and RPA response trajectories differed by these characteristics. We investigated each interaction in separate models and retained those with P values of less than 0.05 in the final model.
Sensitivity analyses were conducted by using the half-mile and 2-mile buffers for recreational density. We used SAS, version 9.3, software (SAS Institute, Inc., Cary, North Carolina) for all analyses. All reported P values are 2-sided.
RESULTS
Of the 6,814 MESA participants, 6,191 participated in the MESA Neighborhood Study. After the exclusion of data from visits at which participants reported more than 24 hours of total physical activity per day and records with missing data on the exposure and outcome, 23 participants were excluded, leaving 6,168 for analysis. The excluded participants did not differ from the analytical sample with respect to sociodemographic factors.
At baseline, 58% of the participants were younger than 65 years and 48% were male; 40% were white, 26% were non-Hispanic black, 22% were Hispanic, and 12% were of Chinese descent (Table 1). Individuals reported a median RPA level of 840 MET minutes/week at baseline, which declined to 825 MET minutes/week at examination 3 (mean follow-up = 3.2 years). The mean annual change in RPA during the study period was −17.7 MET minutes/week. Overall, recreational facility density increased during the study period from a median density of 1.6 to 2.7 facilities/mile2 (mean annual change = 0.4).
Table 1.
Characteristics of Study Participants at Baseline and at 2 Follow-up Examinations, Multi-Ethnic Study of Atherosclerosis, 2000–2007
| Covariate | % at Baseline | % at Examination 2a | % at Examination 3b |
|---|---|---|---|
| Individual level | |||
| RPA, MET minutes/weekc | 840 (150–2,070)d | 735 (0–1,755)d | 825 (150–1,890)d |
| Age, years | |||
| 45–54 | 30 | 23 | 19 |
| 55–64 | 28 | 29 | 30 |
| 65–74 | 29 | 31 | 31 |
| 75–84 | 13 | 17 | 20 |
| Sex | |||
| Women | 52 | ||
| Men | 48 | ||
| Race/ethnicity | |||
| White | 40 | ||
| Non-Hispanic black | 26 | ||
| Hispanic | 22 | ||
| Chinese | 12 | ||
| Education | |||
| Less than high school | 18 | ||
| High school | 19 | ||
| Some college | 24 | ||
| College degree | 39 | ||
| Household income | |||
| <$20,000 | 22 | 23 | 23 |
| $20,000–$49,999 | 37 | 37 | 35 |
| $50,000–$74,999 | 17 | 16 | 17 |
| ≥$75,000 | 24 | 24 | 25 |
| Neighborhood level | |||
| % Unemploymente | 0.08 | 0.08 | 0.08 |
| % Povertyf | 0.16 | 0.15 | 0.15 |
| Median household income, $g | 44, 549 | 44,922 | 48,316 |
| 1-Mileh recreational facility densityi | 1.6 (0.8–2.5)d | 2.3 (1.0–5.1)d | 2.7 (1.0–5.6)d |
Abbreviations: MET, metabolic equivalent; RPA, recreational physical activity.
* P < 0.05; **P < 0.001.
a Mean length of follow-up was 1.6 years at examination 2.
b Mean length of follow-up was 3.2 years at examination 3.
c Mean annual change in RPA = −17.7 (standard deviation, 7.4) MET minutes/week*.
d Value expressed as median (interquartile range).
e Values are the means of the percent unemployment.
f Values are the means of the percent poverty.
g Values are the means of the median household income.
h One mile = 1.6 km. Indicates a 1-mile buffer from participant's residence.
i Mean annual change in recreational density was 0.4 (standard deviation, 0.01)**.
Participants in the highest tertile of recreational density were less likely to be non-Hispanic black or Hispanic and more likely to have higher levels of RPA and to live in neighborhoods of greater socioeconomic disadvantage (Table 2). Participants in the highest tertile of RPA were more likely to be men, white, and college educated. They were also more likely to earn more than $75,000/year and to have greater access to recreational facilities.
Table 2.
Baseline Characteristics According to Tertiles of Recreational Facility Densitya and RPA, the Multi-Ethnic Study of Atherosclerosis, 2000–2007
| Characteristic | Tertile of Recreational Density |
Tertile of RPA |
||
|---|---|---|---|---|
| First, % | Third, % | First, % | Third, % | |
| Recreational facility density | 0.5 (0.03–0.83)b | 6.4 (4.5–15.8)b | 1.8 (0.7–3.8)b | 2.5 (0.9–5.6)b |
| Individual level | ||||
| RPA, MET minutes/week | 735 (52.5–1,890)b | 1,103 (300–2,377)b | 0 (0–157.5)b | 2,835 (2,070–4,590)b |
| Age, years | ||||
| 45–54 | 29 | 28 | 30 | 30 |
| 55–64 | 29 | 27 | 28 | 27 |
| 65–74 | 30 | 29 | 29 | 31 |
| 75–84 | 12 | 16 | 13 | 12 |
| Sex | ||||
| Women | 50 | 54 | 57 | 53 |
| Men | 50 | 46 | 43 | 47 |
| Race | ||||
| White | 41 | 39 | 32 | 45 |
| Non-Hispanic black | 16 | 10 | 28 | 28 |
| Hispanic | 35 | 24 | 26 | 18 |
| Chinese | 8 | 27 | 14 | 9 |
| Education | ||||
| Less than high school | 15 | 19 | 26 | 10 |
| High school | 22 | 15 | 23 | 16 |
| Some college | 27 | 23 | 23 | 27 |
| College degree/ graduate school | 36 | 43 | 28 | 47 |
| Household income | ||||
| <$20,000 | 21 | 24 | 29 | 16 |
| $20,000–$49,999 | 38 | 35 | 38 | 36 |
| $50,000–$74,999 | 19 | 15 | 17 | 18 |
| ≥$75,000 | 22 | 26 | 16 | 30 |
| Neighborhood level | ||||
| % Unemploymentc | 0.06 | 0.10 | 0.08 | 0.07 |
| % Povertyd | 0.12 | 0.20 | 0.17 | 0.14 |
| Median household income, $e | 47,187 | 41,915 | 41,634 | 47,068 |
Abbreviations: MET, metabolic equivalent; RPA, recreational physical activity; SD, standard deviation.
a Number of recreational facilities within 1 mile (1.6 km) of participant's home.
b Value expressed as median (interquartile range).
c Values are the means of the percent unemployment.
d Values are the means of the percent poverty.
e Values are the means of the median household income.
In unadjusted models, male sex, higher education, and higher income were associated with higher baseline RPA (Table 3). Hispanic and Chinese race/ethnicity and lower recreational density were associated with lower baseline RPA. Older age at baseline was associated with a greater decline in RPA over time.
Table 3.
Unadjusted Mean Differences in RPA at Baseline and Mean Differences in Annual Change in RPA Over Follow-up Related to Baseline Covariates, the Multi-Ethnic Study of Atherosclerosis, 2000–2007
| Covariate | Baseline RPA, MET minutes/week | Change in RPA, MET minutes/week |
|---|---|---|
| Age, years | ||
| 45–54 | Referent | Referent |
| 55–64 | 21.5 | −5.6 |
| 65–74 | 17.7 | −19.3 |
| 75–84 | −29.6 | −57.4* |
| Sex | ||
| Women | Referent | Referent |
| Men | 432.0*** | 2.2 |
| Race | ||
| White | Referent | Referent |
| Non-Hispanic black | −35.2 | −8.6 |
| Hispanic | −326.1*** | 0.1 |
| Chinese | −538.5*** | −21.5 |
| Education | ||
| Less than high school | Referent | Referent |
| High school | 385.4*** | −20.5 |
| Some college | 718.9*** | −15.0 |
| College degree/ graduate school | 745.0*** | −9.6 |
| Household income | ||
| <$20,000 | Referent | Referent |
| $20,000–$49,999 | 387.0*** | −18.2 |
| $50,000–$74,999 | 431.4*** | 22.6 |
| ≥$75,000 | 737.6*** | 36.7 |
| Move status | ||
| Never moved | Referent | Referent |
| Moved at least once | −96.6 | 22.8 |
| Baseline recreational density | ||
| Highest tertile | Referent | Referent |
| Middle tertile | −286.6*** | −12.8 |
| Lowest tertile | −327.2*** | −5.6 |
| Study site | ||
| New York | Referent | Referent |
| Illinois | 11.8 | 49.5 |
| Maryland | −113.9 | 32.6 |
| Minnesota | −238.3* | −19.6 |
| California | −682.9*** | −12.3 |
| North Carolina | −363.0** | −33.9 |
Abbreviations: MET, metabolic equivalent; RPA, recreational physical activity.
* P < 0.05; **P < 0.01; ***P < 0.0001.
In models estimating the association between baseline recreational density and change in RPA (model A), we observed a positive, statistically significant association between recreational facility density and baseline RPA after adjustment for covariates (mean difference in baseline RPA associated with a 1-unit change in recreational density = 18.7 MET minutes/week, 95% confidence interval (CI): 13.1, 24.4) (Table 4). Overall, RPA decreased over time as the cohort aged (mean annual change in RPA for individuals living in areas with 0 resource density = −31.6 MET minutes/week). The interaction between baseline recreational density and time was positive, suggesting that higher baseline density was associated with a less pronounced decline in RPA over time, but the estimate was not statistically significant (mean difference in annual change in RPA for each 1-unit increase in density at baseline = 1.5 MET minutes/week, 95% CI: −0.3, 3.4).
Table 4.
Mean Differences in RPA at Baseline and Mean Differences in Annual Changes in RPA Associated With Baseline Recreational Density and Changes in Recreational Density Over Time, the Multi-Ethnic Study of Atherosclerosis, 2000–2007
| Regression Coefficients by Model | Mean Difference (SE), MET minutes/week |
|
|---|---|---|
| Model 1a | Model 2b | |
| Model Ac | ||
| Difference in baseline RPAd | 24.1 (2.8)*** | 18.7 (2.9)*** |
| Annual change in RPAe | −26.3 (9.2)** | −31.6 (9.8)** |
| Difference in annual change in RPAd | 1.3 (0.9) | 1.5 (0.9) |
| Model Bf | ||
| Difference in baseline RPAd | 23.6 (2.9)*** | 19.2 (2.9)*** |
| Annual change in RPAe | −27.8 (9.8)** | −32.7 (9.9)* |
| Difference in annual change in RPAg | 11.6 (4.9)* | 10.3 (4.9)* |
Abbreviations: MET, metabolic equivalent; RPA, recreational physical activity; SE, standard error.
* P < 0.05; ** P < 0.01; ***P < 0.0001.
a Unadjusted model.
b Model adjusted for age, age × time, race, sex, education, income, and season.
c Baseline recreational density + interaction of baseline recreational density with time
d Per 1-unit increase in baseline recreational density.
e For individuals with density of 0 at baseline.
f Baseline recreational density + interaction of change in recreational density with time
g Per 1-unit increase in change in recreational density.
In models estimating the association between change in recreational density since baseline and change in RPA (model B), the interaction between change in density and time was positive and statistically significant in the unadjusted model (mean difference in annual change in RPA for each 1-unit increase in the change in density since baseline = 11.6 MET minutes/week, 95% CI: 1.9, 21.1) (Table 4), indicating that a greater increase in recreational density over time was associated with a less pronounced decline in RPA over time, even after adjustment for the effect of baseline density on change in RPA. Estimates were slightly attenuated after adjustment for individual-level covariates (mean difference in annual change = 10.3 MET minutes/week, 95% CI: 0.7, 19.9), but the association remained statistically significant. Adjustments for employment, move status, neighborhood-level covariates, and site did not meaningfully alter the results.
Figure 1 shows estimated changes in RPA over time for the 90th and 10th percentiles of baseline levels and changes in densities as estimated from the fully adjusted model in Table 4 (model B). Overall, persons who lived in areas with higher recreational densities at baseline had higher levels of RPA than those who lived in areas with lower densities at baseline. In addition, within each set, persons who experienced greater increases in recreational density over time showed less pronounced declines or even small increases in RPA over time. Overall, we observed the most favorable change in RPA over time for the group in the 90th percentile of baseline density and the 90th percentile of change in density, and we observed the least favorable change in RPA for the group in the 10th percentile of baseline density and the 10th percentile of change in density.
Figure 1.
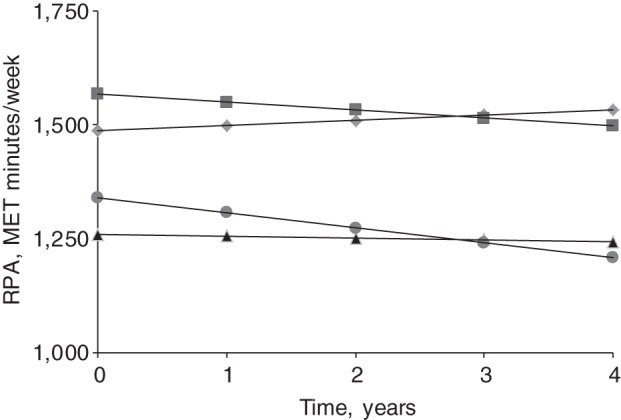
Change in recreational physical activity (RPA) over time, comparing 4 different groups (as estimated from model 2B in Table 4), categorized as follows: the 90th percentile of baseline recreational density and the 90th percentile of change in recreational density (diamonds); the 90th percentile of baseline recreational density and the 10th percentile of change in recreational density (squares); the 10th percentile of baseline recreational density and the 90th percentile of change in recreational density (triangles); and the 10th percentile of baseline recreational density and the 10th percentile of change in recreational density (circles). MET, metabolic equivalent.
In age-stratified models, the association between baseline recreational density and change in RPA was stronger among adults aged 65 years and over (mean annual change = 4.6 MET minutes/week, 95% CI: 1.7, 7.6) than among those under 65 years (mean annual change = −1.0, 95% CI: −3.4, 1.4), and the test for heterogeneity was statistically significant (P < 0.01) (Appendix Table 1). Similar patterns were observed when analyses relating changes in density to changes in RPA were stratified by age; stronger associations were observed among older adults (mean difference in annual change = 16.5 MET minutes/week, 95% CI: 0.9, 32.1) than among those under age 65 years (mean difference in annual change = 6.2 MET minutes/week, 95% CI: −5.9, 18.2), but the test for heterogeneity was not statistically significant (P > 0.1). There was no significant heterogeneity by move status, income, or race/ethnicity for either model. Analyses using buffer sizes of half a mile and 2 miles yielded results similar to those shown.
DISCUSSION
In this multiethnic sample, we observed a positive association between recreational facility density and RPA at baseline. We also observed a decline in RPA over time. We did not observe statistically significant associations between baseline recreational density and change in RPA in the overall sample. However, although RPA declined on average in the sample as a whole, individuals who experienced greater increases in the densities of recreational resources around their homes experienced a less pronounced decline in RPA over time. Among individuals who experienced the largest increases in density of resources, the decline in RPA was practically eliminated.
We used mixed-effects models to estimate associations of recreational resources with RPA change. Model A revealed cross-sectional associations between baseline density levels and baseline RPA but showed no statistically significant associations between baseline density and change in RPA over time. An important limitation of this model is that it does not account for changes in density over time and assumes that densities at a single time point affect future trajectories, which may be unrealistic if densities change over time. However, model A allows for comparisons with other work that may have measurement at only a single time point. In contrast, model B showed that greater increases in density over time were associated with a significantly less pronounced decline in RPA over time. The comparison between these models highlights the impact of accounting for changes in the exposure over time.
Recent studies have suggested that age may modify the association between the neighborhood environment and physical activity (32, 33). In this study, the observed associations between baseline recreational density and change in RPA were stronger among older adults, but the difference between the age groups was not as strong for the change in density models. There is limited previous research investigating the environmental correlates of physical activity in adults of different age groups. One study reported positive associations between perceived access to recreational facilities and physical activity among adults aged 80 years and over (34). Longitudinal studies investigating the neighborhood environment and changes in walking behavior have reported that proximity to parks/trails is associated with maintaining/increasing walking in older men (35), and that proximity to parks/gyms is associated with smaller declines in walking (36). A study examining interactions of physical environment with age suggested that older adults may be more influenced by environmental attributes (37), perhaps because older adults may spend more time in their neighborhoods. Our results suggest that further research is warranted to understand the impact of recreational facilities on RPA in older adults.
Few studies have examined the association between changes in neighborhood environment and changes in physical activity in adults. A recent study found that increased access near the home to recreational facilities requiring a fee was associated with increased physical activity in young males (38). A secondary analysis of physical activity intervention trials found that increases in perceived access to facility- or home-based exercise equipment were associated with increases in moderate/vigorous physical activity (39). A study in California found that changes in neighborhood attributes were associated with self-reported changes in physical activity within the neighborhood (40). To our knowledge, ours is the first study to show an association between change in recreational facility density and change in RPA in adults.
Limitations
Recreational facility densities in this study were based on commercial data and did not take into account facility quality, hours of operation, or cost of use, nor do we have information on whether participants were using the resources. In addition, we did not include resources such as parks or other physical environment features that may be related to physical activity. Previous studies examining the quality of the commercial databases that collect and compile data on the availability of facilities suggest that there may be measurement error in the facility counts (41–43). However, it is unlikely that this error is patterned in such a way that it would create the associations that we observed.
There is little information on the relevant buffer size for use of recreational facilities. We used the 1-mile buffer because most of the active individuals in this sample reported that they used facilities within 1 mile of their residences; we found that results did not vary in analyses that used the half-mile and 2-mile buffers. We used the same buffer size for the whole sample, though the relevant buffer may vary by site. Adjustment for site slightly attenuated our observed estimates. Furthermore, because the 1-mile buffer was measured around residential addresses, we did not account for facilities near workplaces.
We chose to present estimates that were unadjusted for population density because our exposure of interest was the presence of facilities within a certain radius. On one hand, more densely populated areas may have more resources available. On the other hand, there is no specific reason that availability of facilities should affect physical activity conditional on the number of persons who live in the area. In addition, population density and urban development, although relevant for walking for transportation, are unlikely to be related to RPA and, hence, unlikely to be confounders in our analyses. Sensitivity analyses adjusting for population density and percent retail/commercial facilities yielded results similar to those presented.
Because physical activity was self-reported, measurement error is possible. The form of the questionnaire likely results in overestimates of time spent engaging in activities; thus, absolute values may not be interpretable. We excluded visits at which participants reported greater than 24 hours of total activity per day to exclude inflated measurements of self-reported activity. Despite the limitations of the absolute values, given that the questionnaire was similar across time points, relative positions and trends over time remain meaningful. In using mixed-effects models, we cannot rule out residual confounding due to unmeasured covariates, especially variables related to residential self-selection, such as individual preference for physical activity resources, which are difficult to measure.
Strengths
Our study is unique in that it has longitudinal data on recreational densities, physical activity measurements, and individual- and neighborhood-level covariates. We used objective measures of recreational densities, and our physical activity measure accounted for both duration and intensity of a range of moderate/vigorous activities. In addition, our study paired the neighborhood construct of interest, recreational facilities, with a relevant physical activity measure, RPA, addressing the limitation in previous studies of the environmental construct of interest not corresponding closely enough to the outcome of interest.
With available time-varying measures, we were able to estimate the association between change in an objective measure of resource availability and change in RPA. Although we cannot completely rule out confounding or bidirectional causation (changes in RPA of residents influencing changes in densities), this type of change-versus-change analysis is a major step forward compared with cross-sectional analyses, which may be hampered by the possibility that individuals with certain activity preferences choose neighborhoods with better resources.
Conclusion
The results from this longitudinal study suggest that greater access to recreational facilities may benefit middle-aged and older adults by enabling them to maintain activity levels as they age and to experience slower declines in physical activity over time, which may lead to reduced morbidity and increased functional ability. Data on quality of physical activity resources, individual preferences for living in a neighborhood with physical activity resources, and whether individuals are using available resources would allow for better estimation of the causal relationship between availability of recreational resources and physical activity.
ACKNOWLEDGMENTS
Author affiliations: Division of Epidemiology, School of Public Health, University of California Berkeley, Berkeley, California (Yamini K. Ranchod); Department of Epidemiology, University of Michigan School of Public Health, Ann Arbor, Michigan (Ana V. Diez Roux, Kari Moore); Center for Social Epidemiology and Population Health, Ann Arbor, Michigan (Ana V. Diez Roux, Kari Moore); Department of Epidemiology, Gillings School of Global Public Health, University of North Carolina at Chapel Hill, Chapel Hill, North Carolina (Kelly R. Evenson); and Department of Biostatistics, University of Michigan School of Public Health, Ann Arbor, Michigan (Brisa N. Sánchez).
This study was supported by the National Institutes of Health/National Heart, Lung, and Blood Institute (grant 2R01 HL071759 and contracts N01-HC-95159 through N01-HC-95169 to A.V.D.R.).
Conflict of interest: none declared.
APPENDIX
Appendix Table 1.
Mean Differences in Annual Changes in RPA Associated With Recreational Densities and Changes in Recreational Densities Over Time by Age at Baseline, Multi-Ethnic Study of Atherosclerosis, 2000–2007
| Model by Age at Baseline, years | Mean Difference (SE) in Annual Change in RPA, MET minutes/week |
|---|---|
| Model Aa,b,c | |
| Age 45–64 | −1.0 (1.2)d |
| Age 65–84 | 4.6 (1.5)d,** |
| Model Bb,e,f | |
| Age 45–64 | 6.2 (6.2)g |
| Age 65–84 | 16.5 (7.9)g,* |
Abbreviations: MET, metabolic equivalent; RPA, recreational physical activity; SE, standard error.
* P < 0.05; **P < 0.01.
a Baseline recreational density + interaction of baseline recreational density with time.
b Model is adjusted for age, age × time, race, sex, education, income, and season.
c P for interaction = 0.008.
d Per 1-unit increase in baseline recreational density.
e Baseline recreational density + interaction of change in recreational density with time.
f P for interaction = 0.2.
g Per 1-unit increase in change in recreational density.
REFERENCES
- 1.US Department of Health and Human Services. Physical Activity and Health: A Report of the Surgeon General. Atlanta, GA: US Department of Health and Human Services, Centers for Disease Control and Prevention, National Center for Chronic Disease Prevention and Health Promotion; 1996. [Google Scholar]
- 2.Lee IM, Shiroma EJ, Lobelo F, et al. Effect of physical inactivity on major non-communicable diseases worldwide: an analysis of burden of disease and life expectancy. Lancet. 2012;380(9838):219–229. doi: 10.1016/S0140-6736(12)61031-9. [DOI] [PMC free article] [PubMed] [Google Scholar]
- 3.Gretebeck RJ, Ferraro KF, Black DR, et al. Longitudinal change in physical activity and disability in adults. Am J Health Behav. 2012;36(3):385–394. doi: 10.5993/AJHB.36.3.9. [DOI] [PMC free article] [PubMed] [Google Scholar]
- 4.Brug J, Oenema A, Ferreira I. Theory, evidence and intervention mapping to improve behavior nutrition and physical activity interventions. Int J Behav Nutr Phys Act. 2005;2(1):2. doi: 10.1186/1479-5868-2-2. [DOI] [PMC free article] [PubMed] [Google Scholar]
- 5.Trost S, Owen N, Bauman A, et al. Correlates of adults’ participation in physical activity: review and update. Med Sci Sports Exerc. 2002;34(12):1996–2001. doi: 10.1097/00005768-200212000-00020. [DOI] [PubMed] [Google Scholar]
- 6.Sallis J, Cervero R, Ascher W, et al. An ecological approach to creating active living communities. Annu Rev Public Health. 2006;27:297–322. doi: 10.1146/annurev.publhealth.27.021405.102100. [DOI] [PubMed] [Google Scholar]
- 7.Rodríguez D, Evenson K, Diez Roux A, et al. Land use, residential density, and walking. The Multi-Ethnic Study of Atherosclerosis. Am J Prev Med. 2009;37(5):397–404. doi: 10.1016/j.amepre.2009.07.008. [DOI] [PMC free article] [PubMed] [Google Scholar]
- 8.Handy S, Boarnet M, Ewing R, et al. How the built environment affects physical activity: views from urban planning. Am J Prev Med. 2002;23(2 suppl):64–73. doi: 10.1016/s0749-3797(02)00475-0. [DOI] [PubMed] [Google Scholar]
- 9.Schwanen T, Mokhtarian PL. What affects commute mode choice: neighborhood physical structure or preferences toward neighborhoods? J Transport Geography. 2005;13(1):83–99. [Google Scholar]
- 10.Pinjari AR, Bhat CR, Hensher DA. Residential self-selection effects in an activity time-use behavior model. Transport Res Part B. 2009;43(7):729–748. [Google Scholar]
- 11.Saelens B, Sallis J, Frank L. Environmental correlates of walking and cycling: findings from the transportation, urban design, and planning literatures. Ann Behav Med. 2003;25(2):80–91. doi: 10.1207/S15324796ABM2502_03. [DOI] [PubMed] [Google Scholar]
- 12.Sallis JF, Hovell MF, Hofstetter CR, et al. A multivariate study of determinants of vigorous exercise in a community sample. Prev Med. 1989;18(1):20–34. doi: 10.1016/0091-7435(89)90051-0. [DOI] [PubMed] [Google Scholar]
- 13.Sallis JF, Johnson MF, Calfas KJ, et al. Assessing perceived physical environmental variables that may influence physical activity. Res Q Exerc Sport. 1997;68(4):345–351. doi: 10.1080/02701367.1997.10608015. [DOI] [PubMed] [Google Scholar]
- 14.Brownson RC, Baker EA, Housemann RA, et al. Environmental and policy determinants of physical activity in the United States. Am J Public Health. 2001;91(12):1995–2003. doi: 10.2105/ajph.91.12.1995. [DOI] [PMC free article] [PubMed] [Google Scholar]
- 15.De Bourdeaudhuij I, Sallis JF, Saelens BE. Environmental correlates of physical activity in a sample of Belgian adults. Am J Health Promot. 2003;18(1):83–92. doi: 10.4278/0890-1171-18.1.83. [DOI] [PubMed] [Google Scholar]
- 16.Giles-Corti B, Donovan RJ. Socioeconomic status differences in recreational physical activity levels and real and perceived access to a supportive physical environment. Prev Med. 2002;35(6):601–611. doi: 10.1006/pmed.2002.1115. [DOI] [PubMed] [Google Scholar]
- 17.Addy CL, Wilson DK, Kirtland KA, et al. Associations of perceived social and physical environmental supports with physical activity and walking behavior. Am J Public Health. 2004;94(3):440–443. doi: 10.2105/ajph.94.3.440. [DOI] [PMC free article] [PubMed] [Google Scholar]
- 18.Powell KE, Martin LM, Chowdhury PP. Places to walk: convenience and regular physical activity. Am J Public Health. 2003;93(9):1519–1521. doi: 10.2105/ajph.93.9.1519. [DOI] [PMC free article] [PubMed] [Google Scholar]
- 19.Diez Roux A, Evenson K, McGinn A, et al. Availability of recreational resources and physical activity in adults. Am J Public Health. 2007;97(3):493–499. doi: 10.2105/AJPH.2006.087734. [DOI] [PMC free article] [PubMed] [Google Scholar]
- 20.Troped P, Saunders R, Pate R, et al. Associations between self-reported and objective physical environmental factors and use of a community rail-trail. Prev Med. 2001;32(2):191–200. doi: 10.1006/pmed.2000.0788. [DOI] [PubMed] [Google Scholar]
- 21.Ball K, Bauman A, Leslie E, et al. Perceived environmental aesthetics and convenience and company are associated with walking for exercise among Australian adults. Prev Med. 2001;33(5):434–440. doi: 10.1006/pmed.2001.0912. [DOI] [PubMed] [Google Scholar]
- 22.Brownson R, Kelly C, Eyler A, et al. Environmental and policy approaches for promoting physical activity in the United States: a research agenda. J Phys Act Health. 2008;5(4):488–503. doi: 10.1123/jpah.5.4.488. [DOI] [PubMed] [Google Scholar]
- 23.Wendel-Vos W, Droomers M, Kremers S, et al. Potential environmental determinants of physical activity in adults: a systematic review. Obes Rev. 2007;8(5):425–440. doi: 10.1111/j.1467-789X.2007.00370.x. [DOI] [PubMed] [Google Scholar]
- 24.Giles-Corti B, Timperio A, Bull F, et al. Understanding physical activity environmental correlates: increased specificity for ecological models. Exerc Sport Sci Rev. 2005;33(4):175–181. doi: 10.1097/00003677-200510000-00005. [DOI] [PubMed] [Google Scholar]
- 25.Cook T, Shagle S, Degirmencioglu S. Capturing social process for testing mediational models of neighborhood effects. In: Brooks-Gunn J, Duncan G, Aber J, editors. Neighborhood Poverty: Context and Consequences for Children. New York, NY: Russell Sage Foundation Press; 1997. pp. 94–119. [Google Scholar]
- 26.O'Campo P. Invited commentary: Advancing theory and methods for multilevel models of residential neighborhoods and health. Am J Epidemiol. 2003;157(1):9–13. doi: 10.1093/aje/kwf171. [DOI] [PubMed] [Google Scholar]
- 27.Powell L, Chaloupka F, Slater S, et al. The availability of local-area commercial physical activity-related facilities and physical activity among adolescents. Am J Prev Med. 2007;33(4 suppl):S292–S300. doi: 10.1016/j.amepre.2007.07.002. [DOI] [PubMed] [Google Scholar]
- 28.Gordon-Larsen P, Nelson M, Page P, et al. Inequality in the built environment underlies key health disparities in physical activity and obesity. Pediatrics. 2006;117(2):417–424. doi: 10.1542/peds.2005-0058. [DOI] [PubMed] [Google Scholar]
- 29.Silverman BW. Density Estimation for Statistics and Data Analysis. London, United Kingdom: Chapman & Hall/CRC; 1986. [Google Scholar]
- 30.LaMonte M, Durstine J, Addy C, et al. Physical activity, physical fitness, and Framingham 10-year risk score: the Cross-Cultural Activity Participation Study. J Cardiopulm Rehabil. 2001;21(2):63–70. doi: 10.1097/00008483-200103000-00001. [DOI] [PubMed] [Google Scholar]
- 31.Ainsworth BE, Haskell WL, Whitt MC, et al. Compendium of physical activities: an update of activity codes and MET intensities. Med Sci Sports Exerc. 2000;32(9 suppl):S498–S504. doi: 10.1097/00005768-200009001-00009. [DOI] [PubMed] [Google Scholar]
- 32.Van Cauwenberg J, De Bourdeaudhuij I, De Meester F, et al. Relationship between the physical environment and physical activity in older adults: a systematic review. Health Place. 2011;17(2):458–469. doi: 10.1016/j.healthplace.2010.11.010. [DOI] [PubMed] [Google Scholar]
- 33.Ding D, Gebel K. Built environment, physical activity, and obesity: What have we learned from reviewing the literature? Health Place. 2012;18(1):100–105. doi: 10.1016/j.healthplace.2011.08.021. [DOI] [PubMed] [Google Scholar]
- 34.Chad KE, Reeder BA, Harrison EL, et al. Profile of physical activity levels in community-dwelling older adults. Med Sci Sports Exerc. 2005;37(10):1774–1784. doi: 10.1249/01.mss.0000181303.51937.9c. [DOI] [PubMed] [Google Scholar]
- 35.Michael YL, Perdue LA, Orwoll ES, et al. Physical activity resources and changes in walking in a cohort of older men. Am J Public Health. 2010;100(4):654–660. doi: 10.2105/AJPH.2009.172031. [DOI] [PMC free article] [PubMed] [Google Scholar]
- 36.Li F, Fisher J, Brownson RC. A multilevel analysis of change in neighborhood walking activity in older adults. J Aging Phys Act. 2005;13(2):145–159. doi: 10.1123/japa.13.2.145. [DOI] [PubMed] [Google Scholar]
- 37.Sallis JF, King AC, Sirard JR, et al. Perceived environmental predictors of physical activity over 6 months in adults: Activity Counseling Trial. Health Psychol. 2007;26(6):701–709. doi: 10.1037/0278-6133.26.6.701. [DOI] [PubMed] [Google Scholar]
- 38.Boone-Heinonen J, Guilkey DK, Evenson KR, et al. Residential self-selection bias in the estimation of built environment effects on physical activity between adolescence and young adulthood. Int J Behav Nutr Phys Act. 2010;7:70. doi: 10.1186/1479-5868-7-70. [DOI] [PMC free article] [PubMed] [Google Scholar]
- 39.Ries AV, Dunsiger S, Marcus BH. Physical activity interventions and changes in perceived home and facility environments. Prev Med. 2009;49(6):515–517. doi: 10.1016/j.ypmed.2009.10.009. [DOI] [PMC free article] [PubMed] [Google Scholar]
- 40.Handy SL, Cao X, Mokhtarian PL. The causal influence of neighborhood design on physical activity within the neighborhood: evidence from Northern California. Am J Health Promot. 2008;22(5):350–358. doi: 10.4278/ajhp.22.5.350. [DOI] [PubMed] [Google Scholar]
- 41.Boone JE, Gordon-Larsen P, Stewart JD, et al. Validation of a GIS facilities database: quantification and implications of error. Ann Epidemiol. 2008;18(5):371–377. doi: 10.1016/j.annepidem.2007.11.008. [DOI] [PMC free article] [PubMed] [Google Scholar]
- 42.Han E, Powell L, Slater S, et al. Validation of secondary commercial data sources for physical activity facilities in urban and nonurban settings. J Phys Act Health. 2012;9(8):1080–1088. doi: 10.1123/jpah.9.8.1080. [DOI] [PubMed] [Google Scholar]
- 43.Hoehner CM, Schootman M. Concordance of commercial data sources for neighborhood-effects studies. J Urban Health. 2010;87(4):713–725. doi: 10.1007/s11524-010-9458-0. [DOI] [PMC free article] [PubMed] [Google Scholar]