

This paper describes a convenient system for highly specific and highly sensitive detection of miRNA expression. The authors show that their method can discriminate mature miRNAs from the precursors using synthetic miRNAs and in vitro transcribed precursors as well as in tissue samples. It also allows for the discrimination of closely related miRNAs of the same family, with individual members differing in sequence by a single nucleotide.
Keywords: miRNA, small RNA, liquid hybridization, avidin–biotin detection system, PCR, color development
Abstract
Since the first miRNA was discovered in 1993, miRNAs have become a hotspot for biological research. In order to feed this demand, a robust method is required to detect miRNA gene expression. Development of a detection method is more difficult for miRNAs than for long RNAs, such as mRNA, owing to their small size. Existing methods have limitations; thus, new methods are required. We describe a new system for detecting miRNA expression, which can distinguish miRNA from its precursor and has single-nucleotide resolution. It has single molecule and multiplex detection potential. It may be performed as a polymerase chain reaction (PCR) method, a blotting method, or a macroarray method according to the analyst's preference. This personalized system provides a convenient tool for the detection of miRNA gene expression.
INTRODUCTION
MicroRNAs (miRNAs) are endogenous, tiny RNA molecules (∼22 nucleotides in length) that are involved in almost every aspect of cellular processes investigated to date, and their altered expression is associated with many human diseases (Bartel 2004; Huang et al. 2010; Okamura 2011). miRNA research is currently of strong interest (Chugh and Dittmer 2012). The release of 19 of the miRBase sequence database (http://www.mirbase.org/) contains 25,141 mature miRNAs in 193 species, and new molecules are constantly being discovered. However, the biological functions and significance of most miRNAs remain uninvestigated. The explosion in miRNA research and miRNA numbers requires the development of robust detection tools (Cissell et al. 2007; Cissell and Deo 2009; Takada and Asahara 2012).
The limitations caused by the unique properties of miRNAs create barriers to the development of miRNA detection methods (Cissell et al. 2007; de Planell-Saguer and Rodicio 2011). The extremely small size of miRNAs leads to low annealing temperature, reducing the stringency of hybridization. The closely similar and identical sequences among miRNAs family members, their ancestral RNAs (pre-miRNAs and pri-miRNAs), and isomiRs present a challenge to detection specificity (Thomas et al. 2010; Chugh and Dittmer 2012; Zhou et al. 2012). The lack of a poly-A tail and 5′ cap in a miRNA sequence inhibits its selective purification, thus affecting detection sensitivity. In addition, the extremely small size of miRNAs disables binding of conventional primers to such tiny templates and reduces the possibility of probe design. In general, miRNAs have low abundance, which requires highly sensitive methods for detection. Furthermore, different melting temperatures caused by the different GC content of miRNAs limit the accurate detection of multiple miRNAs.
Despite the difficulties in developing a miRNA detection method, several decades of methods have been reported since conventional Northern blotting was primarily used in 1993 (Lee et al. 1993; Cissell and Deo 2009; Takada and Asahara 2012), and they all have inherent limitations. Based on the principle of hybridization (solid or liquid hybridization), current methods can be categorized as PCR-, blotting-, or array-based methods (Chen et al. 2005; Ro et al. 2006; Cissell et al. 2007). Northern blotting is currently considered the gold standard of miRNA detection, PCR is suitable for sensitive quantification, and microarray methods are used for high-throughput analysis (de Planell-Saguer and Rodicio 2011; van Rooij 2011; Chugh and Dittmer 2012). However, Northern blotting has a complicated and time-consuming protocol, low sensitivity and low throughput; stem–loop PCR incurs difficulty in designing primers and achieving specificity for special miRNAs; poly(A) polymerase tailing-PCR may not represent all miRNAs present in a given sample (Enos et al. 2007), and microarrays exhibit low specificity and low repeatability. Next-generation sequencing overcomes many of the challenges of other methods, for example, iso-miRs are easily distinguished by it (Lee et al. 2010); however, it is expensive and requires a commercial provider—it is not used by a laboratory itself. Overall, highly sensitive, specific, and convenient methods for detecting miRNAs expression are required to be further developed (Cissell and Deo 2009; Chugh and Dittmer 2012).
Previously, we developed a simple miRNA detection system called LHCD (Li et al. 2012), but its sensitivity was not high. Here, based on LHCD, we develop a highly improved system of liquid hybridization and color development with signal amplification (named LH-CD or aLHCD). aLHCD can isolate mature miRNA from its precursor and discriminate among members of miRNA families. It yields highly sensitive signals and offers multi-throughput potential for miRNA profiling. It presents no difficulty in designing primers and requires no unique equipment or uncommon reagents, making it easy to use for miRNA detection. It can be performed as a PCR method (LH-PCR), or as a macroarray method (LH-Macroarray) and thus can conveniently detect miRNAs.
RESULTS
Design of a new system for miRNA detection
Here, we describe a procedure for the detection and quantitation of single-stranded mature miRNAs (Fig. 1). Total RNA is extracted from the cells in which a given miRNA is to be quantified. From this RNA mixture, the single-stranded miRNA in question (but not its partially double-stranded precursor) is captured by or hybridized to a DNA probe in which the single-stranded sequence complementary to the complete miRNA in question is flanked by two hairpins. After miRNA capture, one of the hairpins is cleaved by BamH I, leaving a five-base-pair stem that can dissociate at slightly elevated temperatures (50°C). The resulting single-stranded seven-base overhang is degraded by the single-strand-specific 3′-5′-exonuclease I (Exo I), yielding a nicked stem–loop in which the sequence hybridized to the miRNA is protected from Exo I degradation only when the miRNA is present. Thus, the miRNA is changed into an equivalent DNA probe. In a subsequent PCR reaction, an oligo called “3′ terminus for PCR bridging” (abbreviated as “3′ bridging oligo”) replaces the miRNA from the capture oligo and is extended using the remaining part of the capture oligo as template. This newly synthesized stretch can then hybridize to the “5′ terminus for PCR bridging” oligo (abbreviated as “5′ bridging oligo”), resulting in PCR amplification of a longer fragment. Biotinylated primers that match the ends of this longer fragment are then used to label the long fragment with biotin on both ends. A second, post-PCR Exo I step then removes all remaining single-stranded oligos. The biotinylated PCR products are then transferred to a membrane and detected by avidin–alkaline phosphatase complexes.
FIGURE 1.
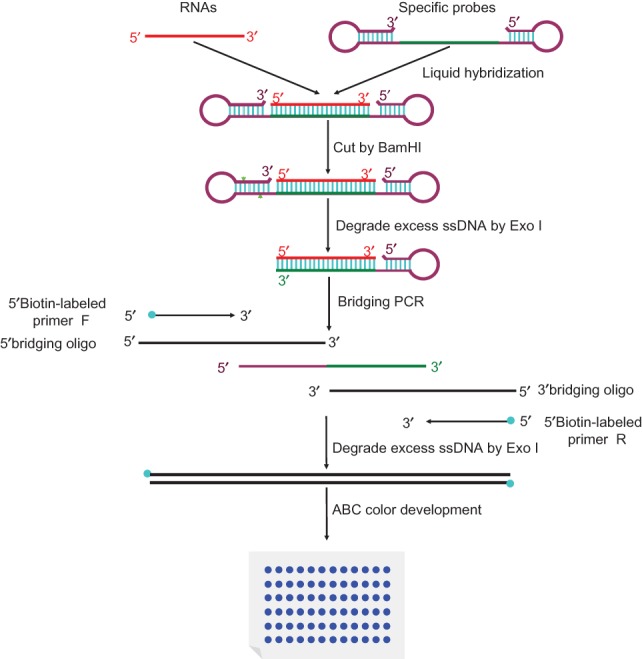
Schematic diagram of procedures. Extracted RNAs are hybridized in buffer with special hairpin DNA probes. Next, FD BamH I is added into the mixture to cut the probes. Following that, exonuclease I is pipetted into the mixture to digest the nonhybridized probes. Then, bridging-PCR is performed to amplify the signals. Exonuclease I is subsequently added into the PCR mixture to digest the excessive biotin-labeled primers. Finally, the mixture is spotted on a nylon membrane, incubated with alkaline phosphatase (AP)-labeled ABC (avidin–biotin complex), and developed with 5-bromo-4-chloro-3-indolyl-phosphate/nitro blue tetrazolium (BCIP/NBT) to produce visible colorimetric end products. Green triangles indicate restriction sites for BamH I. Light blue circle at the end of an arrow denotes biotin, and these arrows indicate primers for PCR amplification. Heavy blue circle indicates colorimetric end products. ssDNA denotes single-stranded DNA. The other symbols are as shown.
In contrast, when the miRNA is absent, the specific probe complementary to it is degraded by BamH I and Exo I, resulting in a lack of pairing regions for further PCR amplification; and all oligos, including the biotinylated primers, are degraded in the post-PCR Exo I step. Then the small biotin moieties are washed away after the sample is spotted on the membrane.
Differential detection of miRNA and its precursor by canonical stem–loop PCR and the new LH-PCR
Stem–loop PCR is a popular specific and sensitive method for individual miRNA detection; however, it requires primers that are often difficult to design. New analysts may frequently observe bands in the negative control lacking a template in agarose gel electrophoresis. For the 50 miRNAs on rat chromosome 1, we selected seven (plus miR-122 and miR-138) to perform stem–loop PCR and discovered that bands were clearly observed when no template was added to the reaction system (Supplemental Fig. S1). Strenuous attempts to optimize the experimental conditions failed to eliminate the band in the negative control lacking miR-99b* (Supplemental Fig. S1). However, designing primers for LH-PCR is easy, given that only the antisense sequence of the miRNA is required.
Theoretically, it is also comparatively difficult for stem–loop PCR to distinguish a miRNA from its precursor when mature miRNA is located at the 3′ terminus of the stem of the hairpin precursor (Fig. 2A). In this case, we accordingly designed a LH-PCR experiment to distinguish miRNA from its precursor (Fig. 2B). Rat miR-429 and miR-200a were used as examples of the performance of stem–loop PCR and of LH-PCR. Commercially synthesized miRNAs and their respective precursor fragment were subjected to both methods. Using low-cycle numbers to assure linearity of amplification, LH-PCR may discriminate miR-429/200a from its respective precursor, whereas stem–loop reverse transcription-polymerase chain reaction (RT-PCR) may not (Fig. 2C). Therefore, LH-PCR offers not only ease of primer design, but more specificity than stem–loop RT-PCR when the miRNA of interest is located at the 3′ end of its stem–loop precursor.
FIGURE 2.
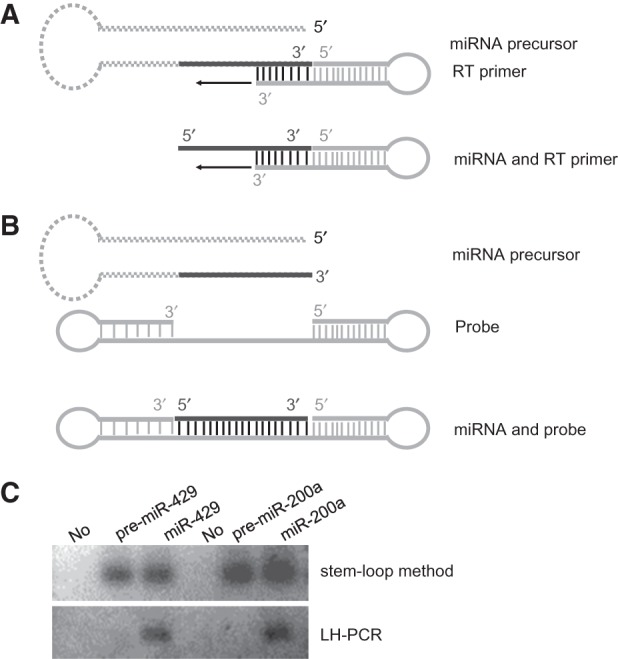
Differential detection of miRNA and its precursor by canonical stem–loop PCR and new LH-PCR. Principle diagrams of the stem–loop PCR (A) and LH-PCR (B) methods detecting miRNA and its precursor are as shown: (dashed gray stem–loop structure) miRNA precursor; (continuous line at the 3′ end of miRNA precursor) the corresponding mature miRNA; (the nicked stem–loop structure) the RT primer; (black arrow) hints transcription; (the two-hairpin structure) hybridization probe. (C) Differential detection of miRNA and its precursor fragments: (upper panel) stem–loop RT-PCR method cannot distinguish miRNA from its precursor; (lower panel) LH-PCR method can. For stem–loop RT-PCR, the starting amount of synthesized RNA fragments was 1 pmol. For LH-PCR, 4 pmol of probe was hybridized with 2 pmol of miR-429/200a or precursors at 55°C. All PCR was performed for 24 cycles. (No) Negative control of no template.
Dynamic range and sensitivity of the LH-PCR assay
The dynamic range and sensitivity of the LH-PCR quantification scheme were evaluated using miR-122 and the SYBR green quantitative polymerase chain reaction (Q-PCR) system. Commercial synthetic miRNA was diluted over seven orders of magnitude and quantified based on the supplier's instructions. The Q-PCR assays demonstrated good linearity between the log of target input and CT-value (Fig. 3A). The specificity of all Q-PCR products was analyzed with a dissociation curve (Fig. 3B). The temperature ranged from 88.2°C to 88.8°C, suggesting that target-specific amplification had occurred. The CT-values correlated well with the miRNAs input (R2 = 0.99852) (Fig. 3C). These results demonstrate that the assay has a dynamic range of at least seven logs and is capable of detecting at least as few as 1 × 10⁻³ fmol of copies in the PCR reaction.
FIGURE 3.

The dynamic range and sensitivity of the LH-PCR assay. (A) Amplification plot of synthetic miR-122 miRNA over seven orders of magnitude. Synthetic RNA input ranged from 1 × 10⁻³ fmol to 1 × 10³ fmol in PCR. (B) Dissociation curves of all the amplicons. (C) Standard curve of the miR-122 miRNA calculated over 10 serial dilutions. The slope is −3.368 and the correlation coefficient is 0.99852.
In contrast, the sensitivity of the conventional radioisotope-based Northern blotting is only ∼1 fmol (Supplemental Fig. S2). aLHCD was evaluated for detecting miRNA expression in experimental cell samples. aLHCD could easily detect the expression of miR-29a in JEG-3 cells using 1 μg of starting total RNAs, whereas the radioisotope-based Northern blotting failed using 20 μg (Supplemental Fig. S3).
As a PCR-based system, aLHCD may be used to quantify the miRNA expression levels in the same way as any PCR method (Supplemental Fig. S4). It may also use U6, GAPDH, or 18S as an internal control. The only difference is that performing PCR amplification requires two bridging primers.
Specificity of aLHCD detection for distinguishing small RNA from its precursor
Just as mentioned above, aLHCD may also be used as a blotting method. Two hairpins at the two ends of the designed anti-sense probe are proposed to provide spatial obstructions preventing a small RNA precursor from hybridizing with the probe (Fig. 1). Figure 4A and C illustrate this principle with sequences. To evaluate this potential, a series of hybridizations were performed using small RNA and its precursor to assess whether our unique probe could distinguish between small RNA and its precursor. The hybridization results for an artificial small RNA and miR-122 indicated that the hairpin probe did not hybridize with the precursor of the small RNA (Fig. 4B,D). When Q-PCR was used to quantify difference, the relative detection efficiencies for miR-122 and its precursor were 100% versus 3.47% (Supplemental Fig. S5). aLHCD does not require gel electrophoresis to separate mature miRNA from its precursor, in contrast to the conventional Northern blotting (Supplemental Fig. S2).
FIGURE 4.

Specificity of aLHCD detection for distinguishing small RNA from its precursor. Synthesized small RNA, synthesized DNA, and precursor transcribed in vitro were hybridized with a synthesized antisense DNA hairpin probe, respectively. (A) The sequences of an artificial small RNA, its precursor, and its probe. (B) Distinguishing small RNA from its precursor. (C) The sequences of rno-miR-122, its precursor, and its probe. (D) Distinguishing rno-miR-122 from its precursor. Two hundred femtomoles small RNA and 400 fmol probe were hybridized at 50°C for artificial small RNA and at 46°C for miR-122. All PCR was performed for 20 cycles. Color was developed with BCIP/NBT for 1 min for the artificial small RNA and 2 min for miR-122. ncRNA denotes negative control. preRNA indicates precursor. arDNA or 122DNA is the DNA equivalent of the RNA sample acting as positive control.
Specificity of aLHCD detection for distinguishing miRNA from its family members
aLHCD allows the detection of a single nucleotide difference in miRNA sequences. A series of hybridizations were performed with commercially synthesized rno-miR-29 and rno-miR-200. For the miR-29 family, rno-miR-29b and rno-miR-29c contain five-base and one-base mismatches, respectively, compared with rno-miR-29a (Fig. 5A), whereas for the miR-200 family, rno-miR-200a and rno-miR-200c contain four-base and one-base mismatches, respectively, compared with rno-miR-200b (Fig. 5C). The detection results showed that rno-miR-29a and -200b could be separated from the other members of their respective families (Fig. 5B,D). In a subsequent Q-PCR assay, the relative detection efficiencies for miR-200b against miR-200a or -200c were 100% versus 3.25% or 0.0% (Supplemental Fig. S6). When miR-29a probes were used to detect miR-29a, -29b, and -29c by Northern blotting, it was very difficult to detect single-nucleotide differences between miRNA family members (Supplemental Fig. S7).
FIGURE 5.

Specificity of aLHCD detection for distinguishing miRNA from its family members. miRNA and DNA were hybridized with an antisense DNA hairpin probe, respectively. (A) The sequences of miR-29b/c/a and its probe are shown. (B) Distinguishing miR-29a from its family members. (C) The sequences of miR-200a/c/b and its probe are shown. (D) Distinguishing miR-200b from its family members. Two picomoles miRNA were hybridized with 4 pmol of probe at 55°C for the miR-29 family and 57°C for the miR-200 family; PCR was performed for 20 cycles for the miR-29 family, 22 cycles for the miR-200 family; color was developed with BCIP/NBT for 3 min for the miR-29 family and 6 min for the miR-200 family.
Differential detection of miRNA and its precursors from tissue samples by aLHCD
The precursors of most of miRNAs are generally not present stably in tissues or cells. To date, the precursors of two typical miRNAs, miR-138 and miR-hong2, have been reported to have high levels of expression in tissues. To test whether aLHCD could distinguish tissue miRNA from its precursor, we selected these two as detection targets. miRNA-138 is a brain-specific miRNA, but its precursor is widely expressed (Obernosterer et al. 2006). miRNA-138 was indeed detected only in brain by aLHCD (Fig. 6A,B) and stem–loop PCR (Supplemental Fig. S8). miR-hong2 is an inflammation-induced miRNA in the epididymis, whereas its precursor is highly expressed in normal epididymis (Ni et al. 2011). The results demonstrated miR-hong2 was indeed detected only in the inflammatory epididymis by aLHCD (Fig. 6C,D). These findings show that aLHCD can be used to detect miRNA when miRNA and its precursor are both expressed. In these tests, the synthesized control precursors could not be detected, further confirming that aLHCD can distinguish miRNA from its precursor just as the abovementioned artificial small RNA and miR-122 do (Fig. 4).
FIGURE 6.

Differential detection of miRNA and its precursor from tissue samples by aLHCD. Extracted RNAs and preRNAs transcribed in vitro were hybridized with synthesized hairpin DNA probes, respectively. (A) The sequences of miR-138, its precursor, and its probe are shown. (B) Detecting miR-138 and its precursor from tissue samples. Twenty femtomoles preRNAs, 1 μg total RNAs, and 4 pmol probes were hybridized at 55°C. (C) The sequences of rno-miR-hong2, its precursor (sequence no. 1428–1587), and its probe are shown. (D) Detecting endogenous rno-miR-hong2 and its precursor. Twenty femtomoles preRNAs, 1 µg total small RNAs, and 4 pmol probes were hybridized at 50°C. PCR was performed for 18 cycles for miR-138 and 20 cycles for miR-hong2. Color was developed with BCIP/NBT for 6 min for miR-138 and 4 min for miR-hong2. The samples were miR-138 precursor, HeLa cells, and liver, kidney, lung, and brain from mice for miR-138, and miR-hong2 precursor, intestine, muscle, epididymal caput, epididymal cauda, and inflammatory epididymal cauda from rat for miR-hong2.
Detection of multiple miRNAs from tissue samples by aLHCD
The use of bridging-PCR in aLHCD makes it easy to detect multiple miRNAs, given that the same primers can be employed for each miRNAs. Using only 4 ng of total small RNAs as starting material, we could simultaneously detect the expression of four miRNAs, miR-122, -200a, -29b, and -429, in several rat tissues on one membrane (Fig. 7). Because our method is very sensitive, many of the strong immunoreactive signals visualized by color development are saturated. Even so, the relative quantities are generally consistent with some known results. For example, miR-122 exhibits the highest expression level in liver, and miR-200a is relatively high in epididymis and liver. These findings mean aLHCD can be used to detect the expression of multiple miRNAs on one membrane, which is thus a kind of macroarray for miRNA detection.
FIGURE 7.

Detection of multiple miRNAs from tissue samples by aLHCD. Four picomoles of the probes (miR-122, -200a, -29b, -429) were hybridized with 4 ng of total small RNAs from various tissues in rat, respectively. The tissues were from the heart, liver, kidney, testis, and epididymis. “No” denotes no samples. PCR was performed for 25 cycles. The color development time was 2 min with BCIP/NBT.
DISCUSSION
Given the increasing importance of miRNA in gene regulation and the discovery of large numbers of new miRNAs, it is difficult for current miRNA detection methods to meet the needs of high sensitivity, high specificity, and great convenience (Cissell et al. 2007). Here, we have presented a combined system for miRNA detection. This system integrates several techniques, including our unique DNA probe design, special enzymes digestion, bridging-PCR amplification, and the LHCD method previously developed by us (Fig. 1; Li et al. 2012). It outperforms the conventional radioisotope-based Northern blotting, RT-PCR, microarray, and deep sequencing in some ways (Wang and Yang 2010).
Solid hybridization-based Northern blotting has specificity for miRNA detection, but less than aLHCD (Fig. 5; Supplemental Fig. S7). Stem–loop RT-PCR was suggested to provide high specificity (Chen et al. 2005); however, it is not the case in practical application (Supplemental Fig. S1). Introduction of LNA modification and some special techniques to microarrays enhances their specificity; however, some concerns about their specificity have been raised (Wang and Yang 2010). aLHCD can distinguish miRNA family members of rno-miRNA-200b and rno-miR-29a (Fig. 5), a result consistent with previous reports using liquid hybridization (Wang et al. 2010; Li et al. 2012). aLHCD can also distinguish miRNAs from their precursors (Figs. 2, 4, 6) but stem–loop RT-PCR cannot when the mature miRNA is located at the 3′ terminus of the stem of the precursor (Fig. 2). Poly (A) polymerase tailing-PCR also cannot distinguish miRNAs from their precursors when the mature miRNA is located at the 3′ terminus of the stem of the precursor (data not shown). Thus, our integrated system has high specificity for miRNAs detection.
The conventional Northern blotting has a detection limit in the nanomolar range, PCR in the femtomolar range, and microarrays in the femtomolar range (de Planell-Saguer and Rodicio 2011). Integration of LNA modification and some special techniques into these approaches greatly increases their sensitivity, but highly sensitive detection methods still need further development (Wang and Yang 2010). The constantly amplified signals by PCR, ABC, and alkaline phosphatase catalysis provided by our system makes it extremely sensitive for miRNA detection. If the system was used as LH-PCR, at least 1 × 10⁻³ fmol miRNA molecules were detected (Fig. 3A), whereas as a blotting method, 20 zmol miRNA molecules could be detected (data not shown), which is considerably more sensitive than the conventional radioisotope-based Northern blotting (Fig. 3; Supplemental Figs. S2, S3). Because of a low coating efficiency caused by the short size of miRNA, the lowest limit of detection by our system is 10 fmol in an enzyme-linked immunosorbent assay (ELISA) (data not shown). For the current robust method of deep sequencing, although the sequencing reads provide an estimation of the level of specific miRNA expression, the method is primarily used to determine the sequences of miRNAs and not as a quantitative or qualitative method.
Solid hybridization-based Northern blotting is suitable for the detection of single miRNA. PCR has multi-throughput potential, but its use requires different conditions for different miRNAs. Microarrays offer high-throughput, but are usually processed by a commercial company and not by an individual analyst. Deep sequencing, which does not suffer from the thermodynamic biases usually associated with hybridization-based microarray and Q-PCR platforms, can provide high-throughput detection of miRNAs and also has the potential to discover previously uncharacterized miRNA species (Lee et al. 2010). However, it is commercially performed, very expensive, and not suitable for laboratory use by researchers. aLHCD, as a blotting method, allows simultaneous detection of multiple miRNAs by the individual analyst (Fig. 7), particularly for researchers without access to next-generation sequencing equipment.
As a PCR-based system, LH-PCR can be used to quantify miRNA levels similar to a common PCR method. Here, we did not highlight its use for quantitative detection. Quantification detection of the miRNA of interest can be done in two ways: first, using an internal control, such as GAPDH, U6, or other standard RNAs, for performing hybridization experiments in parallel with those for the miRNA of interest (Supplemental Fig. S4) or within the same PCR tube; and second, using GAPDH, U6, or other reference RNAs for normalization of the initial amount of RNA sample. It must be stressed that if hybridization experiments are performed with an internal control and the targeted miRNA in the same PCR tube, different bridging primers and universal primers for the internal control and the targeted miRNA are required for the PCR amplification.
In addition, our system possesses some good features. A two-hairpin probe increases the specificity. Liquid hybridization simplifies the operations. Bridging PCR unifies different RNAs into the similar reaction conditions and makes designing primers very easy. A color development system eliminates the use of special rooms and equipment of signals detection. Common reagents and materials make it convenient to use, and it can be used as a blotting method, a PCR method, a macroarray method, or even an ELISA method. In the blotting method of aLHCD, analysts can freely select different membranes and different color development reagents similar to LHCD (Li et al. 2012) and also select special chemiluminescent substrates if a film exposure machine is available (data not shown). However, we do not recommend the use of ELISA because the protocol is complex and the sensitivity is low for the very low coating efficiency of nucleic acid molecules in microporous plates (data not shown). If miRNA expression is abundant, the previous LHCD method can be directly used (Li et al. 2012). However, owing to the sensitivity of aLHCD, optimizing experimental parameters and operating very carefully is critical for applying aLHCD to achieve ideal results. For example, we distinguished rno-miR-29 family members previously at 61°C using a metal bath (Li et al. 2012) but here at 55°C using a PCR machine.
In summary, we have developed a new system by integrating several techniques, including unique probe design, special enzyme digestion, bridging-PCR amplification, and our previous LHCD system. Our system detects miRNA expression with high specificity, sensitivity, and efficiency. Its operations are simple and its application is convenient. It can be used as a blotting method, a PCR method, or a macroarray method based on the user's preference. Thus, this system possesses good potential for convenient detection of miRNAs expression.
MATERIALS AND METHODS
DNA probes and 5′-biotinylated primers were synthesized by Biosune and miRNAs by Genepharma. FastDigest BamH I was purchased from Fermentas; exonuclease I from NEB and Fermentas; bovine serum albumin (BSA), Triton-X-100, Tween-20, ABC-AP, and BCIP/NBT from Boster; 1 × Tris-buffered saline (TBS) buffer from Dycent Biotech; nylon membrane from Roche; and KOD-Plus DNA Polymerase from Toyobo. RNAs were isolated from cells or tissues with Trizol following the supplier's instructions (Invitrogen). Total small RNAs and gel-purified small RNAs were obtained as references (Ni et al. 2011; Li et al. 2012). Precursor RNAs were transcribed in vitro following the directions of the company (Roche) or synthesized by a company (GenePharma).
Liquid hybridization was performed as the LHCD method, that is, isolated RNAs were hybridized in hybridization buffer (1 × Exo I buffer) with two-hairpin DNA probes at 42°C unless otherwise noted (Li et al. 2012). The hybridization mixture was further incubated with FastDigest BamH I (Fermentas) for 1 h at 37°C according to the manufacturer's instructions. After that, the mixture was digested with exonuclease I (NEB) for 5 min at 50°C and then for 1 h at 37°C. The short 50°C step must be performed to disrupt the short five-base-pair stem that remains on the capture oligo after Bam H I cleavage without disrupting hybridization of the miRNA to the capture oligo. The digested mixture was used as the template for PCR, which was performed with KOD-Plus DNA polymerase according to the supplier's instructions. The PCR procedure was for 5 min at 94°C, then for 20 sec at 94°C, for 20 sec at 65°C, for 10 sec at 68°C, X Cycles, and for 5 min at 68°C. The value of X was selected based on the requirement of the respective experiment. The sequences (shown 5′ to 3′) were as follows: 5′ hairpin of probe: 5′-ACGTGCGAAAACGCGCGAT-3′; 3′ hairpin of probe: 5′-TTTATAGGATCCAATAAAAATTGGATCCTATAC-3′; 5′ terminus for PCR bridging: 5′-AGATGTGGTACTGATGTGATGGACTACGTGCGAAAACGCGCGAT-3′; 3′ terminus for PCR bridging: TCACCTCATATCACACAGCACCGAT + miRNA; 5′ biotin-labeled universal primers: F: 5′-TGGTACTGATGTGATGGACT-3′; R: 5′-TCATATCACACAGCACCGAT-3′. Quantitative real-time PCR using SYBR green system was performed according to the supplier's instructions (Toyobo).
The mixture of PCR amplicons was then subjected to digestion with exonuclease I for 0.5−1 h at 37°C. Next, the reaction mixture was spotted onto a nylon membrane and the LHCD method was applied (Li et al. 2012). Briefly, the membrane was incubated with ABC-AP, washed with TBST buffer, and developed with BCIP/NBP to produce colorimetric end products. For all tests, the spotted volume was 1 µL each.
The conventional radioisotope-based Northern blotting was performed as the reference (Ma et al. 2011). Stem–loop PCR primers for reverse transcription and amplification were as follows (shown 5′ to 3′): RmiR-429-RT, TGGACGACCGTGTCGTGGAGTCGGCTAATGGTCGTCCAacggca; RmiR-200a-RT, TGGACGACCGTGTCGTGGAGTCGGCTAATGGTCGTCCAacatcgt; Universe-miRNA, tgtcgtggagtcggctaatg; gene specific stem–loop primers for miR-429, CCAACCtaatactgtctggtaa; RmiR-200a, CCCCtaacactgtctggtaa. The PCR procedure was carried out using the KOD-Plus DNA polymerase system. The other primer sequences used for stem–loop PCR and RT-PCR experiments were listed in the supplemental data.
SUPPLEMENTAL MATERIAL
Supplemental material is available for this article.
ACKNOWLEDGMENTS
We thank members of our group for technical advice and experimental supports. We also deeply appreciate the anonymous reviewers for their invaluable comments and suggestions, which greatly helped to improve our manuscript. This work was supported by the National Natural Science Foundation of China (30930053), the Chinese Academy of Sciences Knowledge Innovation Program (KSCX2-EW-R-07), and the National Basic Research Program of China (2014CB943103).
Glossary
Abbreviations: aLHCD or LH-CD, liquid hybridization and color development with signal amplification; PCR, polymerase chain reaction; RT-PCR, reverse transcription-polymerase chain reaction; Q-PCR, quantitative polymerase chain reaction; ABC, avidin–biotin complex; AP, alkaline phosphatase; BCIP/NBT, 5-bromo-4-chloro-3-indolyl-phosphate/nitro blue tetrazolium; BSA, bovine serum albumin; TBS, Tris-buffered saline; ELISA, enzyme-linked immunosorbent assay
REFERENCES
- Bartel DP 2004. MicroRNAs: Genomics, biogenesis, mechanism, and function. Cell 116: 281–297 [DOI] [PubMed] [Google Scholar]
- Chen C, Ridzon DA, Broomer AJ, Zhou Z, Lee DH, Nguyen JT, Barbisin M, Xu NL, Mahuvakar VR, Andersen MR, et al. 2005. Real-time quantification of microRNAs by stem–loop RT–PCR. Nucleic Acids Res 33: e179. [DOI] [PMC free article] [PubMed] [Google Scholar]
- Chugh P, Dittmer DP 2012. Potential pitfalls in microRNA profiling. Wiley Interdiscip Rev RNA 3: 601–616 [DOI] [PMC free article] [PubMed] [Google Scholar]
- Cissell KA, Deo SK 2009. Trends in microRNA detection. Anal Bioanal Chem 394: 1109–1116 [DOI] [PubMed] [Google Scholar]
- Cissell KA, Shrestha S, Deo SK 2007. MicroRNA detection: Challenges for the analytical chemist. Anal Chem 79: 4754–4761 [Google Scholar]
- de Planell-Saguer M, Rodicio MC 2011. Analytical aspects of microRNA in diagnostics: A review. Anal Chim Acta 699: 134–152 [DOI] [PubMed] [Google Scholar]
- Enos JM, Duzeski JL, Roesch PL, Hagstrom JE, Watt M-AV 2007. MicroRNA labeling methods directly influence the accuracy of expression profiling detection. BioTechniques 42: 378–381 [Google Scholar]
- Huang Y, Shen XJ, Zou Q, Wang SP, Tang SM, Zhang GZ 2010. Biological functions of microRNAs: A review. J Physiol Biochem 67: 129–139 [DOI] [PubMed] [Google Scholar]
- Lee RC, Feinbaum RL, Ambros V 1993. The C. elegans heterochronic gene lin-4 encodes small RNAs with antisense complementarity to lin-14. Cell 75: 843–854 [DOI] [PubMed] [Google Scholar]
- Lee LW, Zhang S, Etheridge A, Ma L, Martin D, Galas D, Wang K 2010. Complexity of the microRNA repertoire revealed by next-generation sequencing. RNA 16: 2170–2180 [DOI] [PMC free article] [PubMed] [Google Scholar]
- Li X, Ni M, Zhang Y 2012. Detecting miRNAs by liquid hybridization and color development. Methods 85: 151–155 [DOI] [PubMed] [Google Scholar]
- Ma W, Xie S, Ni M, Huang X, Hu S, Liu Q, Liu A, Zhang J, Zhang Y 2011. MicroRNA-29a inhibited epididymal epithelial cell proliferation by targeting nuclear autoantigenic sperm protein (NASP). J Biol Chem 287: 10189–10199 [DOI] [PMC free article] [PubMed] [Google Scholar]
- Ni MJ, Hu ZH, Liu Q, Liu MF, Lu MH, Zhang JS, Zhang L, Zhang YL 2011. Identification and characterization of a novel non-coding RNA involved in sperm maturation. PLoS One 6: e26053. [DOI] [PMC free article] [PubMed] [Google Scholar]
- Obernosterer G, Leuschner PJ, Alenius M, Martinez J 2006. Post-transcriptional regulation of microRNA expression. RNA 12: 1161–1167 [DOI] [PMC free article] [PubMed] [Google Scholar]
- Okamura K 2011. Diversity of animal small RNA pathways and their biological utility. Wiley Interdiscip Rev RNA 3: 351–368 [DOI] [PubMed] [Google Scholar]
- Ro S, Park C, Jin J, Sanders KM, Yan W 2006. A PCR-based method for detection and quantification of small RNAs. Biochem Biophys Res Commun 351: 756–763 [DOI] [PMC free article] [PubMed] [Google Scholar]
- Takada S, Asahara H 2012. Current strategies for microRNA research. Mod Rheumatol 22: 645–653 [DOI] [PubMed] [Google Scholar]
- Thomas M, Lieberman J, Lal A 2010. Desperately seeking microRNA targets. Nat Struct Mol Biol 17: 1169–1174 [DOI] [PubMed] [Google Scholar]
- van Rooij E 2011. The art of microRNA research. Circ Res 108: 219–234 [DOI] [PubMed] [Google Scholar]
- Wang Z, Yang B 2010. MicroRNA expression detection methods, pp. 38–53 Springer, Berlin [Google Scholar]
- Wang X, Tong Y, Wang S 2010. Rapid and accurate detection of plant miRNAs by liquid Northern hybridization. Int J Mol Sci 11: 3138–3148 [DOI] [PMC free article] [PubMed] [Google Scholar]
- Zhou H, Arcila ML, Li Z, Lee EJ, Henzler C, Liu J, Rana TM, Kosik KS 2012. Deep annotation of mouse iso-miR and iso-moR variation. Nucleic Acids Res 40: 5864–5875 [DOI] [PMC free article] [PubMed] [Google Scholar]