Abstract
Background
We have previously shown that the transcriptional coregulator NCoR represses astrocytic differentiation of neural stem cells, suggesting that NCoR could be a plausible target for differentiation therapy of glioblastoma.
Methods
To study a putative role for NCoR in regulating glioblastoma cell characteristics, we used RNA-mediated knockdown followed by analysis of gene expression, proliferation and cell growth, autophagy, invasiveness in vitro, and tumor formation in vitro and in vivo. We further performed chromatin immunoprecipitation of NCoR followed by genome-wide sequencing in the human glioblastoma cell line U87 in order to reveal NCoR-occupied loci.
Results
RNA knockdown of NCoR resulted in a moderate increase in differentiation accompanied by a significant decrease in proliferation in adherent U87 human glioblastoma cells. chromatin immunoprecipitation sequencing approach revealed alternative mechanisms underlying the decrease in proliferation, as NCoR was enriched at promoters of genes associated with autophagy such as ULK3. Indeed, signs of an autophagy response in adherent glioblastoma cells included an increased expression of autophagy genes, such as Beclin1, and increased lipidation and nuclear puncta of LC3. Intriguingly, in parallel to the effects in the adherent cells, NCoR knockdown resulted in a significant increase in anchorage-independent growth, and this glioblastoma cell population showed dramatic increases in invasive properties in vitro and tumor formation capacity in vitro and in vivo along with an increased proliferation rate.
Conclusion
Our results unveil unexpected aspects of NCoR regulation of tumor characteristics in glioblastoma cells and highlight the need for caution when transposing developmental concepts directly to cancer therapy.
Keywords: autophagy, ChIP-seq, EMT, invasion, tumor formation
We have previously shown that the transcriptional corepressor NCoR (NCoR1;nuclear receptor corepressor) is a critical regulator for maintaining neural stem cells (NSCs) in an undifferentiated state by directly inhibiting astroglial differentiation.1 Neural stem cells from NCoR gene-disrupted mice were shown to have impaired self-renewal and spontaneously differentiated into astroglia-like cells, whereas overexpression of NCoR repressed astrocytic differentiation. The idea of stem-like cell propagating cancers has been established in leukemia2,3 as well as in breast cancer,4 and the identification of brain-tumor initiating cells5 supports the hypothesis of a general mechanism with cancer stem-like cells being the basis of many tumors. It has further been proposed that NSCs are likely the cells of-origin for various tumors in the central nervous system.6 Along with the concept that NCoR is a crucial factor in keeping NSCs in a nondifferentiated self-renewing state, it has been suggested as a promising differentiation-based therapeutic target in glioblastoma (GBM).7,8 By using a serine/threonine protein phosphatase inhibitor, which leads to an increase in Akt kinase phosphorylation and thereby translocates NCoR to the cytoplasm, an antiproliferative effect and increased Glial Fibrillary Acidic Protein (GFAP) expression in cultured and xenograft glioblastoma cells could be shown.7
Histone deacetylase (HDAC) inhibitors constitute a class of drugs that have generated great expectations as anticancer agents, mainly in combination with other treatments.9 The NCoR repressor complex includes HDAC activity as a main part of the repressing function, and therefore the use of HDAC inhibitors (HDACi) would theoretically block NCoR activity. Indeed, preclinical studies have demonstrated that HDACi induce growth arrest, differentiation, and/or apoptosis in cancer cells and act as potent sensitizers of radiotherapy; clinical trials for treatment of GBM with HDACi are ongoing.10
Programmed cell death, occurring upon detachment from the correct extracellular matrix, is a critical mechanism in preventing cells from inappropriately colonizing elsewhere. This mechanism is named anoikis and is essential for normal tissue homeostasis and development.11 Metastatic spreading of cancer cells as well as invasion to surrounding tissue include 1) a resistance to anoikis 2) involve epithelial-to-mesenchymal-transition (EMT) 3) involve an anchorage-independent growth ability.11 The mechanisms by which a cancer cell acquires these properties are not well understood. Extracranial metastases from GBM are rare, but grade IV GBMs are highly invasive to surrounding brain tissue and cause the altered brain function and high mortality associated with the disease.12
In this study, we show that the transcriptional activity of NCoR and its complex is involved in regulating important pathways including autophagy, EMT as well as anchorage-independent growth ability, and by this setting the criteria for glioblastoma tumor characteristics. Importantly, our findings provide a possible explanation for transcriptional regulation of the invasive GBM phenotype.
Materials and Methods
Cell Line and Transfection
U87 cell lines were purchased from ATCC and grown in Gibco MEM + GlutaMAX supplemented with 10% heat-inactivated fetal bovine serum and 100 U/mL penicillin/streptomycin (Gibco). The primary glioblastoma multiforme lines (38L, 21L, G18L13) were grown under the same conditions. U251MG, U1242MG, U373MG, and U343MG14 were grown in Gibco DMEM supplemented with 10% heat-inactivated fetal bovine serum and 100 U/mL penicillin/streptomycin. Dharmacon ON-TARGET plus SMART pool for human NCoR (L-003518-00-0005) or custom-made control siRNA against ECFP from Dharmafect with the sequence GAAGAACGGCAUCAAGGCCUU (sense), GGCCUUGAUGCCGUUCUUCUU (antisense) were transfected using Dharmafect 1 (Dharmacon) according to protocol. Research protocols involving human samples and animal experiments were performed in accordance with national and local guidelines (ethical permits C207/1 and N110/13.
Growth Curve
Cells were plated in 6-well plates, 15 × 104 cells/well, and transfected the day after (D0). Attached or anchorage-independent growing cells or in combination were collected 24 hours (D1), 48 hours (D2), 72 hours (D3), or 96 hours (D4) after transfection. Living cells were counted in a Bürker chamber after staining the cells with tryphan blue.
Immunostaining
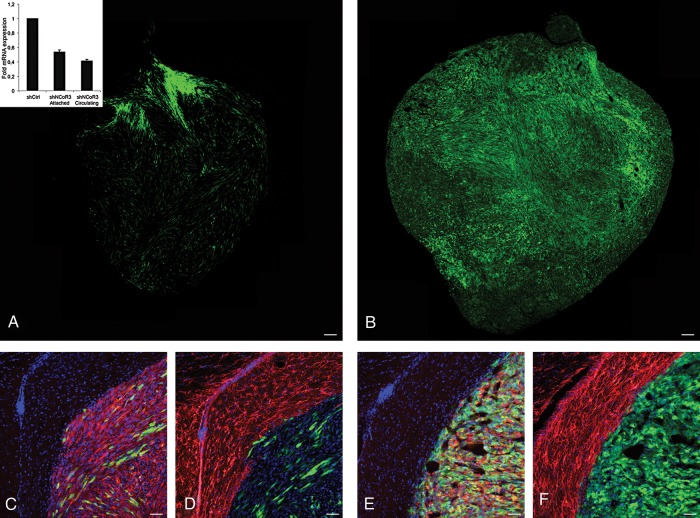
Cells were plated in 35 mm plates, 15 × 104 cells/plate, and transfected the day after. Attached cells were fixed in 10% formalin for 20 minutes at 20°C 48 hours posttransfection. Cells were washed 3 × 5 minutes each with phosphate-buffered saline (PBS) /0.1% Triton-X 100. Cells were incubated with LC3B antibody (Sigma) 1:200 in PBS/0.1%Triton-X/1% BSA overnight. Cells were washed 6 × 5 minutes each before incubation with secondary anti-rabbit AlexaFluor (Invitrogen) antibody 1:500 in PBS/0.1%Triton-X/1% BSA for 1 hour in 20°C followed by 3 × 5 minutes washing in PBS. Plates were briefly air-dried before a coverslip was mounted with Vectashield mounting medium containing DAPI (Vector Laboratories) and analyzed using a Zeiss Axioscope fluorescence microscope. For in vivo tissues, frozen brains were cut into 30 μm sections using a Leica Microtome into antifreezing medium (40% PBS, 30% ethylene glycol, 30% glycerol). Floating sections were repeatedly washed in PBS, blocked in 0.5% glycine, 0.2% Triton X-100, and 0.05% sodium azide in PBS, and incubated with primary antibody DAPI 1:1000 (Molecular Probes), goat anti-GFP 1:500 (Abcam), mouse anti-human nuclei 1:500 (Millipore), mouse anti-nestin 1:500 (Millipore), mouse anti-NeuN 1:1000 (Millipore), mouse anti-GFAP 1:100 (Abcam), and rabbit anti-Ki67 1:500 (Abcam) in 4°C overnight. After subsequent incubation with Alexa Fluor-conjugated (−488, −555, −647) secondary antibody (Molecular Probes, Life Technologies) sections were mounted onto Superfrost Plus slides (Thermo Scientific). Images were taken with a LSMS exciter confocal microscope (Zeiss) and analyzed with photoshop CSS (Adobe). For the overview images in figure 6A–B, several 5X microscopic fields were aquired and merged using the photomerge function in photoshop. The images in panels 6C–F were aquired with a 10X objective.
Invasion Assay
In vitro cell invasiveness was determined by the ability of cells to transmigrate through a layer of extracellular matrix in cell invasion chambers (Chemicon International). The extracellular matrix was reconstituted by adding serum-free media in the inserts for 2 hours. Cells were transfected and plated in medium without serum and antibiotics in the inserts (3.0 × 10⁵ cells), and medium with serum and antibiotics were added in the lower chamber after 6 hours. Noninvading cells were removed with cotton swabs 48 hours posttransfection. Invading cells were fixed, stained, and counted in a Zeiss Cell Observer microscope.
Colony-forming 3D Assay
Cells were plated and transfected in 6-well plates. Forty-eight hours posttransfection, the anchorage-independent growing cells were collected by centrifugation of the medium (180G for 5 min) and resuspended in the medium. The cells were stained with trypan blue, counted, and 5 000 single cells from each condition were collected by centrifugation (180G for 5 min), resuspended in 25 μL collagen matrix (Rat tail Collagen, Invitrogen ) on ice, and plated in a 96-well plate. Three days after plating, colonies were fixed in 2% formalin/PBS for 20 minutes at room temperature after rinsing in PBS. The colonies were stained with DAPI and phalloidin-Alexa488 in PBS/Tween for 2 hours at 20°C, followed by rinsing with PBS twice, and then quantified and imaged under a Zeiss Cell Observer microscope.
Gene Expression
Total RNA was extracted using RNeasy Mini Kit (Qiagen), cDNA was synthesized using High Capacity cDNA Reverse Transcription kit (Applied Biosystem), and qRT-PCR was performed with Fast SYBR Green Master Mix (Applied Biosystems). Expression levels were normalized to β-actin levels.
ChIP and ChIP-seq
Chromatin immunoprecipitation (ChIP) was performed following the High Cell ChIP kit # protocol from Diagenode. Five micrograms of anti-NCoR from Abcam (ab24552) were used in each IP. ChIP analysis was done with Q-PCR using Invitrogen Platinum SYBR Green qPCR Supermix-UDG together with site-specific primers. For genome-wide sequencing ChIP sequencing (ChIP-seq) analysis, 5 μg of chromatin was used in 2 separate IP's and combined into one elution. Subsequently, the DNA sequencing library was made using a kit from Illumina, except Illumina TruSeq adaptors were used to enable multiplexing. The library was analyzed by Solexa/Illumina Hi-seq. After prefiltering the raw data by removing sequenced adapters and low-quality reads, the sequence tags were aligned to the human genome (assembly hg19) with a Bowtie alignment tool.15 To avoid any PCR-generated spikes, we allowed only one read per chromosomal position and thus eliminated PCR bias. From the filtered raw data, 2 million unique reads per sample were used for peak detection. Peak detection was performed using the CisGenome program16 with a 2-sample analysis where sequenced input (1%) was used as a negative control. Peaks were called with a window statistic cutoff of 3 and a log2 fold change of 2.
Cell Proliferation Assay
The cell proliferation was measured using the Click-iT EdU imaging kit from Invitrogen according to the manufacturer's protocol. After final staining with Hoechst, the cells were mounted on a coverslip using Vectashield mounting medium (Vector Laboratories) and analyzed with a Zeiss Axioscope fluorescence microscope.
Flow Cytometry
The distribution of cells in the cell-cycle phases was determined by DNA flow cytometry as described earlier.17, Cells were incubated 48 hours posttransfection with 30 μM BrDU for 50 minutes at 37°C before being harvested, washed in PBS, and fixed in 70% ice-cold ethanol. The fixed cells were stained with BrDU primary antibody and a fluorescent secondary antibody as well as being stained with propidium iodine (10 µg/mL propidium iodine, 1 × PBS, 100 µg/mL RNaseA at 37°C for 30 minutes. Flow cytometric analysis was carried out on 10 000 gated cells using a FACSCalibur flow cytometer equipped with CellQuest software (Becton Dickinson).
Production and Titration of Lentiviral Particles
HEK293FT cells were plated on 15 cm culture dishes and grown to 80% confluence. The culture medium was changed just prior to transfection, and a total of 20.25 μg plasmid DNA was used for Lipofectamine 2000 (Invitrogen) transfection according to the manufacturer's protocol. Lentiviral supernatants were prepared by cotransfection of cells using 6.75 μg expression vector (pLKO.1-puro-CMV-tGFP-shNCoR [4 separate vectors from Sigma-Aldrich] or pLKO.1-puro-CMV-tGFP nontarget control), 6.75 μg envelope vector (pMD2.G), and 6.75 μg packaging vector (psPAX2). The culture medium was replaced 4 hours posttransfection, and viral supernatants were collected 48 and 72 hours later. Viral supernatants were filtered through a 0.22 μm bottle-top vacuum filter (Corning), and viral particles were concentrated by ultracentrifugation at 28 000 rpm for 2 hours at 4°C. Viral pellets were resuspended in basic DMEM growth medium and stored at −80°C. Viral titers were determined in HEK293FT cells. The number of cells per well was counted at the time of transduction, and viruses were added in 4-fold dilutions. After 72 hours, cells were harvested and analyzed for fluorescent protein expression by FACS. Viral titer was calculated as transforming units (TU)/mL according to (number of cells [on the day of transduction] × [% fluorescent cells/100) × dilution]).
Viral Transduction and Sorting of U87 Cells
One day before transduction, cells were plated in 35 mm culture dishes. Viral particles were added to cells in a minimal amount of cell medium at multiplicity of infection (MOI) 2–4. Fresh medium was added 3 hours posttransduction. Cells were then expanded in culture, sorted for GFP-expressing cells using BD FACSAria II, and routinely grown as described above. The 4 separate NCoR knockdown lines were screened for knockdown efficiency of NCoR on the mRNA level in order to pick one line for the subsequent transplantations. The sequence of the chosen knockdown construct was GCTCTCAAAGTTCAGACTCTT.
Mouse Intracranial Injections
Four-to-six-week old NOD.CB17-PrkcSCID/J mice (Jackson Laboratory) were anesthetized (4% isoflurane) and received a stereotactically guided injection of 250 000 human stably transduced (shCtrl or selected shNCoR) U87 glioblastoma cells into the right striatum (2 mm lateral and 1 mm anterior to bregma at 2.5 mm depth) in 2 μL PBS. At 2 and 3 weeks after injection, mice were anesthetized using Avertin and perfused first with PBS and subsequently with 4% paraformaldehyde. The brain was removed, and further fixed in 4% paraformaldehyde in a cold room overnight. After cryopreservation in 30% sucrose overnight, brains were snap-frozen and stored at −80°C until further use.
Results
NCoR Regulates Tumor Cell Growth
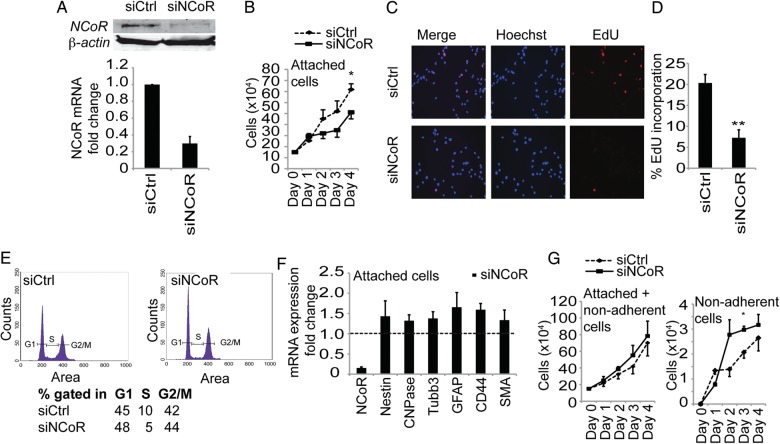
Cell lineage commitment typically involves cell cycle arrest. In order to characterize the regulatory effect of NCoR in glioblastoma tumor cells, we first monitored cell growth upon NCoR knockdown in the epitheloid14 glioblastoma multiforme cell line U87. Using transfection of siRNA against NCoR or control siRNA (Fig. 1A), we observed a significant decrease in the number of cells growing attached to the plastic surface over a 4-day period (Fig. 1B). EdU incorporation, monitored with Click-iT EdU Alexa Fluor imaging (Fig. 1C and 1D), and also BrdU incorporation, analyzed with flow cytometry (Fig. 1E), confirmed reduced cell growth with a decrease in the fraction of cells in S-phase (reduced from 10% to 5%) when NCoR was knocked down. To monitor whether the cell cycle arrest was combined with cell differentiation, we analyzed the mRNA expression levels of neural-lineage specific markers. Removal of NCoR from embryonic cortical progenitors induces a spontaneous differentiation into the astroglia lineage.1 Knockdown of NCoR in the U87 glioblastoma cells induced a modest and general increase (Fig. 1F) in gene expression of a stem cell marker (Nestin) as well as markers for astrocytes (GFAP and CD44), neurons (Tubb3), oligodendrocytes (CNPase), and smooth muscle/mesenchymal (SMA). The cells with decreased levels of NCoR looked morphologically very similar to the control cells, and no convincing differentiation was observed. Knockdown of NCoR in other glioblastoma primary lines and cell lines (hMG38L, hMG21L, hMG18L, U251MG, U373MG, and U1242MG) showed a similar modest and general increase in differentiation markers (Supplementary Fig. S1). The GBM cell line U87 with an epitheloid morphology,14 however, specifically displayed 2 separate cell populations in vitro: cells growing attached to the cell plastic surface and cells growing as anchorage-independent circulating cell colonies. Interestingly, the entire population, including both attached and anchorage-independent growing cells, comprised basically the same number of cells after 4 days of NCoR removal (Fig. 1G) since the fraction of anchorage-independent growing cells was significantly higher (Fig. 1H). The BrdU incorporation monitored with flow cytometry in nonadherent cells revealed a maintained fraction of cells in S-phase when NCoR was knocked down compared with the anchorage-independent growing cells with control (GFP) knockdown (Supplementary Fig. S2).
Fig. 1.
NCoR regulates tumor cell growth. The glioblastoma multiforme cell line U87 grew in 2 separate cell populations in vitro, with cells growing attached to the cell plastic surface and other cells growing as anchorage-independent cell colonies. (A) Reduction of NCoR mRNA and protein levels upon delivery of short interfering RNA. (B) Growth curve of siCtrl cells and siNCoR cells in a period of 4 days after knockdown in the cell population growing attached to the plastic surface. Data include 4 biological replicates. Error bars represent standard error of the means (SEM). * P = .05 with Student t test on day 4. (C) EdU incorporation in the attached growing cells analyzed 48 hours after knockdown. (D) Quantification of EdU incorporation reveals a significant decrease in EdU incorporation (**P = .009 with Student t test). Data presented as percent cells with EdU staining and include 3 biological replicates. Error bars represent SEM. Statistics calculated with Student t test. (E) Flow cytometry on control and NCoR knockdown cells. Experiment performed in 3 biological replicates and one representative graph is shown. Percentage of cells gated in G1, S and G2/M and percent of BrDU incorporated cells. (F) mRNA expression levels of differentiation markers after knockdown of NCoR in the attached cells. Data include 4 biological replicates and are presented as fold over the control knockdown cell mRNA levels (shown as a dashed line). Error bars represent SEM. (G) Growth curve of the entire U87 cell population, including both attached and nonadherent cells, in a period of 4 days after knockdown. (H) Growth curve specifically of nonadherent cells. Data include 4 biological replicates. Error bars represent SEM. Student t test shows a significant change on day 3 (P = .03).
Induction of an Autophagy-like Response in Attached Cells upon NCoR Knockdown
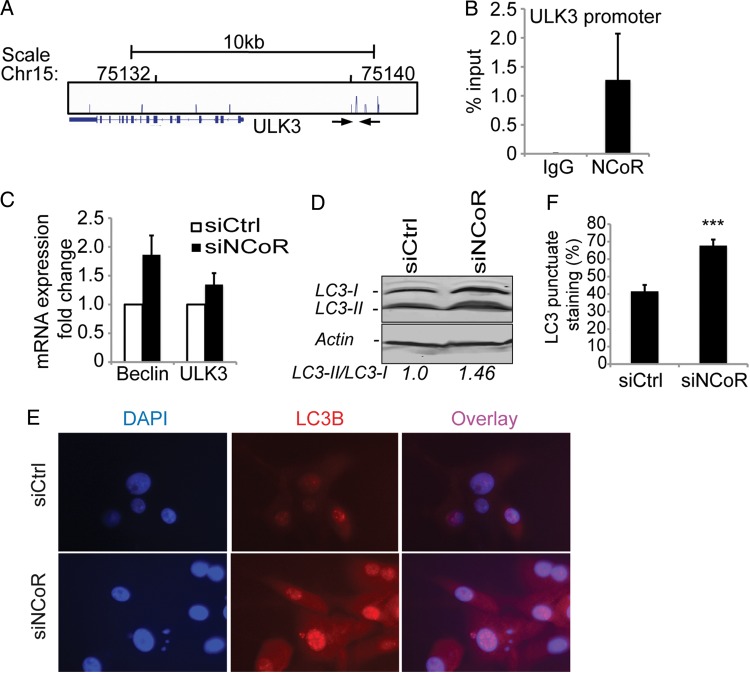
The clear proliferative-inhibited phenotype of the attached cells and weak induction of differentiation markers at the same time suggested a resting state for these cells. Notably, ChIP, followed by ChIP-seq analysis of NCoR occupancy in the attached U87 cells, identified an NCoR peak in the autophagy gene ULK3 promoter (Fig. 2A). The identified NCoR peak was confirmed with single-gene ChIP-qPCR using primers spanning the defined-peak region (Fig. 2B). The NCoR promotor association correlates with a functional repression of the gene since removal of NCoR by siRNA derepressed the mRNA expression of ULK3 (Fig. 2C). In addition, another important autophagy gene, Beclin1, was also derepressed upon NCoR knockdown, which suggests an activation of the autophagy pathway (Fig. 2C). In order to monitor increased autophagy response, we analyzed the lipidation of LC3. Indeed, a robust increase in the lipidation of LC3 (Fig. 2D) and increased nuclear punctate LC3 staining (Fig. 2E and F) were observed upon NCoR knockdown in the attached cells.
Fig. 2.
Induction of an autophagy response in attached cells upon NCoR knockdown. A genome-wide ChIP-seq analysis of NCoR occupancy in U87 cells identified ∼1600 binding sites. (A) One identified NCoR peak is located in the autophagy gene ULK3 promoter. (B) ChIP-qPCR confirmed this peak. Data presented as percent input and include 3 biological replicates. Error bars represent represent standard error of the means (SEM). The location of the used primers spanning the identified ChIP-seq peak is indicated with arrows in (A). (C) mRNA expression levels of the autophagy genes Beclin and ULK3 upon NCoR knockdown. Data presented as a fold change over control knockdown cell mRNA levels and include 4 biological replicates. Error bars represent SEM. (D) Western blot showing a 46% increase in the lipidation of LC3 upon NCoR knockdown in the attached cells. β-actin was used as a loading control, and ImageJ was used for band quantification. (E) An increased nuclear localization and punctate staining of LC3 in NCoR-deficient cells is observed with immunostainings. (F) Quantification of percentage of cells containing a punctate nuclear staining. The significant difference shown was calculated with Student t test; P = 1 × 10⁻⁵.
NCoR Regulates Cell Population-specific Epithelial-to-Mesenchymal Transition Gene Expression Signature
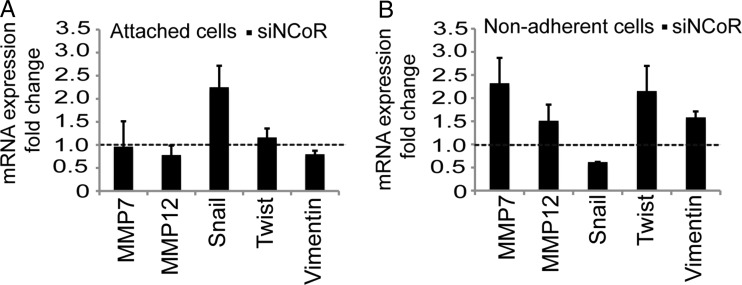
Next, we wanted to characterize the differences between the growth-inhibited surface-attached cell population and the increasing nonadherent tumor-cell population by monitoring targeted gene expression. We analyzed genes involved in cell invasion and in EMT. We observed a clear upregulation of MMP-7 and MMP-12, crucial cell invasion metalloproteinases, upon NCoR knockdown compared with the control knockdown in the nonadherent tumor cells (Fig. 3B). Removal of NCoR in the attached cells did not affect the levels of the tested metalloproteinases (Fig. 3A), again indicating a difference in tumor characteristics between the 2 cell populations. The same signature is seen for vimentin and Twist, where an upregulation is seen in the NCoR-deficient nonadherent cells while being unaffected in the attached cells (Fig. 3A and B). Taken together, the gene expression signature observed in the NCoR-deficient nonadherent cells pointed to an increase in EMT with an increased invasion capacity. Interestingly, the attached fraction of additional glioblastoma cell lines also displayed an upregulation of vimentin, as in the case of U373MG, and metalloproteinases in the cases of U1242MG, U251MG, and U373MG (Supplementary Fig. S1) upon NCoR knockdown.
Fig. 3.
NCoR regulates cell-population-specific epithelial to mesenchymal transition gene expression signature. mRNA expression levels of genes involved in epithelial to mesenchymal transition and invasion in the attached (A) and nonadherent (B) cells at 48 hours after knockdown. Data include 4 biological replicates and are presented as fold over control knockdown cell levels (shown with a dashed line) in each population. Error bars represent standard error of the means.
NCoR Knockdown Increases the Invasive Properties of U87 Cells in Vitro
Guided by the gene expression signature observed in the NCoR deficient nonadherent cells in combination with an increased fraction of anchorage-independent growing cells, we decided to characterize the possibly increased invasion capacity with an extracellular matrix invasion Boyden chamber assay. U87 cells have been shown to display invasive properties,18 but we found that removal of NCoR (Fig. 4B) doubled the capacity of the tumor cells to invade through an extracellular matrix more deeply compared with control knockdown cells (Fig. 4A).
Fig. 4.
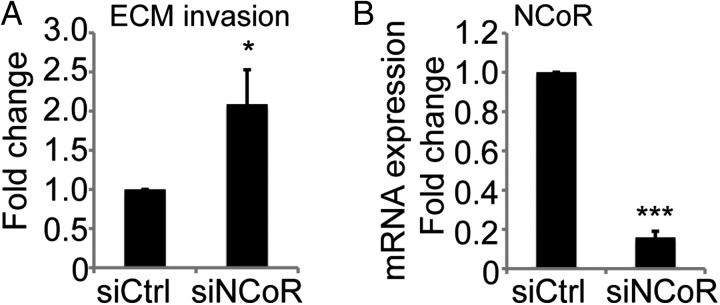
Knockdown of NCoR increases the invasive properties of U87 cells. (A) Invasion properties analysed by counting the number of transwell invasive cells in a Boyden chamber coated with extracellular matrix. Data presented as fold change over control knockdown cells. Data include 3 biological replicates. Error bars represent standard error of the means. Statistics calculated with Student t test; P = .04 (B) Level of NCoR knockdown on mRNA expression from the 3 biological replicates in (A). Data presented as fold change from control knockdown cells and statistics calculated with Student t test; P = 2 × 10⁻⁷.
NCoR Knockdown Increases Tumor Formation Properties in Vitro and in Vivo
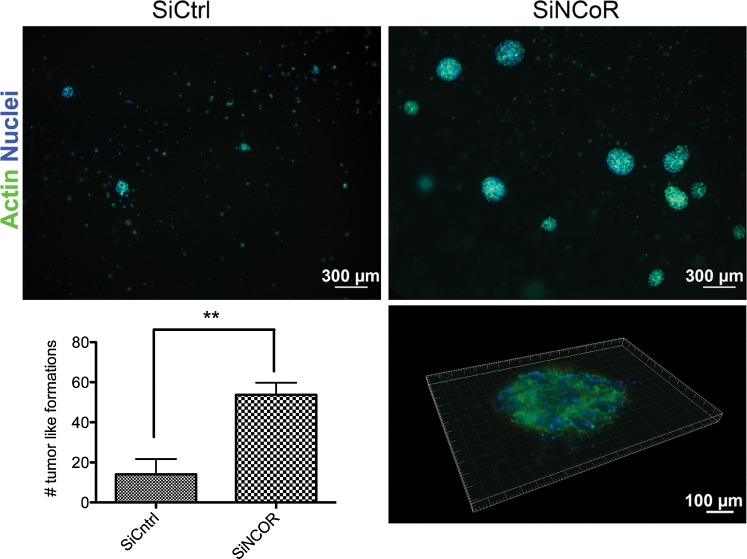
Increased invasion ability requires a capacity to survive if detached from the original matrix. Since the NCoR-deficient nonadherent cells showed an increased ability to invade, we wanted to test the tumor formation ability in a soft gel context. The cells were plated in a petri dish and transfected with control siRNA or siNCoR. After 48 hours, the anchorage-independent growing cells from each condition were collected and counted, and an equal number of cells were resuspended in a collagen matrix on ice and plated. The cells were grown embedded in the soft collagen gel 3D assay for 3 days before colony analysis in the microscope. Nearly 4 times more (3.7) and significantly larger tumor-like formations were identified in the NCoR-deficient condition compared with control, thus revealing an increased growth-advantage compared with the nonadherent tumor cells with intact NCoR levels (Fig. 5).
Fig. 5.
Knockdown of NCoR increases tumor formation properties in collagen gel. Tumor formation properties upon NCoR knockdown monitored in 3-dimensional collagen gel culture. Anchorage-independent growing tumor cells from control and NCoR knockdown cells collected at 48 hours after siRNA introduction were counted, and equal number of cells from each condition were plated after resuspension in a collagen matrix. Tumor formations were stained with actin and DAPI and visualized and quantified in an inverted microscope. Quantification included 4 biological replicates. Error bars represent standard error of the means. ** Student t test, P = .006.
In order to confirm the observed NCoR-dependent regulation of tumor characteristics in an in vivo situation, we transplanted stably transduced (shCtrl or selected shNCoR) U87 glioblastoma cells into the right striatum of 6 mice per group. The stable line used showed a 50% knockdown on NCoR mRNA level in both attached and nonadherent cells (Fig. 6A, insert). The mice were euthanized at either 2 or 3 weeks after injection, and their brains were removed and examined for tumor formation. The 3 control mice that were euthanized after 2 weeks showed no obvious signs of tumor formation, while all 3 mice transplanted with cells with NCoR knockdown displayed initial tumor formation (data not shown). Three weeks after transplantation, clear tumor growth could be observed in mice transplanted with either control or NCoR knockdown cells (Fig. 6A and B). Interestingly, NCoR-deficient tumors were bigger and denser compared with the control tumors in all 3 mice. No obvious increase in differentiation was detected in any of the tumors (Fig. 6C–F). These results strengthened the in vitro observations and indicated a growth advantage of cells harboring NCoR knockdown compared with tumor formation with intact NCoR levels.
Fig. 6.
In vivo tumor formation after transplantation with U87 cells treated with shRNA against NCoR vs control. Tumor formation capacity examined in mice injected with stably transduced GFP-tagged U87 shControl or shNCoR knockdown glioblastoma cells into the right striatum. Overview of tumor formed 3 weeks after injection of control U87 cells (A) and NCoR knockdown cells (B). Staining with Nestin (red) and DAPI (blue) shown together with GFP (injected cells) at the tumor boundary from control (C) and NCoR knockdown (E). Staining with the astrocytic marker GFAP (red) shown together with DAPI (blue) and GFP from control (D) and NCoR knockdown (F) Tumor. mRNA expression levels of NCoR in the stable lines (insert in A). Scale bars represent 100 µm (A and B) and 50 µm (C–F).
Discussion
The rationale behind using NCoR as a target in the search for improved GBM treatment strategies came from the fact that NCoR is a known repressor of differentiation in neural stem cells1 and that cancer stem-like cells have been identified in glioblastoma tumors, together with the observation that GBM specimens display a dramatically increased expression of NCoR.8,19 However, in light of the findings in this study, a concern arises whether targeting NCoR directly or using HDACis such as valproic acid for GBM treatment can contribute to changing tumor characteristics and promote an invasive nature of the cancer cells despite the possibly increased sensitivity to radiotherapy. The transcriptional repressive function of the NCoR complex is of a general nature and has been reported to be involved in many situations in various tissues;20 therefore, a full characterization of NCoR function in GBM is particularly relevant. The regulation of genes like metalloproteinases, vimentin, and Twist observed in the anchorage-independent growing U87 cells and some of the other lines upon NCoR knockdown concurs with the in vitro monitored ability of anchorage-independent tumor formation and increased invasion. Vimentin and Twist are used as markers of mesenchymal cells or cells undergoing EMT during normal development or metastatic progression.21,22 Increased vimentin expression in cancer is associated with accelerated tumor growth and tumor cell invasion as well as poor prognosis.
Importantly, our study definitely supports the antiproliferative effect seen upon NCoR disruption in GBM cells as reported in other studies;7 however, it is restricted to the attached cells in our study. The general increase in several lineage-specific markers, including stem cell markers, does not suggest a specific lineage commitment but rather reflects a confused nonsynchronized situation. The nonsignificant sign of differentiation upon NCoR removal in the neural cancer cells separates them from normal neural stem/progenitor cells. Autophagy is a lysosome-dependent degradation pathway serving as a quality control mechanism that allows the cell to generate ATP in stressful situations. The pathway has been shown to play an essential role during monocyte differentiation and is speculated to be a crucial part of differentiation in general.23,24
The shift of tumor cell characteristics that we observed (eg, provoking a resting state as well as increasing tumor-like sphere formation in a 3D assay) is of high importance and concern because nondividing cells are not targetable by conventional chemotherapy and their increased invasiveness allows colonization elsewhere. Intriguingly, the NCoR complex was recently demonstrated to be involved in promoting the invasion of esophageal cancer cells by inhibiting CXCL10 in a CK-2 dependent manner.25 In addition, enhanced invasive activities of NCoR-/-macrophages have been reported.26 Direct NCoR binding to MMP promoters in the macrophages was also demonstrated. Even though these examples have different cancer origins and cell types, they support the observation that the NCoR complex can be involved in regulating tumor cell characteristics. In the integrated genomic analysis done by the Cancer Genome Atlas Network, a molecular classification defined 4 GBM subtypes from an independent set of 260 GBM expression profiles. The mesenchymal subtype, which is characterized by a higher activity of mesenchymal and astrocytic markers (CD44 and MERTK), displays a low NCoR expression compared with the classical and the proneural subtypes, while the metalloproteinases 7 and 12 and vimentin, Twist and Snai1 are upregulated and correlate with an invasive phenotype gene signature.27 These reports are similar to our observations about NCoR knockdown.
Taken together, it is evident that the transcriptional activity of NCoR and its complex is involved in regulating important pathways that set the criteria for tumor characteristics. The established function in neural stem cells as being a pluripotency guard, which translates to the pool of cancer stem-like cells, may complicate efficient eradication of tumors and may also expand to controlling invasion and anoikis resistancy in cancer cells.
Supplementary Material
Funding
This work was supported by the Swedish Childhood Cancer Foundation (O.H., J.H.), Lilian Sagen and Curt Eriksson research foundation (J.H.), VR-MH (project grant 2011-3457 and DBRM), the Knut and Alice Wallenberg Foundation (CLICK), KI TEMA, Vinnova, and the Swedish Cancer Society (O.H.).
Supplementary Material
Acknowledgments
We thank Anna Johnsson and Sten Linnarsson for sequencing assistance, and Bertrand Joseph and the Hermanson lab members for discussions and experimental guidance.
Conflict of interest statement. None declared.
References
- 1.Hermanson O, Jepsen K, Rosenfeld MG. N-CoR controls differentiation of neural stem cells into astrocytes. Nature. 2002;419(6910):934–939. doi: 10.1038/nature01156. [DOI] [PubMed] [Google Scholar]
- 2.Lapidot T, Sirard C, Vormoor J, et al. A cell initiating human acute myeloid leukaemia after transplantation into SCID mice. Nature. 1994;367(6464):645–648. doi: 10.1038/367645a0. [DOI] [PubMed] [Google Scholar]
- 3.Bonnet D, Dick JE. Human acute myeloid leukemia is organized as a hierarchy that originates from a primitive hematopoietic cell. Nat Med. 1997;3(7):730–737. doi: 10.1038/nm0797-730. [DOI] [PubMed] [Google Scholar]
- 4.Al-Hajj M, Wicha MS, Benito-Hernandez A, Morrison SJ, Clarke MF. Prospective identification of tumorigenic breast cancer cells. Proc Natl Acad Sci USA. 2003;100(7):3983–3988. doi: 10.1073/pnas.0530291100. [DOI] [PMC free article] [PubMed] [Google Scholar]
- 5.Nduom EK, Hadjipanayis CG, Van Meir EG. Glioblastoma cancer stem-like cells: implications for pathogenesis and treatment. Cancer J. 2012;18(1):100–106. doi: 10.1097/PPO.0b013e3182452e0d. [DOI] [PMC free article] [PubMed] [Google Scholar]
- 6.Hertwig F, Meyer K, Braun S, et al. Definition of genetic events directing the development of distinct types of brain tumors from postnatal neural stem/progenitor cells. Cancer Res. 2012;72(13):3381–3392. doi: 10.1158/0008-5472.CAN-11-3525. [DOI] [PMC free article] [PubMed] [Google Scholar]
- 7.Lu J, Zhuang Z, Song DK, et al. The effect of a PP2A inhibitor on the nuclear receptor corepressor pathway in glioma. J Neurosurg. 2010;113(2):225–233. doi: 10.3171/2009.11.JNS091272. [DOI] [PubMed] [Google Scholar]
- 8.Park DM, Li J, Okamoto H, et al. N-CoR pathway targeting induces glioblastoma derived cancer stem cell differentiation. Cell Cycle. 2007;6(4):467–470. doi: 10.4161/cc.6.4.3856. [DOI] [PubMed] [Google Scholar]
- 9.Ai T, Cui H, Chen L. Multi-targeted histone deacetylase inhibitors in cancer therapy. Curr Med Chem. 2012;19(4):475–487. doi: 10.2174/092986712798918842. [DOI] [PubMed] [Google Scholar]
- 10.Shabason JE, Tofilon PJ, Camphausen K. Grand rounds at the National Institutes of Health: HDAC inhibitors as radiation modifiers, from bench to clinic. J Cell Mol Med. 2011;15(12):2735–2744. doi: 10.1111/j.1582-4934.2011.01296.x. [DOI] [PMC free article] [PubMed] [Google Scholar]
- 11.Taddei ML, Giannoni E, Fiaschi T, Chiarugi P. Anoikis: an emerging hallmark in health and diseases. J Pathol. 2012;226(2):380–393. doi: 10.1002/path.3000. [DOI] [PubMed] [Google Scholar]
- 12.Newton HB, Rosenblum MK, Walker RW. Extraneural metastases of infratentorial glioblastoma multiforme to the peritoneal cavity. Cancer-Am Cancer Soc. 1992;69(8):2149–2153. doi: 10.1002/1097-0142(19920415)69:8<2149::aid-cncr2820690822>3.0.co;2-g. [DOI] [PubMed] [Google Scholar]
- 13.Holmberg J, He X, Peredo I, et al. Activation of neural and pluripotent stem cell signatures correlates with increased malignancy in human glioma. PLoS One. 2011;6(3):e18454. doi: 10.1371/journal.pone.0018454. [DOI] [PMC free article] [PubMed] [Google Scholar]
- 14.Nister M, Libermann TA, Betsholtz C, et al. Expression of messenger RNAs for platelet-derived growth factor and transforming growth factor-alpha and their receptors in human malignant glioma cell lines. Cancer Res. 1988;48(14):3910–3918. [PubMed] [Google Scholar]
- 15.Langmead B, Trapnell C, Pop M, Salzberg SL. Ultrafast and memory-efficient alignment of short DNA sequences to the human genome. Genome Biol. 2009;10(3):R25. doi: 10.1186/gb-2009-10-3-r25. [DOI] [PMC free article] [PubMed] [Google Scholar]
- 16.Ji H, Jiang H, Ma W, Johnson DS, Myers RM, Wong WH. An integrated software system for analyzing ChIP-chip and ChIP-seq data. Nat Biotechnol. 2008;26(11):1293–1300. doi: 10.1038/nbt.1505. [DOI] [PMC free article] [PubMed] [Google Scholar]
- 17.Castro DS, Hermanson E, Joseph B, et al. Induction of cell cycle arrest and morphological differentiation by Nurr1 and retinoids in dopamine MN9D cells. J Biol Chem. 2001;276(46):43277–43284. doi: 10.1074/jbc.M107013200. [DOI] [PubMed] [Google Scholar]
- 18.Rutka JT, Ivanchuk S, Mondal S, et al. Co-expression of nestin and vimentin intermediate filaments in invasive human astrocytoma cells. Int J Dev Neurosci. 1999;17(5–6):503–515. doi: 10.1016/s0736-5748(99)00049-0. [DOI] [PubMed] [Google Scholar]
- 19.Li J, Zhuang Z, Okamoto H, et al. Proteomic profiling distinguishes astrocytomas and identifies differential tumor markers. Neurology. 2006;66(5):733–736. doi: 10.1212/01.wnl.0000201270.90502.d0. [DOI] [PubMed] [Google Scholar]
- 20.Perissi V, Jepsen K, Glass CK, Rosenfeld MG. Deconstructing repression: evolving models of co-repressor action. Nat Rev Genet. 2010;11(2):109–123. doi: 10.1038/nrg2736. [DOI] [PubMed] [Google Scholar]
- 21.Satelli A, Li S. Vimentin in cancer and its potential as a molecular target for cancer therapy. Cell Mol Life Sci. 2011;68(18):3033–3046. doi: 10.1007/s00018-011-0735-1. [DOI] [PMC free article] [PubMed] [Google Scholar]
- 22.Savagner P. The epithelial-mesenchymal transition (EMT) phenomenon. Ann Oncol. 2010;21(Suppl 7):vii89–vii92. doi: 10.1093/annonc/mdq292. [DOI] [PMC free article] [PubMed] [Google Scholar]
- 23.Jacquel A, Obba S, Boyer L, et al. Autophagy is required for CSF-1-induced macrophagic differentiation and acquisition of phagocytic functions. Blood. 2012;119(19):4527–4531. doi: 10.1182/blood-2011-11-392167. [DOI] [PubMed] [Google Scholar]
- 24.Vessoni AT, Muotri AR, Okamoto OK. Autophagy in stem cell maintenance and differentiation. Stem Cells Dev. 2012;21(4):513–520. doi: 10.1089/scd.2011.0526. [DOI] [PubMed] [Google Scholar]
- 25.Yoo JY, Choi HK, Choi KC, et al. Nuclear hormone receptor corepressor promotes esophageal cancer cell invasion by transcriptional repression of interferon-gamma-inducible protein 10 in a casein kinase 2-dependent manner. Mol Biol Cell. 2012;23(15):2943–2954. doi: 10.1091/mbc.E11-11-0947. [DOI] [PMC free article] [PubMed] [Google Scholar]
- 26.Ogawa S, Lozach J, Jepsen K, et al. A nuclear receptor corepressor transcriptional checkpoint controlling activator protein 1-dependent gene networks required for macrophage activation. Proc Natl Acad Sci USA. 2004;101(40):14461–14466. doi: 10.1073/pnas.0405786101. [DOI] [PMC free article] [PubMed] [Google Scholar]
- 27.Verhaak RG, Hoadley KA, Purdom E, et al. Integrated genomic analysis identifies clinically relevant subtypes of glioblastoma characterized by abnormalities in PDGFRA, IDH1, EGFR, and NF1. Cancer Cell. 2010;17(1):98–110. doi: 10.1016/j.ccr.2009.12.020. [DOI] [PMC free article] [PubMed] [Google Scholar]
Associated Data
This section collects any data citations, data availability statements, or supplementary materials included in this article.


