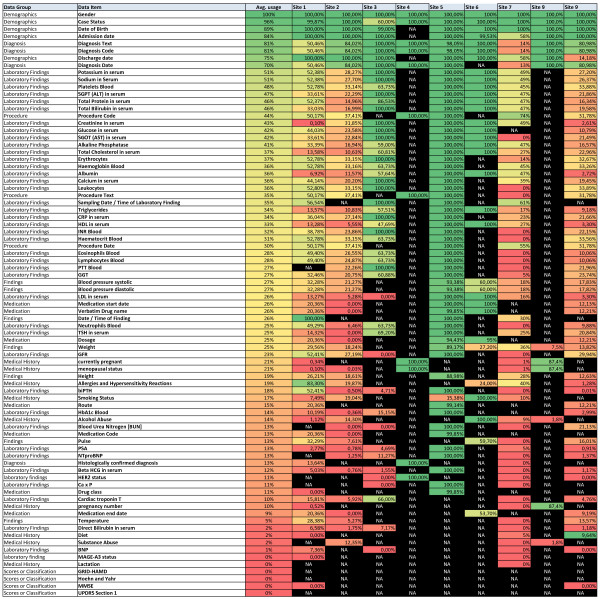
Figure 3.
Heat map of the data exports from the data inventory current version. The first two columns describe the ISO 11179 data element concept (data group/data item). The third column shows the average usage of the data element over all sites while the following columns (site 1 to site 9) display the frequency at the individual sites. The Data Inventory is ordered by the average usage sorted in descending order from most available to least. The frequency ranges from 100% (dark green) to 0% (dark red). Data elements that are not available at a site are shown as Not Available (NA) (black).

