

Abstract
Boron removal capacity of multi-walled carbon nanotubes (MWCNTs) modified with tartaric acid was investigated in this study. Modification of MWCNTs with tartaric acid was confirmed by Boehm surface chemistry method and fourier transform infra-red (FT-IR) spectroscopy. Experiments were performed to determine the adsorption isotherm and adsorption thermodynamic parameters of boron adsorption on tartaric acid modified MWCNTs (TA-MWCNTs). The effect of variables including initial pH, dosage of adsorbent, contact time and temperature was investigated. Analysis of data showed that adsorption equilibrium could be better described by Freundlich isotherm and the maximum adsorption capacities obtained at the pH of 6.0 was 1.97 mg/g. The estimated thermodynamic values of free energy (ΔG°), entropy (ΔS°) and enthalpy (ΔH°) indicated a spontaneous and an endothermic process. Furthermore, the TA-MWCNTs was magnetized for separation of boron-contaminated adsorbent from aqueous solution by applying magnetic field. The results showed that magnetic TA-MWCNTs particles were separated effectively after adsorption from contaminated water.
Keywords: Adsorption, Multi-walled carbon nanotube, Tartaric acid, Modification, Boron removal, Magnetic
Introduction
Water with less impurities and contaminants is essential to the human’s life. In general, water pollution is the introduction of physical, chemical and biological substances into the water bodies that spoils the purity of water and it will cause hazardous effects on living species that consume it. Boron (B) is one of the elements that can cause the lethal in case of more than 640 mg/kg body weight oral intake according to the world health organization (WHO) report [1,2].
In aqueous solution, boron is normally present as borate anions B(OH)-4 and boric acid B(OH)3. The dominant form of inorganic boron in acidic aqueous systems is the un-dissociated boric acid. On the other hand polyborate anionic species including B5O6(OH)4-, B3O3(OH)4, B3O3(OH)52- and B4O5(OH)42- form in high concentration solutions (>0.025 mol/l) at a neutral to alkaline pH (pH 6 to 11) [3,4].
High boron concentrations can be found in wastewater of some industries including semiconductor, ceramic, pesticides, fire retardants, borosilicate glass, nuclear power and detergent manufacturers. Many investigations has been done for boron removal from water and wastewater by different methods such as coagulation [5], coprecipitation [6], adsorption, ion exchange using cation exchangers [7], solvent extraction [8], membrane operations [9] and adsorption [5].
For treatment of boron in aqueous solution through adsorption process, different materials have been used as adsorbent such as activated carbon (AC) [10], fly ash [11], resins [12], metal oxides [13], clay materials [14], and composite magnetic particles [15].
Multi-walled carbon nanotubes (MWCNTs) are known as an effective adsorbent for removing contaminants such as various metals and heavy metals [16], dyes [17] and organic materials [18] from water and wastewater. The most important characteristics of MWCNTs are large specific surface area, well developed mesoporous and hollow structure and light mass density which make it an efficient adsorbent of pollutant molecules. Furthermore, MWCNTs have the advantages of easy removal and regeneration after contaminant adsorption [19]. Although, many researches have studied the capability of MWCNTs as an adsorbent of aqueous solution pollutants, however, adsorption capacity of boron onto MWCNTs has not been investigated so far.
The oxygen content of MWCNTs influences the maximum adsorption capacity. The oxygen functional groups such as –OH, –C = O, and –COOH can be generated on the surface of MWCNTs through covalent and noncovalent modification. MWCNTs were modified under the oxidizing condition with different chemicals such as HNO3, H2O2, KMnO4, NaClO, KOH, NaOH and citric acid [20,21]. Recent investigations showed that by using organic weak acids such as citric acid (C6H8O7), the functionalities can be produced without the negative signs depicted by the use of inorganic strong acids beside eliminating the refluxing step during the functionalization [22]. Due to the mild and safe reaction which organic materials can have and also the abovementioned advantages of these materials comparing to inorganic acids, the focus of this investigation is on MWCNTs modification using organic acids like tartaric acid (C4H6O6).
The influence of some parameters such as initial solution pH, dosage of adsorbent, initial boron concentration, contact time and temperature on boron adsorption behavior of tartaric acid modified MWCNTs (TA-MWCNTs) was studied in this work. TA-MWCNTs were modified with iron oxide particles for further magnetic separation of contaminated adsorbent.
Materials and methods
Chemicals
Boron stock solution was prepared by adding 5.71 g of boric acid B(OH)3 (Systerm Co.) into 1000 ml double distilled water. Azomethine-H monosodium salt hydrate >95% was purchased from Sigma Aldrich and L(+) ascorbic acid, ammonium acetate, glacial acetic acid, acid disodium salt-dihydrate (EDTA), mercaptoacetic acid 98% were purchased from Systerm Co. MWCNTs (diameter of 20–40 nm and minimum purity of 90%) and L(+)-tartaric acid >99.7% (C4H6O6) were purchased from Hangzhou Dayang Chem Co. and Sigma Aldrich Co. respectively. Ammonium iron (II) sulfate hexahydrate (NH4)2Fe(SO4)2 · 6H2O and hydrazine hydrate (N2H4) were received from Systerm Co. and R&M Chemicals. All the reagents used in this study were analytical grade.
Modification of MWCNTs with tartaric acid
To find the optimum amount of the tartaric acid for modification of MWCNTs and to obtain the highest functional groups loading, 10 g of MWCNTs was mixed with 50 ml of four different concentrations of aqueous solution of tartaric acid (0.5, 1, 1.5 and 2 M). The mixtures were subjected to ultrasonic bath for 15 min mixing and then left to be dried and forming a paste followed by keeping the samples in the furnace for 30 min at 300°C. It is worth to mention that because of the decomposition of the excess of tartaric acid after increasing the temperature up to 300°C, further filtration step and washing of tartaric acid modified MWCNTs was not required [21].
The LECO TruSpec CHNS-O elemental analyzer was used for preliminary comparison of the oxygen content and carbon content of MWCNTs and TA-MWCNTs samples. By comparing the oxygen contents, a preliminary evaluation of optimum required amount of tartaric acid was possible and the sample with the highest oxygen content was selected for further surface chemistry analysis and proceeding the entire work. The Boehm titration technique [23] and solid addition technique [24] were employed to study the surface chemistry and point of zero charge (pHpzc) for MWCNTs and TA-MWCNTs.
To investigate the formation of carboxylic and carbonyl functional groups on TA-MWCNTs, the FT-IR spectra were obtained for MWCNTs and TA-MWCNTs in KBr pellet form with AEM Thermo Nicolet FT-IR collected at a spectrum resolution of 4 cm-1 with 32 co-added scans over the range from 4,000 to 400 cm-1.
To evaluate the specific surface area of MWCNTs before and after modification, Brunauer Emmett Teller (BET) analysis was used. After subjecting the samples with nitrogen gas for 9 hours of operation at 290°C of outgas temperature, the Quantachrome AS1Win™ surface area analyzer was used for measuring the surface area.
Transmission electron microscopy (TEM, Philips HMG 400) was also used to characterize the microstructure of MWCNTs before and after modification.
Preparation of magnetic TA-MWCNTs
To modify the TA-MWCNTs surface with iron oxide particles [25], 6 g of ammonium iron (II) sulphate hexahydrate was dissolved in 200 ml of distilled water and hydrazine hydrate (volume ratio of 3:1). Then, 2.5 g of TA-MWCNTs was added into the solution. The pH of the mixture was adjusted to 11–13 and then the mixture was sonicated and stirred vigorously for about 15 min. After sonication, the mixture was refluxed for 2 hours. Finally, magnetic TA-MWCNTs was washed several times with distilled water using a filtration system until the pH of the solution became neutral. Then the magnetic TA-MWCNTs was dried under vacuum at 65°C for 24 hours.
The prepared magnetized sample was characterized using X-ray diffraction technique (XRD) using a Philips PW 3710 type diffractometer and FT-IR (AEM Thermo Nicolet). Morphology and chemical composition of the samples were studied using Energy-dispersive X-ray spectroscopy (EDX), and the scanning electron microscopy (SEM) using SEM-EDX Hitachi S-3400 N.
Adsorption experiments
The effect of pH on boron adsorption was investigated using boron stock solution (20 mg/l) with pHs varied from 2–11. A specific amount of 0.32 g/l of TA-MWCNTs was added to boron stock solutions. The samples were kept in the shaker for 3 days in the room temperature (25°C) to reach equilibrium. The boron uptake on TA-MWCNTs was measured using UV–vis spectrophotometer (Double beam, Halo DB 20S) through Azomethine H method [10,26].
To study the effect of adsorbent quantity on boron adsorption, 6 samples of boron stock solution (20 mg/l) with pH of 6 were prepared. The TA-MWCNTs in various concentrations (0.16 to 0.56 g/l) were added to boron stock solutions and kept at shaker at 25°C for 3 days. The boron adsorption of mixtures was then measured using UV/Vis spectrophotometer.
The contact time and initial boron concentration dependent experiment was carried out with different stock solutions of initial boron concentrations varied from 2 to 40 mg/L. The solution was mixed with 0.1 g TA-MWCNTs and kept in a shaker for 24 h at room temperature. The boron adsorption of samples was measured in different time intervals using UV/Vis spectrophotometer.
Thermodynamic of the study was investigated in three different temperatures of 303, 313 and 323 K. All effective parameters of experiment which were obtained from optimal conditions of previous parts of the study were used to adjust the condition in temperature dependent experiment.
Adsorption behavior of magnetic-MWCNTs was investigated using the same method under the optimal adsorption conditions evaluated in the experiments.
The amount adsorbed boron per unit mass of adsorbent at equilibrium was given as follows [27]:
| (1) |
Where qe (mg/g) was equilibrium uptake, C0 and Ce (mg/l) denoted the initial and equilibrium concentrations of boron in aqueous solution, V was the total volume of the solution in liters and W was the mass of the adsorbent in grams.
Results and discussion
Characterization of MWCNTs and TA-MWCNTs
To find out the optimum concentration of tartaric acid, the oxygen content of TA-MWCNTs samples obtained from different amount of tartaric acid which was measured by CHNS-O analysis is shown in Table 1. By increasing the concentration of tartaric acid from 0.50 to 1.00 M an increase in oxygen content happened. A further increase of concentration of Tartaric acid to 2 M caused negligible changes in the oxygen content. It was concluded that using 1 M solution of tartaric acid resulted in the highest amount of oxygen containing functional groups. Therefore, TA-MWCNTs sample modified with 1 molar solution was used to proceed the entire work.
Table 1.
Oxygen percentage for TA-MWCNTs modified with different concentrations of tartaric acid obtained from CHNS-O analysis
| Sample | Tartaric acid concentration (M) | Oxygen content (wt.%) |
|---|---|---|
| TA-MWCNTs |
0.50 |
34.791 |
| 1.00 |
35.805 |
|
| 1.50 |
34.703 |
|
| 2.00 |
34.805 |
|
| MWCNTs | - | 0.021 |
To obtain a precise evaluation of functionalities on the TA-MWCNTs, results of boehm method is shown in Table 2. By comparing the values for MWCNTs and TA-MWCNTs it can be concluded that after modification, oxygen functionalities such as carboxyl groups and phenolic groups were generated on the surface of TA-MWCNTs whilst MWCNTs had negligible carboxyl and phenolic groups. Also, the higher amount of oxygen containing functional groups resulted in the dominance of acidic character in TA-MWCNTs comparing to MWCNTs [23]. Forming oxygen contained functional groups was also reported in previous works by modification of MWCNTs with citric acid [22,28]. Although, the chemistry of reaction between nanotubes and citric acid or tartaric acid at high temperatures is still unknown, it could be mentioned that functional groups formed on the surface of TA-MWCNTs can serve as attachment points in the construction of complexes between B(OH)4/B(OH)4- and TA-MWCNTs surface [29,30].
Table 2.
Surface chemistry of MWCNTs and TA-MWCNTs derived from boehm titration
| Sample name | Functional group | Value (mmol/g) |
|---|---|---|
| |
Carboxyl groups |
0.001 |
| |
Phenolic |
0.003 |
| MWCNTs |
Acidity |
0.033 |
| |
Basicity |
0.008 |
| |
Carboxyl groups |
0.398 |
| TA-MWCNTs |
Phenolic |
0.637 |
| |
Acidity |
1.036 |
| Basicity | 0.016 |
The forming of functionalities was also proved by the comparison of the FT-IR spectra for MWCNTs and TA-MWCNTs (Figure 1). The FT-IR graphs for TA-MWCNTs and MWCNTs showed a broad peak at ~3425 cm-1 which is ascribed to the O–H stretching of the hydroxyl group. Also, the absorption peak at 1633(cm-1) was related to the C = C stretching mode of the TA-MWCNTs and MWCNTs [31]. The presence of carboxylic groups after the modification step was confirmed with a C = O band stretching that appeared at ~1730 cm-1 (−COOH). As it can be perceived from the graph, the C = O band was only appeared after the modification of MWCNTs with tartaric acid [32].
Figure 1.
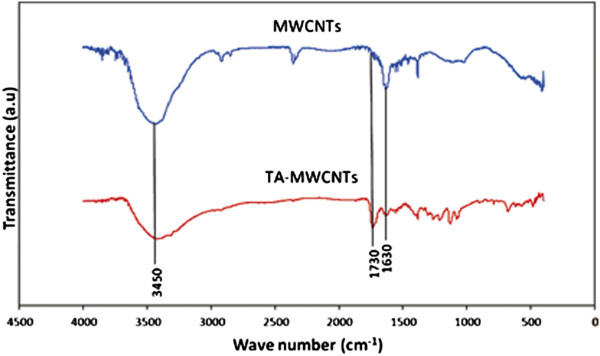
The FT-IR graph for MWCNTs and TA-MWCNTs.
Table 3 presents some characteristics of MWCNTs before and after modification. The BET surface area for unmodified-MWCNTs was 99.93 m2/g. After modification the BET surface area of MWCNTs modified with tartaric acid decreased slightly to 99.61 m2/g. The decrease in BET surface area may be attributed to the partial blockage of pores by residual ashes of tartaric acid.
Table 3.
Characteristics of MWCNTs and TA-MWCNTs
| Characteristics | Values for MWCNTs |
Values for |
|---|---|---|
| TA-MWCNTs | ||
| BET |
99.93 m2/cm |
99.61 m2/cm |
| Particle size |
Diameter: 30–50 nm |
Diameter: 30–50 nm |
| pHpzc |
7.40 |
6.20 |
| Bulk density |
0.26 g/cm3 |
0.28 g/cm3 |
| Oxygen content |
0.021% |
35.805% |
| Carbon content | 95.21% | 98.60% |
Point of zero charge (pHpzc) for TA-MWCNTs and MWCNTs was calculated through the pHi and pHf values derived from solid addition technique. The point at which the ∆pH (pHi-pHf) equals zero would be considered as pHpzc. From Figure 2, the point of zero charge values for MWCNTs and TA-MWCNTs were determined to be around 7.40 and 6.20, respectively. The most obvious effect of forming oxygen functionalities (carboxylic and phenolic groups) is increase in surface acidity and consequently decrease in pHpzc. This result is in good agreement with the surface chemistry analysis.
Figure 2.
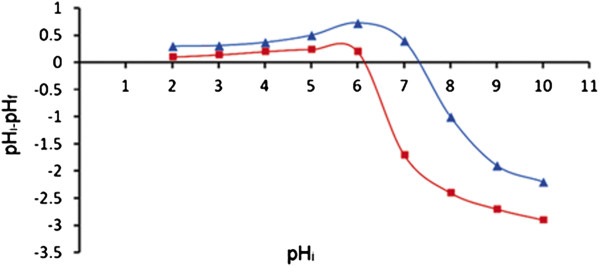
pH i versus ∆pH for MWCNTs and TA-MWCNTs.
TEM images of MWCNTs and TA-MWCNTs are shown in Figure 3a,b. Figure 3(a) shows the appearance of some black spots on MWCNTs which could be related to impurities. After modification of MWCNTs (Figure 3b) more black spots were formed on MWCNTs which is related to the residues of tartaric acid after decomposition at 300°C. Also, from the images the diameter of MWCNTs was estimated roughly in the range of 30–50 nanometers.
Figure 3.
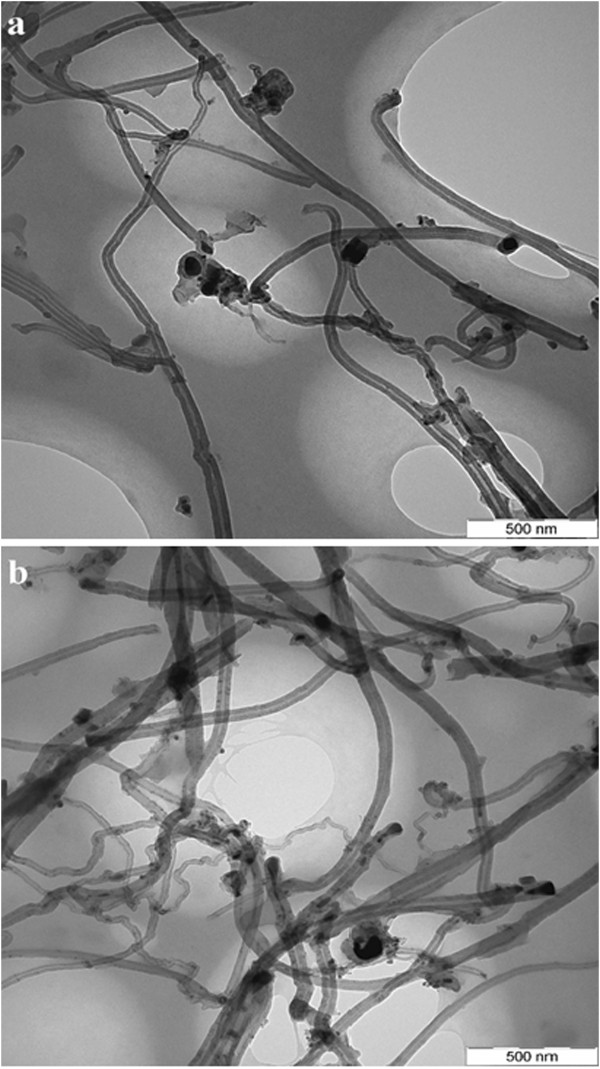
TEM image of a) MWCNT, b) TA-MWCNT.
Adsorption studies
Effect of initial solution pH
Figure 4 shows the effect of initial solution pH on adsorption capacity of TA-MWCNTs and MWCNTs. MWCNTs showed negligible affinity (qe = 0.01 mg/g) for all existing forms of boron in low and high pH values. On the other hand, by increasing the pH from 2 to 4, boron adsorption capacity of TA-MWCNTs was increased slightly from 0.42 mg/g to around 0.57 mg/g. At this range of pH (<pHpzc of TA-MWCNTs), boron existed in the form of B(OH)3 and also the surface charge of TA-MWCNTs was positive. The slight increase in the affinity could be explained in terms of increasing the functional group which works as the sites of forming complex with boric acid. By increasing the pH from 5 to 6, the boron adsorption capacity reached to the maximum value of 1.53 mg/g. At pH of 6, the surface of TA-MWCNTs was positive, however besides existing the boron in form of B(OH)3, the B(OH)4- species with negative charges were formed and occurring electrostatic attraction made the highest affinity for boron. By increasing the pH from 6 to 11 (>pHpzc of TA-MWCNTs) the gradual decrease in boron adsorption capacity could be assigned to the electrostatic repulsion between negative surface charge of TA-MWCNTs and negative charge of B(OH)4- formed in high pHs.
Figure 4.
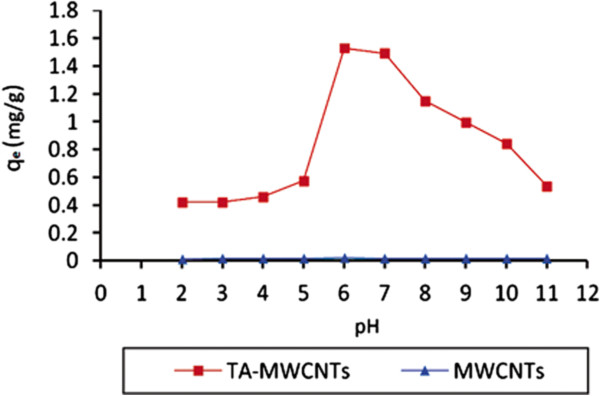
The effect of pH on boron adsorption on TA-MWCNTs and MWCNTs (dosage adsorbent: 0.32 g/l, boron concentration: 20 mg/l, temperature: 25°C).
Effect of initial dosage of adsorbent
Figure 5 shows the effect of initial dosage of TA-MWCNTs on the adsorption capacity of sorbent. For TA-MWCNTs by increasing the adsorbent dosage, boron adsorption capacity decreased from 1.67 to 0.8 mg/g whereas the equilibrium point was happened at dosage adsorbent of around 0.4 g/l. The diminishing of adsorption capacity by increasing the sorbent dosage could be due to the fixed quantity of active adsorption sites of sorbent. These sites eventually became saturated with boron and therefore were unable to accommodate any more ions at higher concentrations. As was expected, by increasing the dosage of MWCNTs a very negligible changes in boron adsorption capacity (qe = 0.01 mg/g) was observed.
Figure 5.
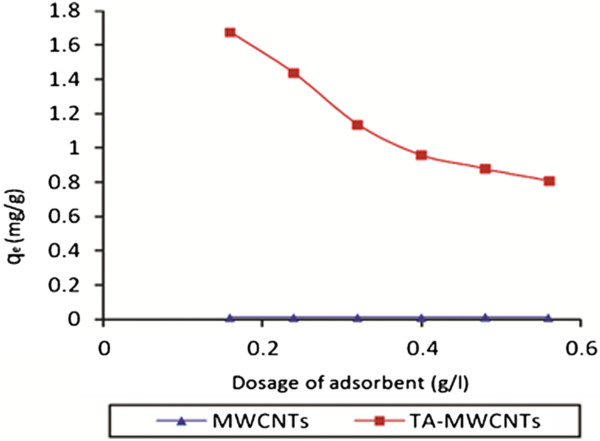
Effect of sorbent dosage on boron removal by MWCNTs and TA-MWCNTs (pH: 6, boron concentration: 20 mg/l, temperature: 25°C).
Effect of contact time and initial boron concentration
The effect of contact time was investigated for unmodified MWCNTs and TA-MWCNTs by using synthetic solutions with initial concentration varied from 2 to 40 mg/l. As shown in Figure 6, the initial uptake of boron was rapid which could be attributed to the unsaturated surface of the TA-MWCNT. After that, the adsorption gradually slowed down by saturation of the surface and then became constant at around 60 minutes. The equilibrium adsorption capacity (qe) increased with increasing initial boron concentration.
Figure 6.
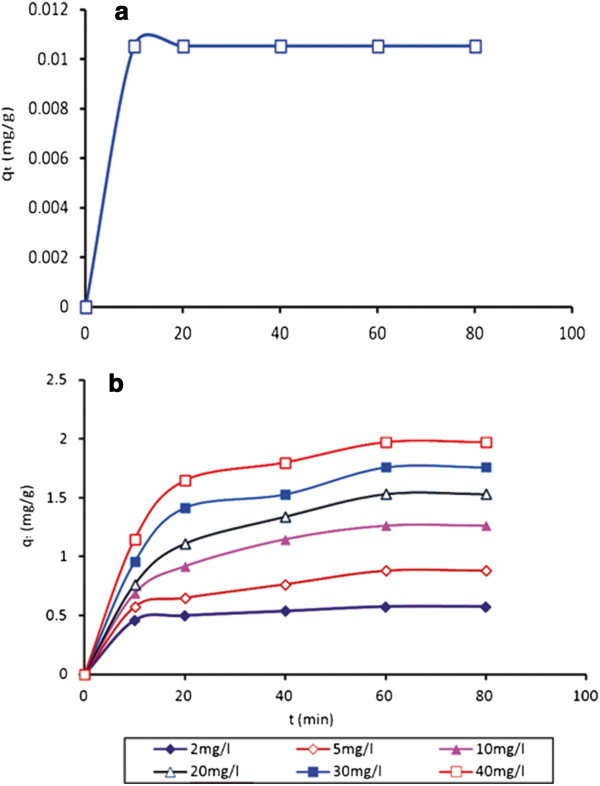
Effect of contact time and initial boron concentration on boron removal using MWCNTs (a) and TA-MWCNTs (b) (Temperature: 25°C, pH: 6, dosage adsorbent: 0.4 g/l).
For MWCNTs (Figure 6a), a constant boron adsorption capacity was recorded with increasing contact time of adsorbent and initial boron concentration. The small numbers of vacant sites on the surface of MWCNTs were occupied at the very initial stages and sorption capacity became constant in a very short duration.
For TA-MWCNTs (Figure 6b), the equilibrium point for all concentrations was around 60 minutes. The maximum adsorption happened at 40 mg/l of boron concentration and the amount was 1.97 mg/g.
From the results, it can be concluded that the optimum conditions of boron removal was achieved by using 0.4 g/l of TA-MWCNTs in temperature of 25°C, at pH of 6 and with 40 mg/l initial boron concentration after 60 min of contact time.
Adsorption isotherm
The adsorption data obtained for TA-MWCNTs as a function of initial boron concentrations was used for finding the most appropriate linear forms of the Freundlich and Langmuir adsorption isotherms. The linear form of the Langmuir equation [33] is given as:
| (2) |
Where kl (L/mg) and al (mg/L) are two Langmuir isotherm constants which are obtained from the intercept and slope of the linear plot of equation 2.
Figure 7 shows the plot of Ce/qe against Ce for TA-MWCNTs.
Figure 7.
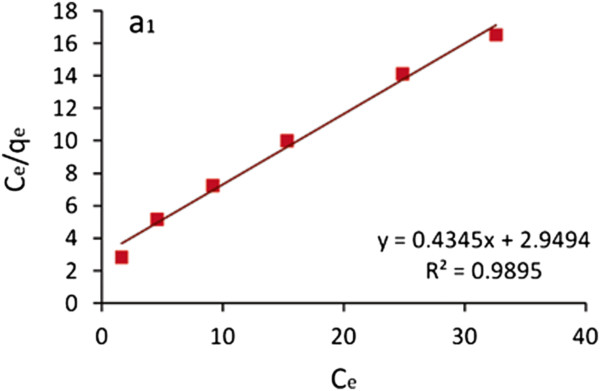
Plot of C e /q e against C e for TA-MWCNTs.
The data was also plotted using the linear form of the Freundlich equation [34]:
| (3) |
Where Kf is the Freundlich constant or capacity factor (mg/g) and 1/n is the Freundlich exponent.
Figure 8 shows the plot of ln (qe) against ln (Ce) for TA-MWCNTs. Figure 8 indicates clearly that TA-MWCNTs obeyed the Freundlich isotherm. The isotherm parameters are also presented in Table 4.
Figure 8.
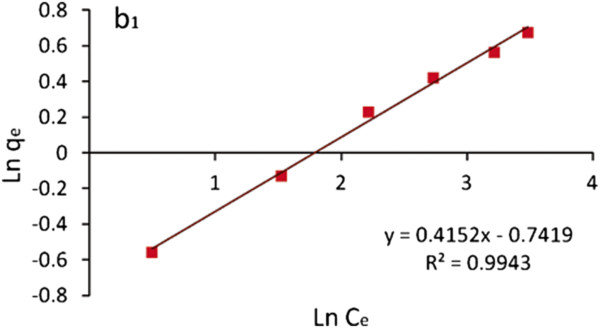
Plot of ln (qe) against ln (Ce) for TA-MWCNTs.
Table 4.
Isotherm parameters for the adsorption of boron on TA-MWCNT
|
Freundlich constants |
Langmuir constants |
|||||
|---|---|---|---|---|---|---|
| Kf (mg/g) | n (mg/L) | R2 | KL (L/g) | aL (mg/L) | R2 | |
| Tartaric acid m-MWCNT | 2.099 | 2.408 | 0.994 | 0.339 | 0.147 | 0.989 |
From the results presented in Figures 7 and 8 and Table 4, it can be concluded that the value of exponent n is in the range of desirable adsorption (1 < n < 10). The higher values of linear correlation coefficients (R2) for boron uptake (0.9943) revealed that the Freundlich model can be used to describe the boron adsorption behavior comparing to the Langmuir model.
Figure 9 compares the experimental results and isotherm models. It is concluded that the Freundlich isotherm fitted better to the experimental data comparing with the Langmuir model.
Figure 9.
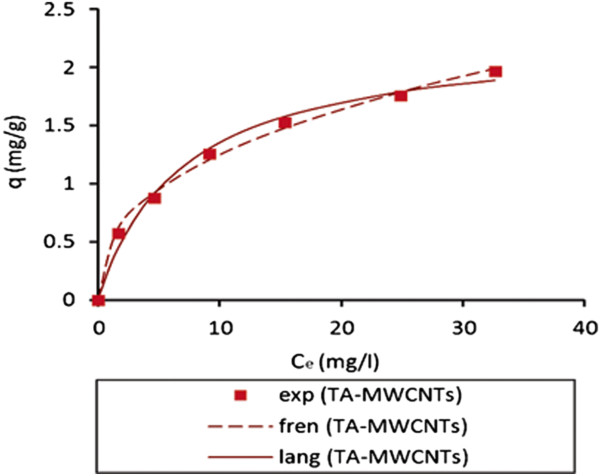
Comparison between experimental data and isothermal models.
Adsorption thermodynamics
To evaluate the effect of temperature, thermodynamic parameters consisting of standard free energy change (∆Gº), standard enthalpy change (∆Hº) and standard entropy change (∆Sº) must be taken into consideration. The equilibrium constant (Kc) was calculated by using the following equation [33]:
| (4) |
Where CAe is the amount of boron adsorbed (mmol/g), and Ce is the equilibrium concentration of boron in the solution (mmol/l).
Gibbs free energy changes (∆Gº) was calculated using the following equation:
| (5) |
Where absolute temperature is shown by T (K) and R is universal gas constant (8.314 J/mol-K). The values of enthalpy change (∆Hº) and entropy change (∆Sº) were calculated by using the Van’t Hoff equation as follows:
| (6) |
A plot of ln Kc against 1/T rendered a straight line, as shown in Figure 10. The slope of the plot is equal to -ΔH° /R and its intercept value is equal to ∆Sº /R. These thermodynamic parameters are presented in Table 5.
Figure 10.
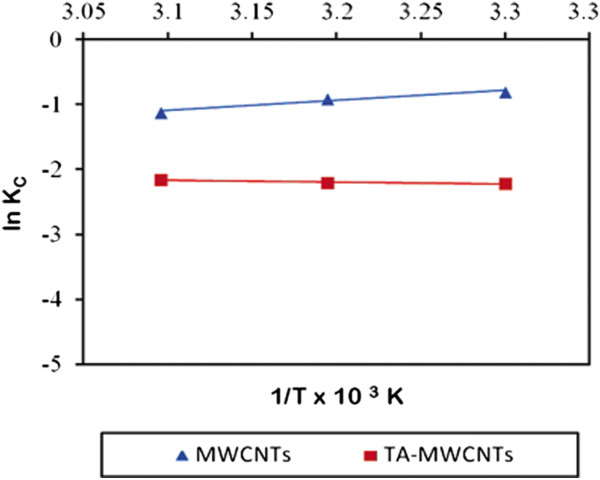
Plot of ln (K C ) versus (T −1 ) for estimation of thermodynamic parameters for adsorption of boron on MWCNTs and TA-MWCNTs.
Table 5.
Thermodynamics parameters for boron adsorption on MWCNTs and TA-MWCNTs
| Temperature (k) | ln kc | ∆G° (kJ/mol) | ∆H° (kJ/mol) | ∆S° (J/molK) |
|---|---|---|---|---|
| MWCNTs | ||||
| 303 |
−0.802 |
−2.022 |
12.719 |
48 |
| 313 |
−0.905 |
−2.356 |
||
| 323 |
−1.116 |
−2.998 |
||
| TA-MWCNTs |
|
|||
| 303 |
−2.279 |
−5.574 |
29.47 |
78.5 |
| 313 |
−1.828 |
−4.758 |
||
| 323 | −1.556 | −4.181 | ||
As presented in Table 5, the ∆G° values are negative and the ΔH° values are positive for TA-MWCNTs and MWCNTs. These results demonstrated that the adsorption of boron on MWCNTs and TA-MWCNTs was spontaneous and was an endothermic process. The decrease of negative values of ΔG° with the increase of temperature for MWCNTs indicated more efficient adsorption at higher temperature. On the other hand, for TA-MWCNTs since the negative values of ΔG° increased with increase in the temperature, the spontaneous adsorption process should be less efficient at higher temperatures.
Characterization of magnetic TA-MWCNTs
Figure 11 shows the FT-IR spectra for TA-MWCNTs before and after magnetizing. The peaks at 421 cm-1 and 588 cm-1 appeared after magnetizing the TA-MWCNTs. These peaks represented the existence of iron oxide particles on the surface of TA-MWCNTs [35]. Also, peaks at ~1729 and ~1627 indicated the existence of carboxylic groups on the surface of, TA-MWCNTs after magnetizing process.
Figure 11.
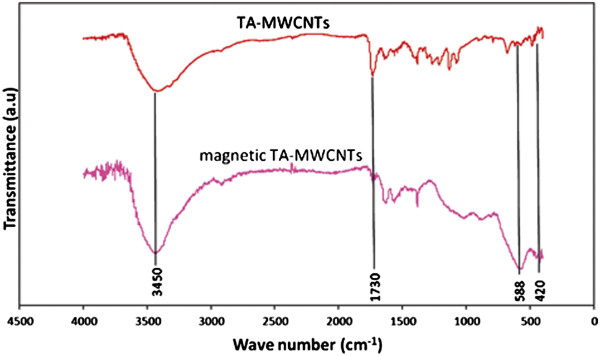
The FT-IR graph for TA-MWCNTs and magnetic TA-MWCNTs.
Figure 12 compares the XRD patterns for MWCNTs and TA-MWCNTs. Prevalently, four types of iron oxides forms under reaction conditions including magnetite (Fe3O4), maghemite (Fe2O3), hematite (γ-Fe2O3) and goethite (FeO(OH)), and among them, only magnetite and maghemite are magnetic. The XRD pattern of the magnetic TA-MWCNTs displayed three main diffraction peaks. The peaks at 2Ɵ = 35.4° and 43° (Figure 12b) are assigned to magnetite or maghemite. Other peaks are also observed at 2Ɵ = 30° and 62.7° for the magnetic TA-MWCNTs, which refer to the presence of hematite. The results had a good agreement with other reports and confirmed that iron oxide particles were formed on the surface of TA-MWCNTs [25,36]. It was also perceived that the typical peak (2Ɵ = 25°) corresponding to the MWCNTs (Figure 12a) also existed in the XRD pattern of the magnetic TA-MWCNTs (Figure 12b).
Figure 12.
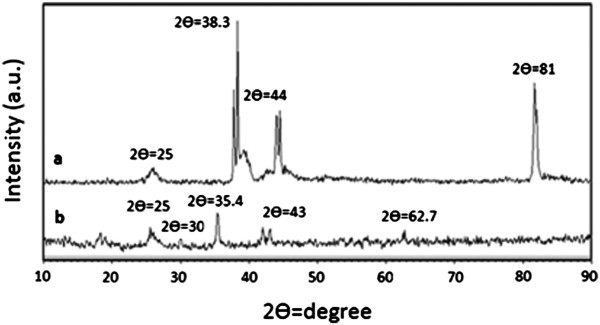
XRD patterns for (a) TA-MWCNTs and (b) magnetic TA-MWCNTs.
Figure 13 shows the EDX results for magnetic TA-MWCNTs. The existence of iron and oxygen elements can be perceived by intense peaks on the surface of magnetic TA-MWCNTs.
Figure 13.
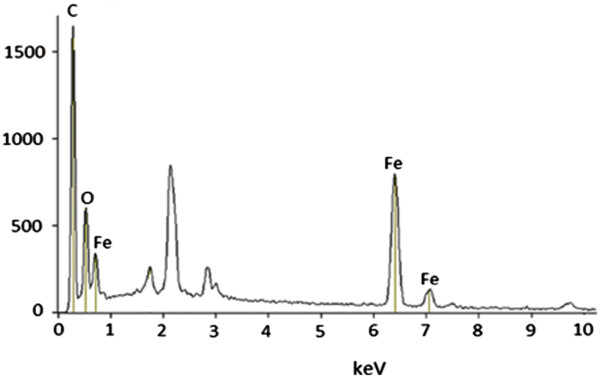
EDX spectrum for magnetic TA-MWCNTs.
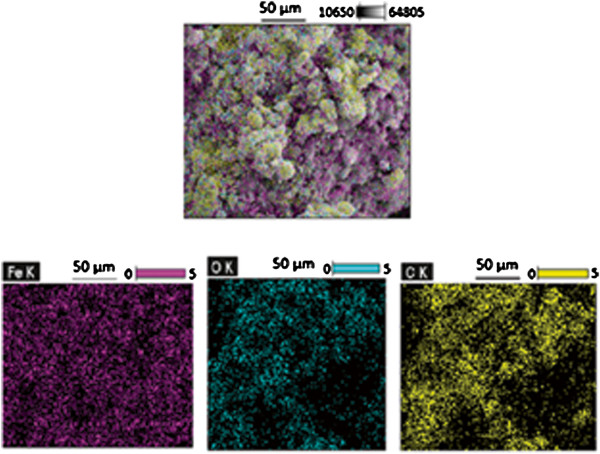
Figure 14 also shows the distribution of C, O, and Fe elements on the surface of magnetic TA-MWCNTs and confirmed the forming of magnetic iron oxide particles on TA-MWCNTs.
Figure 14.
SEM-EDX mapping of magnetic TA-MWCNTs surface.
The SEM technique was used to investigate the morphology of MWCNTs before and after magnetizing. By comparing the images in Figure 15, it can be seen that an entangled network of TA-MWCNTs with clusters of iron oxides attached to them formed after magnetizing process. This indicated that iron oxides were successfully bounded on the surfaces of TA-MWCNTs to form magnetic TA-MWCNTs.
Figure 15.
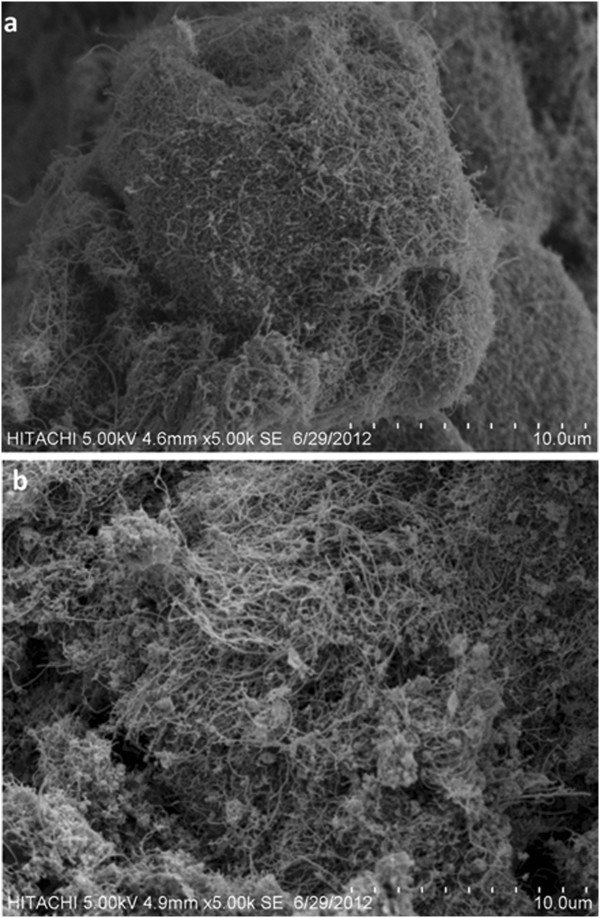
SEM images of (a) TA-MWCNTs and (b) magnetic TA-MWCNTs.
Adsorption study of magnetic TA-MWCNTs
The boron adsorption behavior of TA-MWCNTs after magnetizing was studied under optimal conditions (initial solution pH of 6, temperature of 25°C, contact time of 60 min, boron initial concentration of 40 mg/l, initial dosage of adsorbent of 0.40 g/l). Figure 16 compares the boron adsorption capacity for MWCNTs, TA-MWCNTs and magnetic TA-MWCNTs.
Figure 16.
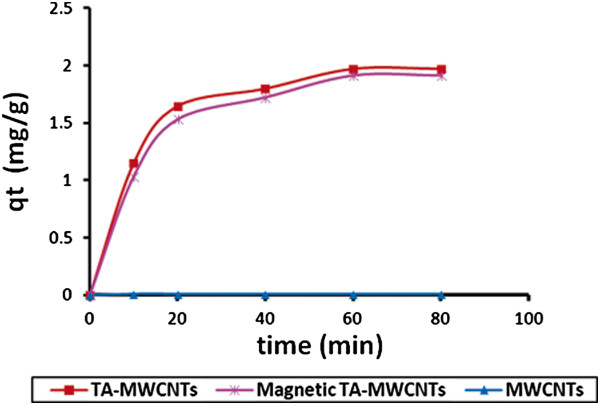
Boron adsorption capacity versus time for TA-MWCNTs, magnetic TA-MWCNTs and MWCNT at pH of 6, temperature of 25°C, contact time of 60 min, boron initial concentration of 40 mg/l and adsorbent dosage of 0.4 g/l.
From the results after 60 min at equilibrium time boron adsorption capacity of magnetic TA-MWCNTs was measured to be 1.91 mg/g. However, by comparing the qe values for TA-MWCNTs (1.97 mg/g) and magnetic MWCNTs it is perceived that a negligible decrease in boron adsorption capacity of TA-MWCNTs occurred after magnetizing. The decrease in boron adsorption capacity could be related to the occlusion of mesopores of TA-MWCNTs by iron oxide particles which led to less bonding of boron with oxygen functionalities anchored within the mesopores.
Separation of contaminated magnetic TA-MWCNTs from aqueous solution
Removing of the magnetic TA-MWCNTs after adsorption of boron from aqueous solution was carried out by using a simple magnet. Figure 17 shows the appearance of magnetic TA-MWCNTs in aqueous solution before and after contact with the magnet. As a quantitative analysis, the amount of the remained MWCNTs after contact with magnetic field was measured and the results has shown that only 0.03% of the adsorbent was remained in the solution. For removing the adsorbed boron form TA-MWCNTs, desorption of boron by altering the pH in solution has been suggested by Yu et al. [37]. This will be explored in our future studies.
Figure 17.
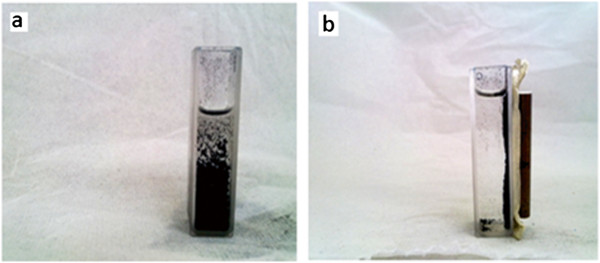
Contaminated magnetic TA-MWCNTs (a) before contact with magnet and (b) after contact with magnet.
Conclusion
The MWCNTs was impregnated with tartaric acid to improve the boron adsorption capacity. The characterization techniques proved forming oxygen functionalities such as carboxylic and phenolic groups on the surface of MWCNTs after modification. Investigation of effective factors on boron capacity of TA-MWCNTs showed that initial solution pH, initial boron concentration, initial adsorbent dosage and temperature had significant effect on boron adsorption. At pH of 6, the maximum adsorption capacity of TA-MWCNTs measured to be 1.97 mg/g under the optimum condition. Also, thermodynamic study showed endothermic, entropy favorable and spontaneous adsorption behavior of boron by TA-MWCNTs. In addition Freundlich model was more suitable to simulate the boron adsorption isotherms than Langmuir model. The TA-MWCNTs was magnetized for separation after adsorption of boron. Magnetic separation of boron contaminated TA-MWCNTs was successfully carried out for further removal from aqueous solution. In conclusion, the modification of MWCNTs with tartaric acid is a successful method for enhancing the adsorption properties of MWCNTs in the removal of boron from aqueous solutions. However, the desorption studies is now of interest and is recommended to be investigated in future works.
Competing interests
The authors declare that they have no competing interests.
Authors’ contributions
NZ participated in design of the study, performing the experimental parts, analyzing the data, preparing the report and manuscript. FM participated in design of the study and was involved in preparing the manuscript. LCA participated in design of the study. TSYC participated in design of the study and analyzing the data. All authors read and approved the final manuscript.
Contributor Information
Nima Zohdi, Email: nimazohdi@yahoo.com.
Fariba Mahdavi, Email: mahdavifariba@yahoo.com.
Luqman Chuah Abdullah, Email: chuah@eng.upm.edu.my.
Thomas SY Choong, Email: csthomas@upm.edu.my.
Acknowledgement
The authors would like to thank Universiti Putra Malaysia for financial support of this work (via: vot: 9416900).
References
- Mubarak NM, Daniel S, Khalid M, Tana J. Comparative study of functionalize and non-functionalized carbon nanotube for removal of copper from polluted water. Inter J Chem Environ Eng. 2012;3:314–317. [Google Scholar]
- World health organization. Annual report. Geneva, Switzerland; 2009. [Google Scholar]
- Choi W, Chen KY. Evaluation of boron removal by adsorption on solids. Environ Sci Technol. 1979;13:189–196. doi: 10.1021/es60150a012. [DOI] [Google Scholar]
- Öztürk N, Kavak D. Adsorption of boron from aqueous solutions using fly ash: batch and column studies. J Hazard Mater. 2005;127:81–88. doi: 10.1016/j.jhazmat.2005.06.026. [DOI] [PubMed] [Google Scholar]
- Chong MF, Chieng HJ. A review on boron adsorption using various adsorbents. Global J Environ Sci Technol. 2012;2:11–23. [Google Scholar]
- Turek M, Dydo P, Trojanowska J, Campen A. Adsorption/co-precipitation-reverse osmosis system for boron removal. Desalination. 2007;205:192–199. doi: 10.1016/j.desal.2006.02.056. [DOI] [Google Scholar]
- Popat KM, Anand PS, Dasare BD. Synthesis and characterization of boron-selective porous condensate cation exchanger. Sorbents. 1988;8:143–151. [Google Scholar]
- Matsumoto M, Kondo K, Hirata M, Kokubu S, Hano T, Takada T. Recovery of boric acid from wastewater by solvent extraction. Sep Sci Technol. 1997;32:983–991. doi: 10.1080/01496399708000940. [DOI] [Google Scholar]
- Redondo J. Boron removal from seawater using FILMTEC TM high rejection SWRO membranes. Desalination. 2003;156:229–238. doi: 10.1016/S0011-9164(03)00345-X. [DOI] [Google Scholar]
- Kluczka J, Ciba J, Trojanowska J, Zolotajkin M, Turek M, Dydo P. Removal of boron dissolved in water. Environ Prog. 2007;26:71–77. doi: 10.1002/ep.10180. [DOI] [PubMed] [Google Scholar]
- Chong MF, Lee KP, Chieng HJ. Syazwani binti ramli I I: removal of boron from ceramic industry wastewater by adsorption-flocculation mechanism using palm oil mill boiler (POMB) bottom ash and polymer. Water Res. 2009;43:3326–3334. doi: 10.1016/j.watres.2009.04.044. [DOI] [PubMed] [Google Scholar]
- Ersan HY, Pinarbasi S. Boron removal by glucamine-functionalized hydrogel beads in batch fashion. J Appl Polym Sci. 2011;121:1610–1615. doi: 10.1002/app.33723. [DOI] [Google Scholar]
- Prodromou KP. Boron adsorption by aluminium hydroxides in the presence of atrazine. Neues Jahrb Geol P M. 2003;2:49–54. [Google Scholar]
- Draoui K, Denoyel R, Chgoura M, Rouquerol J. Adsorption of paraquat on minerals: a thermodynamic study. J Therm Anal Calorim. 1999;58:59–606. [Google Scholar]
- Liu H, Qing B, Ye X, Li Q, Lee K, Wu Z. Boron adsorption by composite magnetic particles. Chem Eng J. 2009;151:235–240. doi: 10.1016/j.cej.2009.03.001. [DOI] [Google Scholar]
- Yang S, Li J, Shao D, Hu J, Wang X. Adsorption of Ni(II) on oxidized multi-walled carbon nanotubes: effect of contact time, pH, foreign ions and PAA. J Hazard Mater. 2009;166:109–116. doi: 10.1016/j.jhazmat.2008.11.003. [DOI] [PubMed] [Google Scholar]
- Machado FM, Bergmann CP, Lima EC, Royer B, Souza FE, Jauris IM, Fagan SB. Adsorption of Reactive Blue 4 dye from water solutions by carbon nanotubes: experiment and theory. PCCP Phys Chem Ch Ph. 2012;14:11139–11153. doi: 10.1039/c2cp41475a. [DOI] [PubMed] [Google Scholar]
- Mehrizad A, Aghaie M, Gharbani P, Dastmalchi S, Monajjemi M, Zare K. Comparison of 4-chloro-2-nitrophenol adsorption on single-walled and multi-walled carbon nanotubes. Iranian J Environ Health Sci Eng. 2012;9:5–11. doi: 10.1186/1735-2746-9-5. [DOI] [PMC free article] [PubMed] [Google Scholar]
- Fu F, Wang Q. Removal of heavy metal ions from wastewaters: a review. Journal of Environ Manag. 2011;92:407–418. doi: 10.1016/j.jenvman.2010.11.011. [DOI] [PubMed] [Google Scholar]
- Hu J, Chen C, Zhu X, Wang X. Removal of chromium from aqueous solution by using oxidized multiwalled carbon nanotubes. J Hazard Mater. 2009;162:1542–1550. doi: 10.1016/j.jhazmat.2008.06.058. [DOI] [PubMed] [Google Scholar]
- Sun Y, Yang S, Sheng G, Guo Z, Wang X. The removal of U(VI) from aqueous solution by oxidized multiwalled carbon nanotubes. J Environ Radio. 2012;105:40–47. doi: 10.1016/j.jenvrad.2011.10.009. [DOI] [PubMed] [Google Scholar]
- Poh CK, Lim SH, Pan H, Lin J, Lee JY. Citric acid functionalized carbon materials for fuel cell applications. J Power Sourc. 2008;176:70–75. doi: 10.1016/j.jpowsour.2007.10.049. [DOI] [Google Scholar]
- Boehm H. Surface oxides on carbon and their analysis: a critical assessment. Carbon. 2002;2002(40):145–149. [Google Scholar]
- Atieh MA, Bakather OY, Al-Tawbini B, Bukhari AA, Abuilaiwi FA, Fettouhi MB. Effect of carboxylic functional group functionalized on carbon nanotubes surface on the removal of lead from water. Bio Chem App. 2010;2010:1–9. doi: 10.1155/2010/603978. [DOI] [PMC free article] [PubMed] [Google Scholar]
- Madrakian T, Afkhami A, Ahmadi M, Bagheri H. Removal of some cationic dyes from aqueous solutions using magnetic-modified multi-walled carbon nanotubes. J Hazard Mater. 2011;196:109–114. doi: 10.1016/j.jhazmat.2011.08.078. [DOI] [PubMed] [Google Scholar]
- Spencer RR, Erdmann DE. Azomethine H colorimetric method for determining dissolved boron in water. Environ Sci Technol. 1979;13:954–956. doi: 10.1021/es60156a008. [DOI] [Google Scholar]
- Ahmadzadeh Tofighy M, Mohammadi T. Adsorption of divalent heavy metal ions from water using carbon nanotube sheets. J Hazard Mater. 2011;185:140–147. doi: 10.1016/j.jhazmat.2010.09.008. [DOI] [PubMed] [Google Scholar]
- Mason CW, Kannan AM. Study of carbon nanotube-supported platinum nanocatalyst fabricated with sodium formate reducing agent in ethylene glycol suspension. ISRN Nanotech. 2011;2011:1–6. [Google Scholar]
- Çelik ZC, Can BZ, Kocakerim MM. Boron removal from aqueous solutions by activated carbon impregnated with salicylic acid. J Hazar Mater. 2008;152:415–422. doi: 10.1016/j.jhazmat.2007.06.120. [DOI] [PubMed] [Google Scholar]
- Rajaković LV, Ristić MD. Sorption of boric acid and borax by activated carbon impregnated with various compounds. Carbon. 1996;34:769–774. doi: 10.1016/0008-6223(96)00009-7. [DOI] [Google Scholar]
- Vicente J, Albesa A, Lianos J, Flores E, Fertitta A, Soria D, Moreno M, Rafti M. Effect of acid oxidation treatment on adsorption properties of arc-discharge synthesized multiwall carbon nanotubes. J Argent Chem Soc. 2011;98:29–38. [Google Scholar]
- Faraj TL, Abuilaiwi A, Laoui T, Al-Harthi M, Atieh A. Modification and functionalization of multiwalled carbon nanotube (MWCNT) via FISCHER esterification. Arab J Sci Eng. 2010;35:37–48. [Google Scholar]
- Bahgat M, Farghali AA, El Rouby WMA, Khedr MH. Synthesis and modification of multi-walled carbon nano-tubes (MWCNTs) for water treatment applications. J Anal Appl Pyrol. 2011;92:307–313. doi: 10.1016/j.jaap.2011.07.002. [DOI] [Google Scholar]
- Seki Y, Seyhan S, Yurdakoc M. Removal of boron from aqueous solution by adsorption on Al2O3 based materials using full factorial design. J Hazard Mater. 2006;138:60–66. doi: 10.1016/j.jhazmat.2006.05.033. [DOI] [PubMed] [Google Scholar]
- Finqueneisel G, Zimny T, Albiniak A, Siemieniewska T, Vogt D, Weber JV. Cheap adsorbent. Part 1: active cokes from lignites and improvement of their adsorptive properties by mild oxidation. Fuel. 1998;77:549–556. doi: 10.1016/S0016-2361(97)00249-4. [DOI] [Google Scholar]
- Ai L, Zhang C, Liao F, Wang Y, Li M, Meng L, Jiang J. Removal of methylene blue from aqueous solution with magnetite loaded multi-wall carbon nanotube: kinetic, isotherm and mechanism analysis. J Hazard Mater. 2011;198:282–290. doi: 10.1016/j.jhazmat.2011.10.041. [DOI] [PubMed] [Google Scholar]
- Yu X, Luo T, Zhang Y, Jia Y, Zhu B, Fu X, Huang X. Adsorption of lead(II) on O2-plasma-oxidized multiwalled carbon nanotubes: thermodynamics, kinetics, and desorption. ACS Appl Mater Inter. 2011;3:2585–2593. doi: 10.1021/am2004202. [DOI] [PubMed] [Google Scholar]