

Abstract
Background
We studied whether severely immunocompromised, human immunodeficiency virus (HIV)–infected children who were beginning highly active antiretroviral therapy (HAART) or changing HAART regimens could spontaneously respond to a recall antigen (tetanus toxoid [TT] vaccine) or respond to a recall antigen and neoantigen (hepatitis A virus [HAV] vaccine) after 3 vaccinations.
Methods
A total of 46 children who had CD4 cell percentages <15% and who demonstrated a >0.75-log reduction in plasma HIV RNA levels within 4 weeks of starting HAART were randomized to receive vaccinations with either TT or HAV vaccines during the first 6 months of HAART. Study subjects then received the alternate vaccine during the next 6 months of HAART.
Results
Despite the early decline in viremia and the later increase in the percentage of CD4 T cells, spontaneous recovery of cell-mediated immunity (CMI) was not seen for TT. Serologic responses to TT required 3 vaccinations and were comparable in both groups. Serologic responses to HAV were infrequent and of low titer, although the group that received HAV vaccine after receiving TT vaccine performed somewhat better. CMI to HAV was virtually absent.
Conclusions
Severely immunocompromised children who are receiving HAART develop CMI and antibody to a recall antigen independent of the timing of vaccination, but they require a primary series of vaccinations. Antibodies to a neoantigen, HAV, developed when vaccination was delayed after initiation of HAART. CMI to a neoantigen was difficult to establish.
Trial registration
Clinicaltrials.gov identifier: NCT00004735/PACTG P1006.
Highly active antiretroviral therapy (HAART) has changed the face of HIV infection in children and turned a deadly disease into a chronic one by reducing the mortality [1, 2] associated with opportunistic infections [3, 4]. Therefore, the cornerstone of HAART’s effectiveness is the reduction of HIV viral burden coupled with an increase in the number of CD4 cells [5], although discordant virologic and/or immunologic responses have been described [6]. Early studies of the dynamics of immune reconstitution in adults indicated that the modest replenishment of CD4 cells after starting HAART is a bimodal process in which memory cells appear initially, followed by an increase in the population of phenotypically naive cells [7]. The predominance of the newly expanded memory cells fuels the return of T cell–mediated responses to recall antigens [8]. Children treated with HAART also experienced a significant increase in CD4 T cell count, mostly naive in phenotype, [9, 10] presumably due to the presence of a fully functional thymus [11, 12]. The functionality of newly returned cells plays an important role in the process of immune reconstitution [13] but it is not clear whether the return of CD4 cells or the inhibition of HIV replication is more important.
Other studies have evaluated whether the cellular and humoral immune dysfunction evidenced by abnormal responses to antigens and vaccines [14, 15] in the pre-HAART era can be reversed with an increased number of T cells. In contrast to other pediatric studies, the present study evaluated severely immunodeficient, HIV-infected children and adolescents, with CD4 percentages <15%, who were beginning HAART or changing HAART regimens, and we studied the dynamics of immune reconstitution over the ensuing year. The objectives of the present study were to assess the role of the kinetics of CD4 reconstitution, the effect of viremia on the spontaneous return of memory cells’ immune function, the ability of memory cells to respond to vaccination, the ability of naive cells to respond to a neoantigen, and the durability of any responses that developed.
SUBJECTS, MATERIALS, AND METHODS
Study Design
Pediatric AIDS Clinical Trials Group (PACTG) Protocol 1006 was a randomized, comparative, response study of severely immunosuppressed (CD4 cell percentage <15%), HIV-infected children and adolescents beginning open-label HAART (defined as 3 or more antiretrovirals from at least 2 different classes of drugs, including ≥1 nonnucleoside reverse-transcriptase inhibitor [NNRTI] or protease inhibitor [PI] or T-20 [enfuvirtide] for those subjects who were not naive to nucleoside analogues). The inclusion criteria were as follows: (1) age 2–24 years, (2) CD4 cell percentage <15%, (3) beginning or changing to ≥2 new anti-retroviral drugs as part of a HAART regimen at or 2 weeks prior to study entry, (4) no previous HAV vaccination or antibody to HAV, and (5) completion of primary tetanus vaccination series. The study was approved by the institutional review boards of all the sites where subjects were enrolled, and each participant (or the individual’s parent or legal guardian) provided written, informed consent prior to enrollment in the study.
Subjects, Randomization, Study Treatments, and Follow-Up
All subjects were randomized into 2 treatment groups (hereafter, “group 1” and “group 2”), and only virologic responders, those subjects with a >0.75-log decrease in plasma HIV RNA concentrations, received study vaccinations. Subjects in group 1 received age-appropriate tetanus toxoid (TT) vaccine in the form of DTaP, Td, or DT vaccines (originally obtained from Wyeth-Ayerst and later from Aventis-Pasteur) at weeks 8, 16, and 24 of the study and hepatitis A (HAV) vaccine (HAVRIX, 360 ELISA units/0.25 mL; GlaxoSmithKline Pharmaceuticals) at weeks 32, 40, and 48. Subjects in group 2 received HAV vaccinations at 8, 16, and 24 weeks and age-appropriate TT vaccinations at 32, 40, and 48 weeks. The rationale for the crossover design of the study was that it would facilitate evaluation of the breadth as well as the timing of responses to a neoantigen (HAV) and to a recall antigen (TT). In a later version of the protocol, an optional HAV booster vaccination was scheduled at study week 100, but only 5 individuals participated in this revised protocol prior to study closure.
Complete blood counts and biochemical assays, counts and percentages for CD4 and CD8 cells, and plasma viral loads were assessed at baseline (week 0) and at weeks 4, 16, 24, 32, 40, 48, 76, and 100. All immune responses, including lymphocyte proliferation and serologic responses, were measured at baseline and at weeks 12, 28, 36, 52, 76, and 100. All toxicities noted during the study were classified by use of the toxicity table for grading severity of pediatric (age, >3 months) adverse experiences created by the National Institute of Allergy and Infectious Diseases, Division of Acquired Immunodeficiency Syndrome. The relationships of toxicities to study vaccines were determined during monthly team conference calls.
Laboratory analysis
HIV viral load and lymphocyte subset assays
Plasma samples went to a central, certified PACTG network laboratory for quantitative measurements of HIV RNA, which were obtained by using the first-generation Roche polymerase chain reaction (PCR) kit. The lower level of detection of the assay was 400 copies/mL. All the lymphocyte subset measurements were done at one of the certified PACTG flow cytometry laboratories and were reported as absolute numbers of cells per cubic millimeter and as percentages.
HAV antibody assay
Anti-HAV antibodies were measured by using a quantitative ELISA with precoated HAV microtiter plates (Viral Antigens). They were incubated with serial dilutions of anti-HAV quantitated in accordance with World Health Organization (WHO) Standards and 100μL of serum samples diluted 1:21 in assay IgG diluent (Viral Antigens). This assay was validated by using 20 serum samples from HAV-naive, healthy volunteers and 10 serum samples with previously determined anti-HAV antibody concentrations (courtesy of Dr. Paul Willems, GlaxoSmithKline Vaccine Division). Titers ≥20 mIU/mL were considered protective against HAV infection and also defined HAV immune status [16].
TT antibody assay
Quantitation of antibodies to TT was done by using the Tetanus IgG ELISA kit (RE56901; IBL Immuno Biological Laboratories). Optical density readings were compared to a WHO standard antitetanus antibody–derived curve. Protection against tetanus was established at 0.1 IU/mL of anti-TT antibody [17].
Lymphoproliferative assay (LPA)
Peripheral blood mono-nuclear cells (PBMCs) were isolated, and 100,000 PBMCs were placed in quadruplicate microtiter wells with either hepatitis A antigen (1440 units/mL; GlaxoSmithKline), tetanus antigen (2.5 μg/ mL; Connaught Laboratory), or medium control in RPMI containing 20% human AB serum. After 6 days in a 5% CO2 atmosphere at 37°C, the plates were pulsed with tritiated thymidine for 6 h, DNA was harvested onto glass fiber filters, and radioactivity was measured with a scintillation counter as counts per minute. Results were expressed as a stimulation index (SI), the ratio of median counts per minute in antigen-stimulated wells divided by the median counts per minute in unstimulated-medium control wells. Weekly measurements of cell-mediated immunity (CMI) to recall antigens obtained by using PBMCs from a normal donor served as positive controls. An SI >3 was considered a positive response and was routinely achieved in normal controls.
Statistical Analysis
To evaluate the spontaneous return of function, we used paired t tests to detect a ≥3-fold improvement in log-transformed SI values of TT LPA results, compared with baseline values, by weeks 12 and 28 for group 2. To evaluate the response to recall antigen after vaccination, we used a t test to detect a ≥3-fold difference between the 2 treatment groups with respect to the week-12 log-transformed SI values of TT LPA results. To evaluate the primary response to vaccination, we used a χ2 test to compare the week-28 serologic response rates to HAV vaccine in the 2 groups. We made the following assumptions: the rate of response in group 1 was no greater than 10%, and the minimal effect of clinical importance would be an increase to a 35% response rate in group 2.
Missing data were assumed to be random. Unless otherwise stated, all P values were 2-tailed, and the level of significance used was .05. The changes at various time points from baseline values for the counts and percentages of CD4 and CD8 cells and the changes in log10 plasma HIV RNA levels were summarized and assessed for statistical significance by using Wilcoxon matched-pairs signed rank tests and paired t tests, respectively. The serologic response titers and SI values were compared between groups by using Wilcoxon rank sum tests. The proportion of each group that showed a positive serologic response to each antigen (hereafter, “serologic responders”) and the proportion of each group that showed a positive CMI response to each antigen (hereafter, “CMI responders”) were compared across groups by using Fisher’s exact test.
RESULTS
Characteristics of the Study Population
Eligible subjects were enrolled at 24 clinical sites and subsites from March 2000 through February 2006. Of 88 randomized subjects who enrolled in the study, 46 were virologic responders (VRs); these individuals received vaccinations (22 subjects in group 1 and 24 in group 2). Of the 22 VRs in group 1, there were 18 (82%) who received all 6 vaccinations and 4 subjects received 5, 4, 3, and 2 vaccinations each, respectively. Six of the 22 VRs in group 1 did not continue to participate in the study until week 100, for the following reasons: early closure of the study (3 subjects), closure of enrollment site (1 subject), and nonadherence or a need for unapproved changes to the antiretroviral regimen (2 subjects). Of the 24 VRs in group 2, a total of 21 (87.5%) received all 6 vaccinations. Five subjects in group 2 did not continue to participate in the study until week 100 because of closure of individual enrollment sites (1 subject) or early closure of the study (4 subjects). The demographic and baseline immunologic characteristics of the study population are presented in table 1. Overall, individual HAART regimens were diverse. The most common primary regimens were a single NNRTI alone, a single PI alone, boosted versions of PIs, or 2 PIs. Efavirenz and lopinavirritonavir (Kaletra) were the drugs most commonly prescribed.
Table 1.
Demographic characteristics and baseline immunologic characteristics of virologic responders in the study population.
| Characteristic | Virologic responders | ||
|---|---|---|---|
| All | In group 1 | In group 2 | |
| Sex, no. (%) | |||
| Male | 25 (54) (n = 46) | 12 (55) (n = 22) | 13 (54) (n = 24) |
| Female | 21 (46) (n = 46) | 10 (45) (n = 22) | 11 (46) (n = 24) |
| Race or ethnicity, no. (%) | |||
| White (NH) | 3 (7) (n = 46) | 1 (5) (n = 22) | 2 (8) (n = 24) |
| Black (NH) | 25 (56) (n = 46) | 10 (45) (n = 22) | 15 (63) (n = 24) |
| Hispanic | 17 (38) (n = 46) | 10 (45) (n = 22) | 7 (29) (n = 24) |
| Unknown | 1 (2) (n = 46) | 1 (5) (n = 22) | 0 (0) (n = 24) |
| Age, median (range), years | 13 (3–17) (n = 46) | 13 (3–17) (n = 22) | 12 (3–16) (n = 24) |
| CD4 cells | |||
| Count, median (range), cells/mm3 | 96 (5–636) (n = 44) | 94 (5–636) (n = 21) | 101 (7–605) (n = 23) |
| Percentage, median (range) | 7(1–14) (n = 45) | 7 (1–14) (n = 21) | 7 (1–14) (n = 24) |
| CD8 cells | |||
| Count, median (range), cells/mm3 | 688 (154–2923) (n = 39) | 688 (154–2889) (n = 19) | 850 (165–2923) (n = 20) |
| Percentage, median (range) | 50 (32–81) (n = 39) | 49 (32–69) (n = 21) | 58 (33–81) (n = 20) |
| Viral load, median (range), copies/mL | 64,911 (400–3,633,779) (n = 46) | 64,911 (696–44,294) (n = 22) | 73,557 (400–3,633,779) (n = 24) |
| HIV RNA, median (range), log10 copies/mL | 4.8 (2.6–6.6) (n = 46) | 4.8 (2.8–5.6) (n = 22) | 4.9 (2.6–6.6) (n = 24) |
NOTE. A total of 88 study subjects were enrolled, 46 of whom were virologic responders (22 subjects in group 1 and 24 in group 2). Group 1 subjects received a series of tetanus vaccinations followed by hepatitis A vaccinations; group 2 subjects received hepatitis A vaccinations followed by tetanus vaccinations. NH, non-Hispanic.
Changes in Counts and Percentages of CD4 and CD8 Cells and in Plasma Viral Loads
Measurement of the counts and percentages of CD4 and CD8 cells and measurement of plasma viral loads were performed simultaneously. Data for CD4 cells and viral loads are shown in figures 1A–1C. We observed an overall increase in the absolute numbers of CD4 and CD8 cells and in the percentage of CD4 cells, coupled with a decrease in plasma viral load. CD4 cells counts and percentages increased significantly (P < .002) at all time points until week 100.
Figure 1.
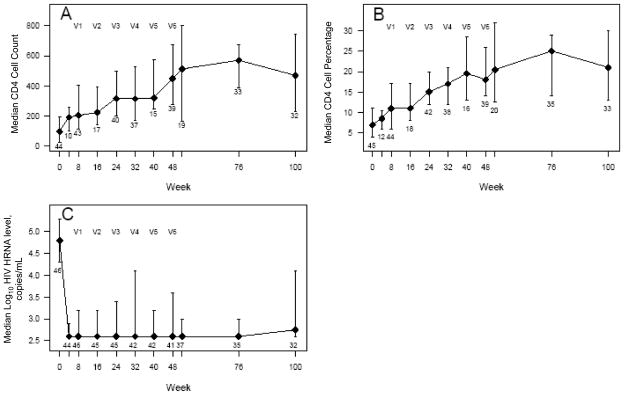
CD4 cell population and viral load. Median and interquartile range (IQR) for CD4 cell counts (A), CD4 cell percentages (B), and log10 HIV-1 RNA levels (C). V1–V6 indicate the time points when the 6 vaccinations were administered. The number of subjects who had data for each week is indicated immediately below the IQR bar.
Each treatment group’s trend with respect to changes in CD4 and CD8 cell count and percentage and viral load values was similar to that for the values of the group overall (data not shown). The VRs experienced a decrease in median log10 RNA copies/mL from 4.8 to 2.6 after 4 weeks, and at week 100 they had a median viral load of 2.75 log10 RNA copies/mL (P < .001) (figure 1C). The median change in viral load from baseline was −1.55 log10 copies/mL.
The objectives of the study were to assess the following: (1) the ability of newly derived (presumed memory) CD4 T cells to spontaneously develop lymphoproliferative responses to a recall antigen, TT, or to develop responses after a single booster vaccination with TT vaccine; (2) the ability of the reconstituting immune system to respond to a full series of vaccinations with TT; (3) the development of protective antibody responses to a T cell–dependent antigen, by use of a primary series of HAV vaccinations; (4) the development of lymphoproliferative responses to T cell–dependent HAV and TT antigen after receipt of vaccine; (5) the durability of any response beyond the last vaccination; and (6) the safety of giving multiple vaccinations with vaccines approved by the US Food and Drug Administration for HIV-infected children and young adults.
Lymphoproliferative Response to TT
Spontaneous return of function
To assess whether there would be a return of function in the absence of reexposure to a recall antigen (TT), the analysis focused on the group that did not receive TT vaccine initially (group 2). Although the mean differences in log10 SI from baseline to 12 and 28 weeks were −0.077 and 0.1, respectively, (corresponding to a 0.84-fold and 1.26-fold change in SI, respectively), these differences were not significant (P = .60 and .50, respectively) (figure 2).
Figure 2.

Lymphoproliferative response to tetanus toxoid (TT). Group 1 subjects received a series of tetanus vaccinations followed by hepatitis A vaccinations; group 2 subjects received hepatitis A vaccinations followed by tetanus vaccinations. V1–V6 indicate the time points when the 6 vaccinations were administered. Data are medians and interquartile ranges for stimulation index (SI) values to TT for the 2 treatment groups, represented on the log10 scale (A), and percentage of individuals with an SI≥3 (all CMI responders to TT) (B). The 2 groups were compared as described in the text, using the Wilcoxon rank sum test for the SI values and Fisher’s exact test for the percentage of CMI responders. *P < .05. The pairs of numbers at the bottom of each panel indicate the number of subjects who had data for each week.
Response to recall antigen after a single vaccination
The extent to which patients responded to tetanus as a recall antigen was assessed by comparing week-12 TT LPA data from the 2 groups; at this time point, subjects in group 1 had received a single tetanus vaccination and subjects in group 2 had not received TT vaccine at all. Although the mean log10 SI was 0.39 in group 1 and 0.16 in group 2, which correspond to an SI of 2.45 and 1.45, respectively, this difference was not significant (P = .08).
Comparative analysis of the groups at week 28
The TT SI values from the groups were compared at week 28, when subjects in group 1 had received 3 tetanus vaccinations and subjects in group 2 had not received TT vaccine at all. The SI for group 1 subjects was higher than that for group 2 subjects (P = .02). The median (interquartile range [IQR]) SI was 9.3 (1.7–38.9) in group 1 and 1.3 (0.9– 4.1) in group 2. A greater number of TT CMI responders were observed in group 1 than in group 2 (11 [73%] of 15 in group 1 and 7 [35%] of 20 in group 2; P = .03).
Comparative analysis after complete tetanus vaccination series (week 28 data for group 1 vs. week 52 data for group 2)
By comparing the SI for both groups after completion of the vaccination series, we had the opportunity to see whether increased numbers of CD4 cell at the time of vaccination in group 2 would improve the immune response. The SIs observed for the 2 groups were not significantly different (P = .36). The median (IQR) SI was 9.3 (1.7–38.9) in group 1 and 24.7 (2.6–213.2) in group 2. The percentage of CMI responders in the groups (11 [73%] of 15 in group 1 vs. 13 [72%] of 18 in group 2) was not significantly different (P = .99).
Comparative analysis at 1 year after completing all tetanus vaccinations (week 76 data for group 1 vs. week 100 data for group 2)
We looked at the SI at this time point as a way to assess the persistence of memory cells as a function of the timing of vaccination. The median (IQR) SI was 4.8 (1.2–59.3) in group 1 and 21.1 (1.2–73.8) in group 2; the percentage of responders was 55% (6 of 11) in group 1 and 65% (11 of 17) in group 2. When the groups were compared, there was not a significant difference (P = .68 and .70, respectively).
Serologic Response to TT
Comparative analysis at week 28
The median TT titer for each group was compared at week 28, when group 1 subjects had received tetanus vaccinations and group 2 subjects had not. The median (IQR) titer of group 1 subjects was higher than that of group 2 subjects (3.63 IU/mL [1.99 – 6.19 IU/mL] for group 1 and 0.11 IU/mL [0.06 – 0.47 IU/mL] for group 2; P < .001). There were more TT responders observed in group 1 at week 28 (after 3 vaccinations) in group 1 than in group 2 at week 28 (18 [100%] of 18 in group 1 and 11 [55%] of 20 in group 2; P = .001) (figure 3).
Figure 3.

Serologic response to tetanus toxoid (TT) vaccine. Group 1 subjects received a series of tetanus vaccinations followed by hepatitis A vaccinations; group 2 subjects received hepatitis A vaccinations followed by tetanus vaccinations. V1–V6 indicate the time points when the 6 vaccinations were administered. Data are median and interquartile range (IQR) TT titers for the 2 treatment groups (A) and the percentage of individuals with a protective level of antibody (positive titer, ≥ 0.1 IU/mL of anti-TT) (B). The 2 groups were compared as described in the text, by using the Wilcoxon rank sum test for median (IQR) TT titers and Fisher’s exact test for the percentage of individuals with a positive titer. *P < 0.05. The pairs of numbers at the bottom of each panel indicate the number of subjects who had data for each week.
Comparative analysis of the groups after complete tetanus vaccination series (week 28 data for group 1 vs. week 52 data for group 2)
The serologic titers of subjects from both groups were similar after completion of the vaccination series (P = .462), despite increased CD4 cell counts in group 2 subjects. Median (IQR) titers in the groups were 3.63 IU/mL (1.99 – 6.19 IU/mL ) and 2.75 IU/mL (1.0–5.71 IU/mL), respectively. The percentage of responders in each group was not significantly different (100% [18 of 18] in group 1 vs. 89% [16 of 18] in group 2; P = .243).
Comparative analysis of the groups 1 year after completing all tetanus vaccinations (week 76 for group 1 vs. week 100 for group 2)
At this time point, median (IQR) titers in the 2 groups were 0.43 IU/mL (0.18–2.03 IU/mL) and 0.80 IU/mL (0.21–2.08 IU/mL), respectively. The median titers and the percentage of responders (100% [15 of 15] in group 1 vs. 81% [13 of 16] in group 2) were similar (P = .681 and .226, respectively).
Serologic Response to HAV Vaccine
Effect of vaccination (comparative analysis at week 28)
Subjects in group 2, who received HAV vaccine first, demonstrated a higher median (IQR) titer than subjects in group 1 (33 mIU/mL [13–71] in group 2 vs 7 mIU/mL (3–18) in group 1; P = .001). Of 20 subjects in group 2, there were 12 (60%) who had a protective response to the HAV vaccine, compared with 2 (11%) of the 18 subjects in group 1 who had not yet received the vaccine (P = .002) (figure 4).
Figure 4.

Serologic Response to hepatitis A virus vaccine. Group 1 subjects received a series of tetanus vaccinations followed by hepatitis A vaccinations; group 2 subjects received hepatitis A vaccinations followed by tetanus vaccinations. V1–V6 indicate the time points when the 6 vaccinations were administered. Data are median and interquartile range (IQR) for hepatitis A titers for the 2 treatment groups (A) and the percentage of individuals with a positive titer of ≥20 mIU/mL (B). The 2 groups were compared as described in the text, by using the Wilcoxon rank sum test for median (IQR) titer values and Fisher’s exact test for the percentage of individuals with a positive titer. *P < .05. The pairs of numbers at the bottom of each panel indicate the number of subjects who had data for each week.
Effect of vaccination timing (comparative analysis after the complete HAV vaccination series; week 52 data for group 1 vs. week 28 data for group 2)
When the groups were compared after completing all HAV vaccinations, a significant difference was seen with respect to the titers (P = .008) but not with respect to the proportion of serologic responders to HAV (P = .071). Subjects in group 1 (who received the HAV vaccine after the TT vaccine) had a higher median titer than group 2 subjects (median [IQR], 107 mIU/mL [84–508 mIU/mL] in group 1 vs. 33 mIU/mL [13–71 mIU/mL] in group 2). Of 16 group 1 subjects, 14 (88%) were responders, compared with 12 (60%) of 20 group 2 subjects.
Durability of response (comparative analysis 1 year after completing all HAV vaccinations; week 100 data for group 1 vs. week 76 data for group 2)
At this time point, the median (IQR) titer was similar for both groups: 71 mIU/mL (31–90 mIU/mL) for group 1 and 18 mIU/mL (9 – 63 mIU/ mL) (P = .064). However, 12 (86%) of 14 group 1 subjects were serologic responders to HAV, compared with 9 (50%) of 18 in group 2 (P = .039).
Lymphoproliferative Responses to HAV Vaccine to Assess T Helper Function
Comparative analysis at week 28
At this time point, the median (IQR) SI for each group was similar: 0.8 (0.7–1.2) for group 1 and 1.1 (0.9–1.3) for group 2 (P = .08). The proportion of responders in each group was not significantly different: 0 (0%) of 15 group 1 subjects and 1 (5%) of 20 group 2 subjects were responders (P = .57).
Comparative analysis after the complete HAV vaccination series (week 52 data for group 1 vs. week 28 data for group 2)
No significant difference was observed when the 2 groups were compared after completing all HAV vaccinations (P = .16 and .28, respectively, for SI values and the percentage of CMI responders to HAV). Group 1 subjects, who received the HAV vaccine during the second 6 months of HAART, had a median (IQR) SI of 1.4 (0.9–2.4). Group 2 subjects had a median (IQR) SI of 1.1 (0.9–1.3). Of 13 group 1 subjects, 3 (23%) were CMI responders to HAV, compared with 1 (5%) of 20 group 2 subjects.
Comparative analysis 1 year after completing all HAV vaccinations (week 100 data for group 1 vs. week 76 data for group 2)
At this time point, the median (IQR) SI was similar for both groups: 1.4 (0.8–2.4) for group 1 and 1.1 (0.9–1.5) for group 2 (P = .84). One (8%) of 13 group 1 subjects was a CMI responder to HAV, compared with 3 (17%) of 18 group 2 subjects (P = .62).
Vaccine Safety
The vaccines were well tolerated and no severe adverse effects (i.e., grade >3) attributed to them were reported.
DISCUSSION
This study was designed to determine whether suppression of viremia, an increase in the number of CD4 T cells, or both were optimal for “functional” immune reconstitution in a cohort of individuals who had sustained a significant decline in their CD4 cell percentage prior to beginning HAART or changing their HAART regimen. The ability to respond to a neoantigen during the first year of HAART was poor, and the ability to respond to a recall antigen required from 1 to 3 vaccinations, indicating that the suppression of viremia was insufficient to restore functional cellular immune responses. A significant drop in viral load after beginning HAART was sustained in both groups during the study, which did not allow for the analysis of viral load effects that we had hoped for. Despite an early significant increase in T cell percentages, values above 25% were rarely attained, underscoring the difficulty in rapidly restoring CD4 cell populations in severely immunosuppressed patients.
Protective antibody to TT was seen at baseline in both groups, because a primary series of TT vaccinations was required for study entry. However, less than half of the previously vaccinated patients had protective levels of antibody to TT. The loss of humoral immunity to vaccines has been previously reported in HIV-infected children [18]. The increase in median titer and in the proportion of patients with titers >0.1 IU/mL in group 1 (the group that initially received tetanus vaccinations), compared with values for group 2, was significant only after the completion of 3 vaccinations, contrary to what has been observed in HIV-infected children with more normal immune responses. Rosenblatt et al. reported a robust increase in titers and proportion of responders after a single dose of TT in a cohort of children with CD4 percentages >25%; these subjects were vaccinated a longer period after beginning HAART or changing HAART regimen, allowing more time for immune reconstitution [19].
In our study, the timing of vaccinations after beginning HAART did not seem to influence the strength of the responses to recall antigen. Successful seroconversion after 2 HAV vaccination in children who were receiving HAART and who had stable T cell populations has been reported [20]. Three HAV vaccinations were needed to produce a significant rate of response in this group which had a CD4 cell percentage <15% at baseline, despite an increase of 100–200 in the absolute number of CD4 cells at the time of vaccination. Only 60% of HAV vaccine recipients responded if they were vaccinated in the first 6 months after beginning HAART; this number increased to 90% if vaccination was delayed. The proportion of responders in the delayed-vaccination group is comparable to that seen in a group of previously severely immunocompromised children with CD4 cell percentages >25% who received 2 HAV vaccinations 24 weeks apart [21]. However, in our cohort, the magnitude of the responses was inferior to the median titer achieved in that cohort (602 mIU/mL) after a third vaccination. The peak titer for HAV in our study was seen in group 1 (the group that was vaccinated ≥6 months after starting HAART). The sustainability of the titers was poor. A booster dose at week 100 was offered to all patients but few received it because of study closure. Those few individuals who received the booster dose developed noticeably higher titers, in the near-normal range, to the vaccine. These findings suggest that functional reconstitution may not simply be the result of the number of CD4 T cells; other functional or regulatory factors may improve over time and be equally important.
The recovery of CMI to TT did not occur spontaneously, although all subjects had previously received TT vaccines. Wein-berg et al. also observed recovery of tetanus-specific lymphopro-liferation in HIV-infected children after 48 weeks of effective HAART, correlated with low plasma viral load and a low percentage of activated CD8 cells [22]. In our study, limited CMI was seen after 3 vaccinations with TT. The response rate was far from the 50% response rate seen in subjects with a stable T cell population [23]. Moreover, the LPA response after a booster vaccination represented only a 4-fold increase over values observed prior to booster administration.
Our results indicate that, in a treatment-experienced population with a low percentage of T cells, a sustainable suppression of viremia can be achieved on initiation of HAART. Cell regeneration without complete viral suppression occurs very early after treatment, but the cells’ functionality is partial. The approach to boosting immunity in such a population should perhaps be different from the practices advocated for a population with less immune attrition. The stimulation of returning memory cells may require reintroduction of recall antigens with a complete primary vaccination series, rather than a booster dose. More importantly, the administration of vaccinations after initiation of HAART should be delayed if the vaccine involves a neoantigen.
Acknowledgments
Financial support: Pediatrics AIDS Clinical Trials Group of the National Institute of Allergy and Infectious Diseases (grant U01AI068632 to X.X.X.); National Institute of Child Health and Human Development and the National Institutes of Health (contract N01-HD-3-3365 to X.X.X.); Aventis-Pasteur (provided vaccine); Glaxo-SmithKline (provided vaccine).
Footnotes
Potential conflicts of interest: none reported.
Presented in part: 11th Conference on Retroviruses and Opportunistic Infections, San Francisco, California, 8 – 11 February 2004 (abstract 916); 13th Conference on Retroviruses and Opportunistic Infections, Denver, Colorado, 5–8 February 2006 (abstract R-161).
References
- 1.Gortmaker SL, Hughes M, Cervia J, et al. Effect of combination therapy including protease inhibitors on mortality among children and adolescents infected with HIV-1. N Engl J Med. 2001;345:1522–8. doi: 10.1056/NEJMoa011157. [DOI] [PubMed] [Google Scholar]
- 2.Sanchez JM, Ramos Amador JT, Fernandez de Miguel S, et al. Impact of highly active antiretroviral therapy on the morbidity and mortality in Spanish human immunodeficiency virus-infected children. Pediatr Infect Dis J. 2003;22:863–7. doi: 10.1097/01.inf.0000091282.70253.5f. [DOI] [PubMed] [Google Scholar]
- 3.Gona P, Van Dyke RB, Williams PL, Dankner WM, Chernoff MC, Nachman SA, Seage GR., 3rd Incidence of opportunistic and other infections in HIV-infected children in the HAART era. JAMA. 2006;296:330–1. doi: 10.1001/jama.296.3.292. [DOI] [PubMed] [Google Scholar]
- 4.Viani RM, Arenata MR, Deville JG, Spector SA. Decrease in hospitalization and mortality rates among children with perinatally acquired HIV type 1 infection receiving highly active antiretroviral therapy. Clin Infect Dis. 2004;39:725–31. doi: 10.1086/423178. [DOI] [PubMed] [Google Scholar]
- 5.Resino S, Bellon JM, Resino R, et al. Extensive implementation of highly active antiretroviral therapy shows great effect on survival and surrogate markers in vertically HIV-infected children. Clin Infect Dis. 2004;38:1605–12. doi: 10.1086/420738. [DOI] [PubMed] [Google Scholar]
- 6.Essajee SM, Kim M, Gonzalez C, et al. Immunologic and virologic responses to HAART in severely immunocompromised HIV-1 infected children. AIDS. 1999;13:2523–32. doi: 10.1097/00002030-199912240-00005. [DOI] [PubMed] [Google Scholar]
- 7.Pakker NG, Notermans DW, de Boer RJ, et al. Biphasic kinetics of peripheral blood T cells after triple combination therapy in HIV-1 infection: a composite of redistribution and proliferation. Nat Med. 1998;4(208):14. doi: 10.1038/nm0298-208. [DOI] [PubMed] [Google Scholar]
- 8.Li TS, Tubiana R, Katlama C, Calvez V, Ait Mohand H, Autran B. Long-lasting recovery in CD4 T-cell function and viral-load reduction after highly active antiretroviral therapy in advanced HIV-1 disease. Lancet. 1998;352:1682–6. doi: 10.1016/s0140-6736(97)10291-4. [DOI] [PubMed] [Google Scholar]
- 9.van Rossum AM, Scherpbier HJ, van Lochem EG, et al. Therapeutic immune reconstitution in HIV-1 infected children is independent of their age and pretreatment immune status. AIDS. 2001;15:2267–75. doi: 10.1097/00002030-200111230-00008. [DOI] [PubMed] [Google Scholar]
- 10.Ometto l, De Forni D, Patiri F, et al. Immune reconstitution in HIV-1 infected children on antiretroviral therapy: role of thymic output and viral fitness. AIDS. 2002;16:839–49. doi: 10.1097/00002030-200204120-00003. [DOI] [PubMed] [Google Scholar]
- 11.Doueck DC, McFarland RD, Keiser PH, et al. Changes in thymic function with age and during the treatment of HIV infection. Nature. 1998;396:690–5. doi: 10.1038/25374. [DOI] [PubMed] [Google Scholar]
- 12.Nikolic-Djokic D, Essajee S, Rigaud M, et al. Immunoreconstitution in children receiving highly active antiretroviral therapy depends on the CD4 cell percentage at baseline. J Infect Dis. 2002;185:290–8. doi: 10.1086/338567. [DOI] [PubMed] [Google Scholar]
- 13.Vigano A, Vella S, Saresella M, et al. Early immune reconstitution after potent antiretroviral therapy in HIV-infected children correlates with the increase in thymus volume. AIDS. 2000;14:251–61. doi: 10.1097/00002030-200002180-00007. [DOI] [PubMed] [Google Scholar]
- 14.Peters VB, Mayer L, Sperber KE. Correlation of clinical parameters and immunological function with human immunodeficiency virus plasma viremia in children. Viral Immunol. 1999;12:139–48. doi: 10.1089/vim.1999.12.139. [DOI] [PubMed] [Google Scholar]
- 15.Borkowsky W, Rigaud M, Krasinski K, Moore T, Lawrence R, Pollack H. Cell-mediated and humoral immune responses in children infected with human immunodeficiency virus during the first four years of life. J Pediatr. 1992;120:371–5. doi: 10.1016/s0022-3476(05)80899-6. [DOI] [PubMed] [Google Scholar]
- 16.American Academy of Pediatrics. Hepatitis A. Red Book: 2006 Report of the Committee on Infectious Diseases. 27. Elk Grove Village, IL: American Academy of Pediatrics; 2006. p. 331. [Google Scholar]
- 17.Simonsen O, Bentzon MW, Heron I. ELISA for the routine determination of antitoxic immunity to tetanus. J Biol Stand. 1986;14:231–9. doi: 10.1016/0092-1157(86)90008-9. [DOI] [PubMed] [Google Scholar]
- 18.Melvin AJ, Mohan KM. Response to immunization with measles, tetanus, and Haemophilus influenzae type B vaccines in children who have human immunodeficiency virus type 1 infection and are treated with highly active antiretroviral therapy. Pediatrics. 2003;111:e641–4. doi: 10.1542/peds.111.6.e641. [DOI] [PubMed] [Google Scholar]
- 19.Rosenblatt HM, Song LY, Nacham SA, et al. Tetanus immunity after diphtheria, TTs, and acellular pertussis vaccination in children with clinically stable HIV infection. J Allergy Clin Immunol. 2005;116:698–703. doi: 10.1016/j.jaci.2005.05.016. [DOI] [PubMed] [Google Scholar]
- 20.Gouvea AF, De Moreaes-Pinto MI, Ono E, et al. Immunogenicity and tolerability of hepatitis A vaccine in HIV-infected children. Clin Infect Dis. 2005;41:544–8. doi: 10.1086/432055. [DOI] [PubMed] [Google Scholar]
- 21.Weinberg A, Gona P, Nachman SA, et al. Antibody responses to hepatitis A virus vaccine in HIV-infected children with evidence of immunologic reconstitution while receiving highly active antiretroviral therapy. J Infect Dis. 2006;193:302–11. doi: 10.1086/498979. [DOI] [PubMed] [Google Scholar]
- 22.Weinberg A, Pahwa S, Oyomopito R, et al. Antimicrobial-specific cell-mediated immune reconstitution in children with advanced human immunodeficiency virus infection receiving highly active antiretroviral therapy. Clin Infect Dis. 2004;39:107–14. doi: 10.1086/420931. [DOI] [PubMed] [Google Scholar]
- 23.Ching N, Deville JG, Nielsen KA, et al. Cellular and humoral immune responses to a TT booster in perinatally HIV-1-infected children and adolescents receiving highly active antiretroviral therapy (HAART) Eur J Pediatr. 2007;166:51–6. doi: 10.1007/s00431-006-0184-2. [DOI] [PubMed] [Google Scholar]