

Abstract
Background. The potential impact of antiretroviral therapy (ART) and pre-exposure prophylaxis (PrEP) with overlapping and nonoverlapping antiretrovirals (ARVs) on human immunodeficiency virus (HIV) transmission and drug resistance is unknown.
Methods. A detailed mathematical model was used to simulate the epidemiological impact of ART alone, PrEP alone, and combined ART + PrEP in South Africa.
Results. ART alone initiated at a CD4 lymphocyte cell count <200 cells/µL (80% coverage and 96% effectiveness) prevents 20% of HIV infections over 10 years but increases drug resistance prevalence to 6.6%. PrEP alone (30% coverage and 75% effectiveness) also prevents 21% of infections but with lower resistance prevalence of 0.5%. The ratio of cumulative infections prevented to prevalent drug-resistant cases after 10 years is 7-fold higher for PrEP than for ART. Combined ART + PrEP with overlapping ARVs prevents 35% of infections but increases resistance prevalence to 8.2%, whereas ART + PrEP with nonoverlapping ARVs prevents slightly more infections (37%) and reduces resistance prevalence to 7.2%.
Conclusions. Combined ART + PrEP is likely to prevent more HIV infections than either strategy alone, but with higher prevalence of drug resistance. ART is predicted to contribute more to resistance than is PrEP. Optimizing both ART and PrEP effectiveness and delivery are the keys to preventing HIV transmission and drug resistance.
Keywords: antiretroviral therapy, ART, chemoprophylaxis, HIV drug resistance, HIV epidemic, HIV transmission, mathematical model, pre-exposure prophylaxis, PrEP, South Africa
(See the editorial commentary by Celum et al on pages 189–91)
Oral antiretroviral (ARV) pre-exposure prophylaxis (PrEP) is a new biomedical intervention against human immunodeficiency virus (HIV) transmission with proven efficacy [1–3]. There is concern, however, about the potential emergence and spread of HIV drug resistance arising from the rollout of PrEP, particularly in resource-constrained settings, where antiretroviral therapy (ART) options are limited [4]. This concern is amplified by the possibility that the same ARVs will be used for both ART and PrEP. The combination of 2 nucleoside reverse-transcriptase inhibitors, tenofovir (TDF) and lamivudine or emtricitabine (3TC or FTC, respectively), with 1 nonnucleoside reverse-transcriptase inhibitor (NNRTI), efavirenz or nevirapine, is the World Health Organization–recommended first-line ART regimen in several countries worldwide, including South Africa [4], and TDF or TDF + FTC have shown efficacy in HIV prevention trials [1–3]. Thus far, only 9 drug-resistant cases have been observed among clinical trial participants on PrEP, most of whom had unrecognized acute infection at enrollment. However, clinical trials of PrEP are not designed to address the population-level and/or long-term epidemiological impact of PrEP, including consequences of drug resistance. We therefore used a mathematical model [5] to examine the potential impact of orally administered overlapping and nonoverlapping PrEP and ART on HIV transmission and drug resistance in South Africa.
METHODS
Model Structure
We developed and analyzed a detailed mathematical model to assess the impact of PrEP and ART implementation on the adult population (aged 15–49 years) of South Africa, using deterministic and stochastic modeling techniques and the programming language C/C++. The model describes population and epidemiological stratifications based on gender (male; female), sexual activity (high; medium; low; lowest), PrEP and ART use status (on; not on), infection status (susceptible; infected), stage of HIV infection (acute preseroconversion; acute postseroconversion; early chronic; late chronic; AIDS), and HIV drug susceptibility (drug-sensitive; drug-resistant). Model parameter assignments are made using recent results from PrEP trials [1–3, 6, 7] and data mainly from South/sub–Saharan Africa on HIV disease progression [8], infectivity [9], sexual behavior [10], ART rollout [4, 11–18], and HIV drug resistance [19–33]. The model is calibrated to simulate the HIV epidemic in South Africa with adult HIV prevalence (Supplementary Figure S1) reaching 17% at the end of 2003, having a female-to-male prevalence ratio of 1.6 and HIV incidence near 2.4% [34]. A simplified model structure is shown in Supplementary Figure S2 and model input parameters are shown in Tables 1 and 2 and Supplementary S1. Model equations and details are provided in the Supplementary Text S1.
Table 1.
Model ART-Related Input Parameters
| Parameter | Uncertainty |
||||
|---|---|---|---|---|---|
| Symbol | Base Case | LHS Range | Unit | Reference | |
| ART coverage | |||||
| Start of ART rollout | 2004 | [17] | |||
| % of eligible individuals enrolled in ART at 2010 | 55% | [18] | |||
| % of eligible individuals enrolled in ART at 2012 | Θ | 80% | 65%–95% | [11] | |
| Coverage beyond 2012 | 80% | 65%–95% | Per year | ||
| ART dropout | |||||
| During first year of ART | 1/ηH | 0.10 | 0.05–0.15 | Per year | [13, 16] |
| During subsequent years of ART | 1/ηT | 0.05 | 0.025–0.075 | Per year | [13, 16] |
| Infectivity relative to WT virus | |||||
| On suppressive ART | 4% | 1%–27% | [36] | ||
| With acquired ART resistance | 75% | 37.5%–100% | [19, 22, 25, 27] | ||
| With transmitted ART resistance | 100% | 50%–100% | [24, 27] | ||
| Disease progression | |||||
| Mortality in first year of suppressive ART | ϖH | 0.1 | 0.05–0.15 | Per year | [13, 14, 16] |
| Mortality in subsequent years of suppressive ART | ϖT | 0.05 | 0.025–0.075 | Per year | [13, 14, 16] |
| Relative to WT disease progression with acquired majority ART resistance, on or off ART | 75% | 37.5%–100% | [19, 22, 25] | ||
| Relative to WT disease progression while nonadherent to ART | 100% | 100% | |||
| Virologic failure | |||||
| WT virus failure rate during first year of ART |  |
20% | 10%–30% | Per year | [19, 30, 32] |
| WT virus failure rate during subsequent years of ART |  |
5% | 2.5%–7.5% | Per year | [19, 30] |
| DR virus failure rate during first year of ART |  |
50% | 25%–75% | Per year | [29] |
| DR virus failure rate during subsequent years of ART |  |
15% | 7.5%–22.5% | Per year | [29] |
| % failing first year ART due to NA (no acquired DR) |  |
4% | Per year | [32] | |
| % failing in subsequent years of ART due to NA (no acquired DR) |  |
2% | Per year | [32] | |
| Persistence time of transmitted ART resistance | ψR1 | 3 | 1.5–4.5 | Years | [23, 26, 33] |
| Persistence time of acquired ART resistance | ψR2 | 0.25 | 0.125–0.375 | Years | [20, 31] |
Abbreviations: ART, antiretroviral therapy; DR, drug resistance; LHS, Latin hypercube sampling; NA, nonadherence; PrEP, pre-exposure prophylaxis; WT, wild-type.
Table 2.
Model PrEP-Related Input Parameters
| Parameter | Uncertainty |
||||
|---|---|---|---|---|---|
| Symbol | Base Case | LHS Range | Unit | Reference | |
| PrEP Program | |||||
| % of individuals enrolled in PrEP (coverage) |  |
30% | 15%–45% | … | |
| % of inappropriate PrEP use among individuals with established infection | |
2.5% | … | … | |
| Initial year of PrEP deployment | 2012 | … | |||
| Time to reach target coverage | 5 | 2.5–7.5 | Years | … | |
| HIV testing frequency in PrEP program |  |
6 | 3–9 | Months | … |
| HIV testing frequency in general population |  |
1 | … | Years | … |
| Average duration of PrEP use | 1/σ | 5 | 2.5–7.5 | Years | … |
| Effects of PrEP | |||||
| Efficacy of PrEP for WT or reverted virus | ξW | 90% | 70%–99% | [1, 2] | |
| Adherence when highly/poorly adherent | θ | 95%/1% | 80%–99%/1–79% | [1] | |
| Proportion highly/poorly adherent | 88%/12% | 10%–90%/90–10% | [1] | ||
| Efficacy of PrEP against resistant virus | ξR, ξQ | 0.25 ξW | 0.125 ξW–0.375ξW | ||
| Relative infectivity while on PrEP with WT or reverted virus | 100% | 50%–100% | [2] | ||
| Relative infectivity of acquired PrEP-resistant virus, on or off PrEP | 75% | 50%–100% | [2] | ||
| Relative infectivity of transmitted PrEP- resistant virus, on or off PrEP | 100% | 50%–100% | [2, 21, 27] | ||
| Time to acquisition of PrEP resistance with WT virus in entire cohort | t1 | 0.5 | 0.25–0.75 | Years | … |
| Time to acquisition of PrEP resistance with reverted resistant virus in entire cohort | t2 | 0.5t1 | 0.25t1–0.75t1 | Years | … |
| Rate of PrEP resistance acquisition with WT virus | πW | −ln (1−0.99θ)/t1 | −ln (1−0.99θ)/t1 | Per year | … |
| Rate of PrEP resistance acquisition with reverted resistant virus | πr1, πq1 | −ln (1−0.99θ)/t2 | −ln (1−0.99θ)/t2 | Per year | … |
| Persistence time of transmitted PrEP resistance | ψQ1 | 2 | 1–3 | Years | [2, 26, 27, 33] |
| Persistence time of acquired PrEP resistance | ψQ2 | 0.125 | 0.0625–0.1875 | Years | [2] |
| Relative disease progression rates | |||||
| While on PrEP with WT infection | 100% | 50%–100% | [2] | ||
| With acquired resistance to PrEP, on or off PrEP | 75% | 50%–100% | [2] | ||
| While on PrEP with transmitted or reverted resistant infection | 100% | 50%–100% | [2, 21, 27] | ||
| With transmitted resistant virus and no ARV pressure | 100% | 50%–100% | [2, 21, 24, 27] | ||
Abbreviations: ART, antiretroviral therapy; ARV, antiretroviral; HIV, human immunodeficiency virus; LHS, Latin hypercube sampling, PrEP, pre-exposure prophylaxis; WT, wild-type.
HIV Drug Resistance
We stratify HIV-infected individuals based on their ARV status, HIV drug susceptibility, type of drug resistance, and virus population dynamics of drug-resistant HIV, including persistence and reversion of resistance [35]. The model tracks individuals infected with different viral variants over time, either untreated, on PrEP, or on ART. We do not explicitly represent different drug-resistant mutants but assume the emergence and transmission of 184V with PrEP use [1, 2, 6]; and although several different mutations may arise with ART use (such as 103N, 106M, 181C, 184V, 65R), 184V is the most common. “Transmitted resistance” may occur from a donor either on PrEP, not on PrEP, on ART, or not on ART, having a majority population of drug-resistant virus, to a recipient either on or not on PrEP. “Acquired resistance” may occur due to de novo selection on PrEP or ART in persons with wild-type infection, reemerge from archived drug-resistant variants on PrEP or ART, or persist/accumulate on ART. Upon removal of drug pressure, either by discontinuation of ART or PrEP or transmission to a recipient not on PrEP or ART, the drug-resistant virus may revert to drug-sensitive virus after a period of persistence. Prior to reversion, drug-resistant variants comprise the majority population, whereas following reversion, they become a minority population [35].
ARV Interventions, Base-Case Scenarios, and Model Analyses
We simulate 3 different rollout strategies for ARV-mediated HIV prevention—ART alone, PrEP alone (a hypothetical illustration), and ART + PrEP—and compare the epidemiological outcomes with an ARV-naive epidemic. For each strategy, we first construct and analyze a reference-case (base-case) scenario using a defined set of input parameters, including estimates of the effectiveness of ART and PrEP for prevention of HIV from the HPTN 052 clinical trial [36] and the Partners PrEP study [1], respectively; followed by uncertainty and sensitivity analyses [37].
Base-Case Analyses
ART Rollout and Effectiveness
In our model, individuals become treatment eligible at CD4 lymphocyte cell counts <200 cells/µL [11]. Treatment scale-up starts at the end of 2003 [17] and the proportion of eligible persons on ART (ie, coverage) reaches 55% by the end of 2009 [18] and 80% by the end of 2011 [11]. Coverage is then maintained at 80% throughout the simulation [11]. To represent the current situation in South Africa, we simulate 2 additional scenarios of expanded ART rollout in which treatment eligibility threshold changes at the end of 2009 to include individuals with CD4 counts between 200 and 350 cells/µL [4], reaching 66% coverage at CD4 count threshold <350 cells/µL by the end of 2011 [15]. Coverage is then: (1) maintained at the 66% level (termed status-quo coverage) or (2) increased to reach 80% at the end of 2016 [12] and maintained thereafter (termed optimized coverage). We model only first-line ART with conservative coverage to focus on the interplay between first-line ART and PrEP, assuming that access to second-line regimens [38] and drug-resistance testing [39] is limited. In base-case analyses, we assume ART reduces HIV transmission by 96% [36]. Our model represents virologic suppression and failure (with/without drug resistance), dropout, survival, and HIV transmission during the first and subsequent years of ART.
PrEP Rollout and Effectiveness
The effectiveness of PrEP against HIV acquisition is a composite of efficacy and adherence [40]. The Partners PrEP study showed the effectiveness of oral TDF + FTC PrEP to be 75% (95% confidence interval [CI], 55–87); with 90% efficacy of PrEP in those with near-perfect adherence, and only 12% of subjects having less than 80% adherence [1].
We therefore stratify individuals into 2 groups based on their level of adherence to PrEP: high or low. For base-case analyses, we assume that close to 90% of individuals have 95% adherence and about 10% have low (near zero) adherence. However, given the conflicting results from different PrEP trials (TDF + FTC was ineffective in the Fem-PrEP trial [6], and oral TDF was ineffective in the VOICE trial [7]), for uncertainty and sensitivity analyses we use a wide range of input estimates for PrEP efficacy and adherence and the proportion of individuals in the 2 (high/low) adherence groups.
PrEP (TDF + FTC) scale-up starts in 2012 and achieves 30% coverage over a 5-year period that is then maintained. We assume that PrEP is about 90% efficacious against wild-type virus [1, 2] and that the average duration of PrEP use is 5 years in susceptible individuals with HIV testing every 6 months (and PrEP discontinuation if HIV infection occurs). For the ART + PrEP strategy, in addition to our base-case scenario with overlapping drugs (ie, cross-resistance) between PrEP (TDF + FTC) and ART (TDF + FTC + NNRTI), we simulate an alternate scenario with identical model input and structural assumptions except for there being no overlap/cross-resistance between ART and PrEP.
Uncertainty Analyses
We perform uncertainty analyses to estimate the extent of variation in our projections across a broad range of input parameter estimates that include the following assumptions (Tables 1 and 2): ART effectiveness is 73%–99%; PrEP efficacy against wild-type virus is 70%–99%; PrEP adherence among individuals highly adherent is 80%–99% and among poorly adherent is 1%–79%; the proportion of individuals highly adherent is 10%–90%; PrEP coverage is 15%–45%; average duration of PrEP use is 2.5–7.5 years; the frequency of HIV testing under the PrEP program is 3–9 months; and the time by which about 100% of wild-type virus recipients acquire PrEP resistance from inappropriate PrEP use with perfect adherence is 3–9 months with the median time to acquired resistance of about 1 month [41]. We perform 50 000 simulations using Latin hypercube sampling (LHS) for each ARV-based strategy, and compute the epidemiological outcomes (median and interquartile range [IQR]) in comparison with an ARV-naive baseline epidemic. We also calculate the outcomes for the overlapping and nonoverlapping ART + PrEP strategies in comparison with ART alone as baseline.
Sensitivity Analyses
We conduct sensitivity analyses to identify those parameters that exert the greatest influence on the predicted model outcomes for each strategy. For these time-dependent multivariate analyses, we use the input and output data from our uncertainty analyses to derive standardized regression coefficients. In addition, we examine the sensitivity of the model's predictions to the modeling technique by comparative analyses of our stochastic and deterministic model simulations.
Inappropriate PrEP Use
We simulate 2 contexts of inappropriate PrEP initiation and use by previously infected individuals by extending our PrEP-alone and ART + PrEP base-case scenarios. In the first, individuals in the preseroconversion phase of acute HIV infection are started on PrEP (“window use”). In the second, individuals with undiagnosed established HIV infection start PrEP inappropriately at a rate of 2.5% per year (“general use”). The duration of inappropriate PrEP use following seroconversion is determined by the HIV testing interval assumed for the PrEP program (6 months for base-case; LHS range: 3–9 months). For general use, the duration is determined by the frequency of population surveillance (1 year for base-case).
RESULTS
Prevention of HIV Transmission
Base-Case Scenarios
Figure 1A shows the impact of different ARV-based strategies on HIV prevention after 10 years compared with an ARV-naive epidemic. ART alone is projected to prevent 20% of HIV infections (0.92 million). Similarly, PrEP alone prevents 21% (0.96 million) of HIV infections. The combined strategy of ART + PrEP is predicted to be most effective, reducing infections by 35% (>1.6 million) with overlapping regimens and 37% (>1.7 million) with nonoverlapping ARV regimens.
Figure 1.
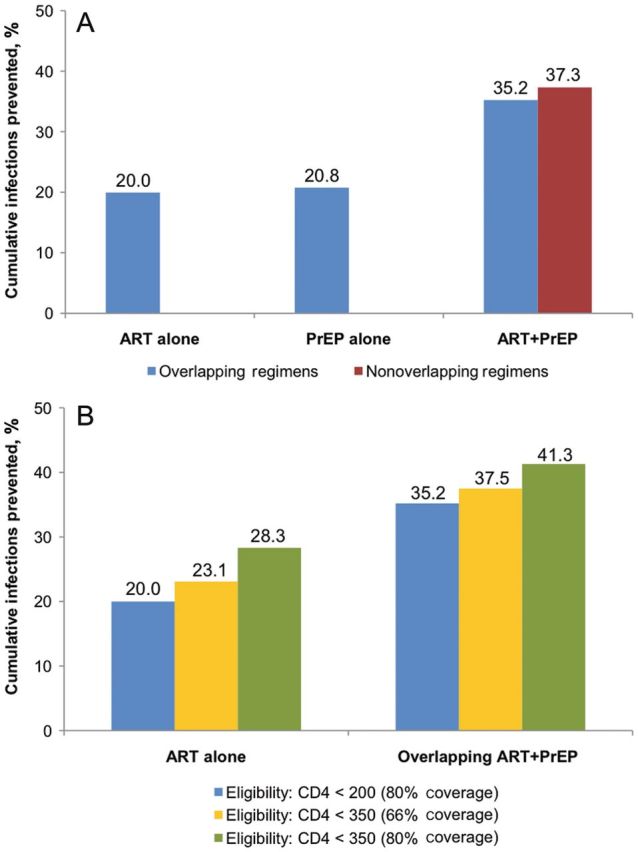
A, Cumulative new HIV infections prevented after 10 years (2012–2022) compared to a naive epidemic, assuming base-case scenarios. B, Cumulative new HIV infections prevented after 10 years (2012–2022) compared to a naive epidemic, assuming scenarios with different treatment eligibility thresholds and levels of coverage.
Abbreviations: ART, antiretroviral therapy; HIV, human immunodeficiency virus; PrEP, pre-exposure prophylaxis.
Expanded ART Rollout
The scenarios, which expand treatment rollout to include coverage at a CD4 count <350 cells/µL, result in modest increase in infections prevented when measured against the base-case scenarios of ART alone and overlapping ART + PrEP (Figure 1B). Coverage at 66% (status-quo coverage) respectively prevents 23% and 38% of infections, while 80% coverage (optimized coverage) prevents 28% and 41% of infections versus 20% and 35% for the base-case ART-alone and ART + PrEP scenarios.
Prediction Uncertainty of HIV Prevention
Figure 2A shows the results of uncertainty analyses for the 3 ARV-based strategies. The median decrease in HIV infections with ART alone after 10 years is 15% (IQR, 12%–19%), PrEP alone is 14% (IQR, 10%–18%), overlapping ART + PrEP is 27% (IQR, 22%–31%) and non-overlapping PrEP is 28% (IQR: 23%–33%).
Figure 2.
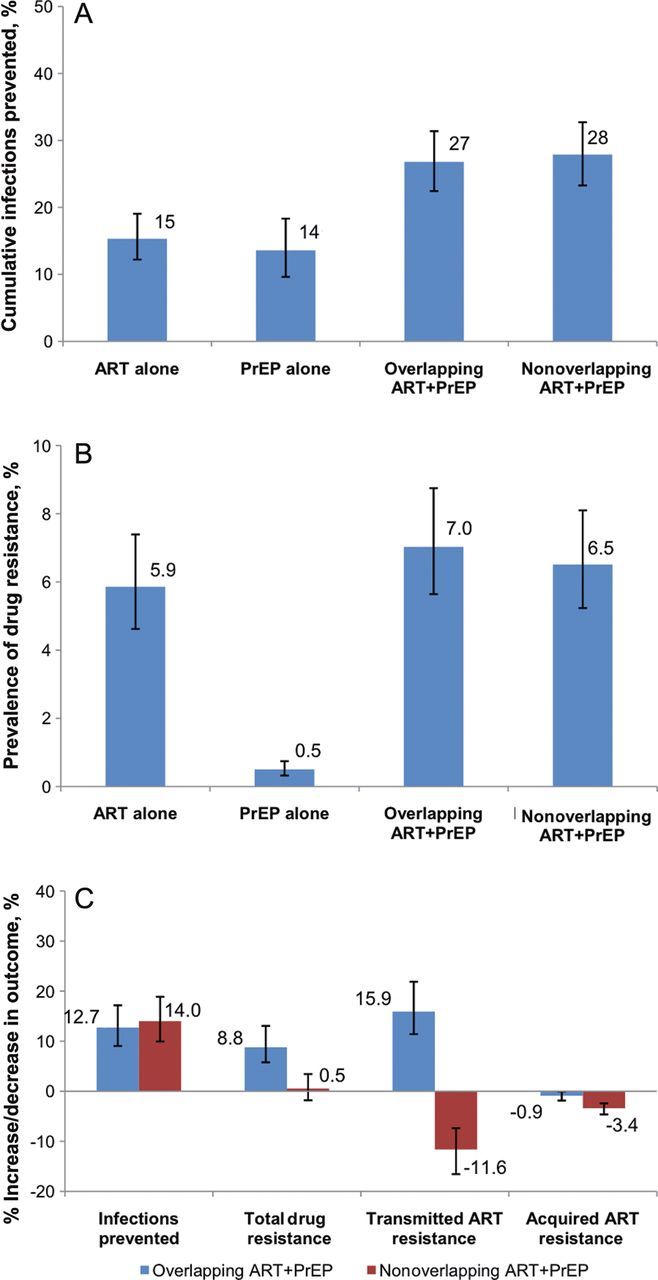
Uncertainty analyses. Results of 50 000 simulations are shown as columns representing the median values and bars representing the interquartile range. A, Cumulative new HIV infections prevented after 10 years (2012–2022), compared to a naive epidemic. B, Prevalence of drug resistance after 10 years (2012–2022). Panel C: Cumulative new HIV infections prevented and prevalence of drug resistance from ART + PrEP after 10 years (2012–2022), compared to an epidemic with ART alone.
Abbreviations: ART, antiretroviral therapy; HIV, human immunodeficiency virus; PrEP, pre-exposure prophylaxis.
Overlapping ART + PrEP (Figure 2C) prevents a median of 12.7% (IQR, 9.1%–17.2%) more infections than ART alone. Results are similar for nonoverlapping ART + PrEP (median, 14%; IQR, 10%–18.9%).
HIV Drug Resistance
Base-Case Scenarios
Figure 3A shows the impact of different ARV-based strategies on HIV drug resistance prevalence compared with an ARV-naive epidemic. After 10 years of PrEP alone, the prevalence of overall resistance is low at 0.5% (20 090 cases). Drug resistance prevalence is higher from the ART-alone strategy at 6.6% overall (307 254 cases) with 4.2% acquired (195 758 cases) and 2.4% transmitted resistance (111 497 cases). The prevalence of resistance increases further from overlapping ART + PrEP to 8.2% (339 895 cases) with the prevalence of acquired and transmitted ART resistance increasing to 4.6% and 3.3%, respectively. With nonoverlapping ART + PrEP, drug resistance prevalence falls modestly to 7.2% due to a lower prevalence of transmitted ART resistance (2.2%). In terms of the number of prevalent cases of drug resistance (data not shown), acquired ART resistance falls modestly from both overlapping and nonoverlapping ART + PrEP, when measured against ART alone; however, transmitted ART resistance rises with overlapping but falls with nonoverlapping ART + PrEP. Both acquired and transmitted cases of PrEP resistance fall from ART + PrEP when measured against PrEP alone.
Figure 3.
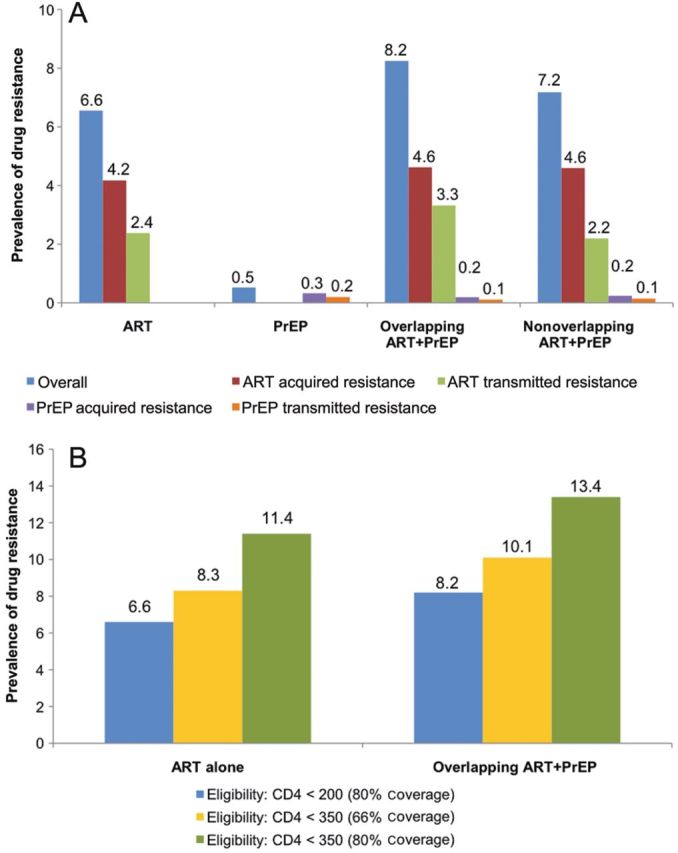
A, Prevalence of drug resistance after 10 years (2012–2022), assuming base-case scenarios. B, Prevalence of drug resistance after 10 years (2012–2022), assuming scenarios with different treatment eligibility thresholds and levels of coverage. Columns of different colors represent the prevalence of overall drug resistance and acquired and transmitted drug resistance from ART and PrEP. Abbreviations: ART, antiretroviral therapy; PrEP, pre-exposure prophylaxis.
Expanded ART Rollout
The scenarios of expanded ART rollout result in a modest increase in drug resistance prevalence when measured against the base-case scenarios of ART alone and overlapping ART + PrEP strategies (Figure 3B). Drug resistance prevalence increases to 8.3% and 10.1% in status-quo coverage scenarios and 11.4% and 13.4% in optimized coverage scenarios, versus 6.6% and 8.2% in the base-case scenarios of ART alone and ART + PrEP, respectively.
Ratio of Cumulative Infections Prevented to Prevalent and Incident Drug-Resistant Cases
To compare the resistance consequences of different ARV-based strategies, we calculated ratios of cumulative infections prevented to resistance over 10 years, either defined as prevalent cases (prevailing cases with majority drug-resistant variants; Figure 4A) or incident (new cases of transmitted or acquired drug resistance; Figure 4B). PrEP alone prevents about 48 infections for each prevalent drug-resistant case and more than 5 infections for each incident drug-resistant case. Inappropriate window-use in the PrEP-alone strategy decreases these ratios modestly to 46 and 4.8, respectively. By contrast, inappropriate general-use PrEP markedly reduces the ratios to 10 and 1, respectively. ART alone prevents about 7 infections for each prevalent drug-resistant case and about 1 infection for each incident drug-resistant case, which is 6- to 7-fold lower than for PrEP. The prevention-resistance ratios for prevalent and incident cases are 9.8 and 1.4, respectively, for overlapping ART + PrEP, and 14.7 and 1.7, respectively, for nonoverlapping ART + PrEP.
Figure 4.
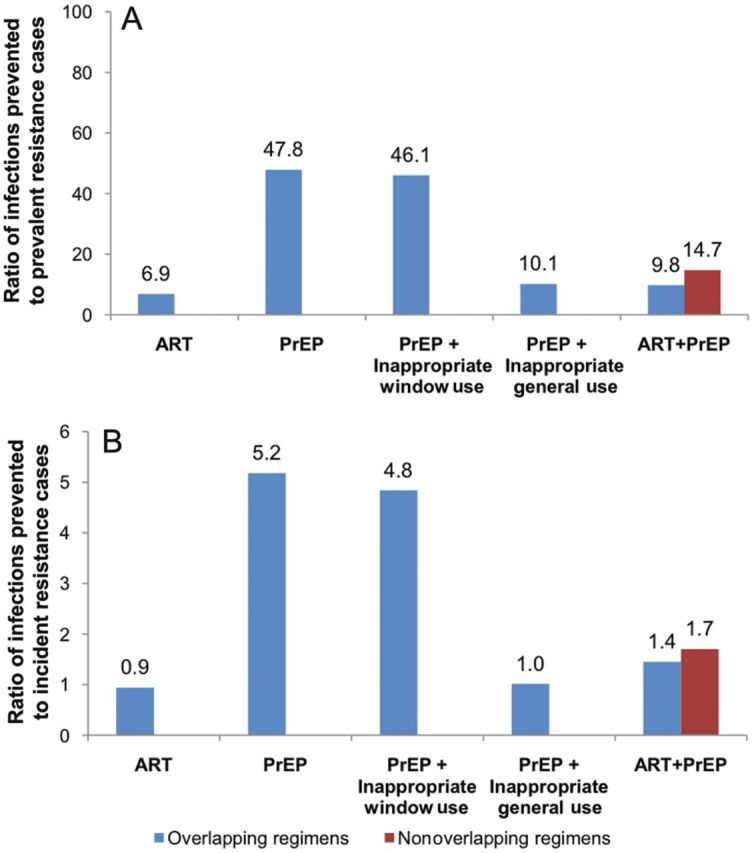
A, Ratio of cumulative infections prevented to prevalent drug-resistant cases (2012–2022). B, Ratio of cumulative infections prevented to incident drug-resistant cases (2012–2022). Window use refers to inappropriate PrEP initiation by persons in the preseroconversion phase of acute HIV. General use refers to inappropriate PrEP initiation by persons with established HIV infection at a per capita rate of 2.5%/year. Abbreviations: ART, antiretroviral therapy; HIV, human immunodeficiency virus; PrEP, pre-exposure prophylaxis.
Prediction Uncertainty of HIV Drug Resistance
Figure 2B shows the results of uncertainty analyses for HIV drug resistance outcomes from different ARV-based strategies. After 10 years, the median overall prevalence of drug resistance from ART alone is 5.9% (IQR, 4.6%–7.4%), from PrEP alone is 0.5% (IQR, 0.3%–0.7%), from overlapping ART + PrEP is 7% (IQR, 5.6%–8.8%), and from nonoverlapping ART + PrEP is 6.5% (IQR, 5.2%–8.1%). These finding are consistent with our base-case scenarios.
Overlapping ART + PrEP compared to ART alone (Figure 2C), increases the number of prevalent overall and transmitted ART-resistant cases after 10 years by a median 8.8% (IQR, 5.8%–13.1%) and 15.9% (IQR, 11.4%–21.9%), respectively, while modestly decreasing the number of acquired ART-resistant cases (median, −0.9%; IQR, −1.8% to 0%). Nonoverlapping ART + PrEP decreases the overall drug resistance prevalence at 20 years (median, −4%; IQR, −7.5% to −0.7%).
Inappropriate PrEP Use
Inappropriate PrEP use by persons infected at baseline increases HIV drug resistance from PrEP. When measured against the overlapping ART + PrEP base-case, an overlapping ART + PrEP strategy that includes inappropriate window-use PrEP prevents almost the same number of infections (1.63 million), with a modest increase (8.3% vs 8.2%) in the prevalence of resistance (data not shown). In contrast, overlapping ART + PrEP with inappropriate general-use PrEP leads to an increase in the overall resistance prevalence from 8.2% to over 10%, with acquired PrEP resistance rising to 1.3% from 0.2% and transmitted PrEP resistance to 0.4% from 0.1% (data not shown). Nonoverlapping ART + PrEP with inappropriate general-use PrEP raises the overall resistance prevalence to 8.5% (data not shown).
Sensitivity Analyses
The results of the sensitivity analyses are described in detail in Supplementary Text S1 and summarized in Table 3.
Table 3.
Sensitivity Analysis of Outcomes With ARV Strategies Versus Naive Epidemic at 2022a
| Model Inputb | Standardized Regression Coefficients (%
variance explained)c |
||
|---|---|---|---|
| ART Alone | PrEP Alone | ART + PrEP | |
| Infections prevented (%) | |||
| Reduction in WT infectivity on ART | 0.70 (0.49) | … | 0.47 (0.22) |
| ART coverage | 0.59 (0.35) | … | 0.37 (0.14) |
| Relative infectivity of virus with acquired ART resistance | −0.24 (0.06) | … | |
| PrEP coverage | … | 0.67 (0.45) | 0.50 (0.25) |
| PrEP proportion highly adherent | … | 0.45 (0.20) | 0.33 (0.11) |
| PrEP adherence (low) | … | 0.40 (0.16) | 0.30 (0.09) |
| PrEP efficacy against WT virus | … | 0.29 (0.08) | … |
| Prevalence of overall drug resistance (%)d | |||
| Survival time on ART with acquired resistance | 0.57 (0.32) | … | 0.56 (0.31) |
| ART coverage | 0.46 (0.22) | … | 0.44 (0.19) |
| WT virologic failure rate during first year on ART | 0.36 (0.13) | … | 0.34 (0.11) |
| WT virologic failure rate during subsequent years on ART | 0.31 (0.09) | … | 0.30 (0.09) |
| % failing subsequent years on ART due to nonadherence | −0.25 (0.06) | … | −0.25 (0.06) |
| Persistence of transmitted ART resistance | 0.23 (0.06) | … | 0.25 (0.06) |
| PrEP coverage | … | 0.55 (0.30) | … |
| Frequency of HIV testing | … | −0.50 (0.25) | … |
| PrEP adherence (low) | … | 0.30 (0.09) | … |
| PrEP efficacy against WT virus | … | −0.26 (0.07) | … |
| Development time for acquired PrEP resistance | … | −0.25 (0.06) | … |
| Prevalence of transmitted ART resistance (%) | |||
| Persistence of transmitted ART resistance | 0.57 (0.32) | … | 0.55 (0.30) |
| Relative infectivity of virus with acquired ART resistance | 0.45 (0.20) | … | 0.46 (0.21) |
| Survival time on ART with acquired resistance | 0.35 (0.12) | … | 0.35 (0.12) |
| ART coverage | 0.30 (0.09) | … | 0.29 (0.08) |
| WT virologic failure rate during first yr on ART | 0.25 (0.06) | … | 0.24 (0.06) |
| Prevalence of acquired ART resistance (%) | |||
| Survival time on ART with acquired resistance | 0.61 (0.38) | … | 0.62 (0.39) |
| ART coverage | 0.49 (0.24) | … | 0.49 (0.24) |
| WT virologic failure rate during first year on ART | 0.37 (0.14) | … | 0.35 (0.12) |
| WT virologic failure rate during subsequent years on ART | 0.32 (0.10) | … | 0.32 (0.10) |
| % failing subsequent years on ART due to nonadherence | −0.26 (0.07) | … | −0.26 (0.07) |
| Prevalence of transmitted PrEP resistance (%) | |||
| PrEP coverage | … | 0.51 (0.26) | 0.48 (0.23) |
| Persistence of transmitted PrEP resistance | … | 0.39 (0.15) | 0.39 (0.15) |
| Frequency of HIV testing | … | −0.29 (0.09) | −0.30 (0.09) |
| PrEP adherence (low) | … | 0.29 (0.09) | 0.28 (0.08) |
| Development time for acquired PrEP resistance | … | −0.24 (0.06) | −0.25 (0.06) |
| Prevalence of acquired PrEP resistance (%) | |||
| Frequency of HIV Testing | … | −0.56 (0.32) | −0.56 (0.31) |
| PrEP coverage | … | 0.52 (0.27) | 0.50 (0.25) |
| PrEP adherence (low) | … | 0.28 (0.08) | 0.27 (0.07) |
| PrEP efficacy against WT virus | … | −0.28 (0.08) | −0.29 (0.08) |
| Development time for acquired PrEP resistance | … | −0.24 (0.06) | −0.24 (0.06) |
Abbreviations: ART, antiretroviral therapy; HIV, human immunodeficiency virus; PrEP, pre-exposure prophylaxis; SRC, standardized regression coefficient; WT, wild-type.
a The results of sensitivity analyses are described in the Supplementary Text S1. Briefly, the principal determinants of infections prevented by PrEP alone and/or ART + PrEP include PrEP coverage, reduction in WT viral infectivity by ART, the proportion of persons highly adherent to PrEP, and the level of PrEP adherence. Drug resistance prevalence from ART alone and ART + PrEP is most influenced by the duration of survival on ART with acquired ART resistance and the WT virologic failure rate during the first year of ART. PrEP coverage and the frequency of HIV testing are the key determinants of drug resistance from PrEP.
b Parameters that contribute 5% or more of the variance in the model outcome are shown (SRC2 ≥ 0.05). The reported coefficients were significant (P ≤ .05).
c Percentage of the variance in the predicted outcome explained by the regression model. The respective R2 values were 0.93 (cumulative infections prevented), 0.94 (overall prevalence of resistance), 0.90 (prevalence of transmitted ART resistance), 0.95 (prevalence of acquired ART resistance), 0.79 (prevalence of transmitted PrEP resistance), and 0.81 (prevalence of acquired PrEP resistance) for ART + PrEP scenario.
d Proportion of cases with drug-resistant infection in the infected population.
DISCUSSION
The important insights derived from our study are several. First, an ART strategy of treatment initiation at a CD4 count <200 cells/µL combined with PrEP prevents more infections than either ART alone or PrEP alone; however, the incremental benefit of PrEP critically depends on PrEP efficacy, adherence, and coverage. Second, the prevalence of HIV drug resistance is largely driven by ART in both ART alone and ART + PrEP strategies. Third, PrEP alone results in low prevalence of drug resistance; high PrEP adherence leads to fewer infections and less opportunity for acquired resistance, while low adherence leads to predominantly wild-type breakthrough infections because of low drug pressure for emergence of acquired resistance. Fourth, use of overlapping ARVs for both ART and PrEP could increase drug-resistance prevalence compared to ART alone due to more frequent transmitted resistance. By contrast, resistance prevalence falls with non-overlapping ART + PrEP; however, this decrease is modest because the principal driver of resistance is ART, not PrEP. Fifth, inappropriate PrEP initiation among individuals with undetectable HIV infection produces only a minor increase in the overall resistance prevalence; however, inappropriate PrEP use among persons with established HIV infection could significantly increase drug resistance from PrEP. Lastly, PrEP prevents many more infections per case of resistance than ART does.
The extent of coverage and the degree of effectiveness against HIV transmission are the principal determinants of the infections prevented with ART. Similarly, PrEP coverage and effectiveness against HIV acquisition are the key determinants of the additional preventive benefit of ART + PrEP. The paradigm of test and treat [42] has gained considerable momentum, and the HPTN 052 trial [36] has provided the needed proof of concept for ART-based prevention, though its population-level impact may be limited by potential reluctance of asymptomatic HIV-infected persons for ART initiation. Notwithstanding scale-up efforts, there is considerable unmet need for ART in resource-constrained settings; about 60% of those eligible did not have access to ART at the end of 2010 [43]. Moreover, the population-level effect of treatment as prevention could be limited by the actual proportion of infected individuals optimally and durably suppressed on ART. In 2010, of the 1.2 million infected persons in the United States, 80% were aware of their status, but 41% were retained in care, and only 28% had virologic suppression [44]. The situation is much worse in sub–Saharan Africa, where about two-thirds of HIV-infected persons are unaware of their seropositive status [45]. In a systematic review [46], fewer than one-third of HIV-positive persons were retained in care between HIV testing and ART initiation. Furthermore, studies show high rates of loss to follow-up among patients starting ART [16]. Thus, PrEP could play an important additional role in controlling the HIV pandemic. Prioritized coverage with effective PrEP of individuals at highest risk of HIV acquisition and spread could potentially yield the optimal public health and cost benefits [40]. ART rollout is also limited by infrequent [18] access to second-line regimens and CD4 cell count, rather than virological monitoring [4]. As a result, there are high levels of drug resistance mutations among individuals with prolonged virological failure [22, 32], which may compromise both first-line [29, 47] and the limited second-line [48] ART regimens available. Our model shows that ART drives the prevalence of HIV drug resistance in both ART alone and ART + PrEP strategies. The principal determinants of the prevalence of acquired resistance include ART coverage, survival on ART with acquired resistance, and the rate of treatment failure. For the prevalence of transmitted resistance, determinants include the infectiousness of persons with acquired ART resistance and the persistence time of transmitted resistance. We find that PrEP is about 6- to 7-fold more efficient in HIV prevention than ART in terms of ratios of infections prevented to incident/prevalent drug-resistant cases generated. Thus, improving the effectiveness of first- and second-line ART is critical for preventing HIV infection and controlling drug resistance.
Our model projects a low prevalence of drug resistance from PrEP. Highly effective PrEP results in few breakthrough infections and a chance for emergence of acquired resistance. By contrast, poorly effective PrEP fails to protect from acquisition of wild-type HIV but also fails to exert selective pressure for emergence of acquired resistance. Both of these phenomena have been observed in recent PrEP trials [1, 2]. However, drug resistance from PrEP at the population level could rise with inappropriate PrEP use among those with undiagnosed HIV infection. While this increase is modest from inappropriate PrEP use during the preseroconversion phase of acute infection, it becomes more pronounced with inappropriate use among persons with established HIV. The latter may be of concern in potential situations of unsupervised PrEP use (eg, black-market drugs and drug sharing [49]) or inaccurate HIV testing [50].
There are some important limitations of our model. The accuracy of our predictions will be affected by variations in the model structure and sexual activity details, for which data are very limited. We therefore employed a well-established template of sexual behavior [40] with robust epidemiological and demographic parameterization, broadly applicable to South Africa. Nevertheless, the HIV epidemic in South Africa is heterogeneous and incompletely understood, with significant differences between the demographic and HIV/AIDS epidemiological estimates predicted by different agencies. HIV incidence is also not precisely known, even when measured directly at the population level. Although there is uncertainty regarding ARV-related parameters, we employed ranges (within plausible bounds) and performed extensive sensitivity and uncertainty analyses. We excluded population stratification by age and analysis of prioritized ARV implementation, as this was addressed in previous work [40]. Because of limited access to both second-line regimens [38] and drug-resistance testing [39] in resource-limited settings, we chose not to represent specific drug resistance mutations or second- or third-line ART regimens, nor do we consider HIV subtype polymorphism. We also did not explicitly include other influences on transmission. These and other refinements will be included in future work, although including such parameters greatly increases model complexity.
A key conclusion of this study is that combined ART + PrEP can have a greater public health impact than ART alone; however, overlapping ARVs for both can increase drug resistance in resource-limited settings. Drug resistance prevalence is predominantly driven by ART and not PrEP; consequently, nonoverlapping strategies will produce only modest declines in resistance. Thus, it is critical to consider the impact of ARVs not only on prevention but also drug resistance. Improved efficacy of first-line therapy and timely switching of ART to effective second-line regimens are critical for controlling HIV drug resistance. In addition, frequent and accurate HIV testing could minimize resistance consequences of PrEP. Our study also highlights that poor adherence to PrEP will undermine its potential impact on HIV prevention. Thus, prioritization of PrEP to groups at most risk of HIV acquisition and counseling about PrEP adherence are likely to maximize efficiency of PrEP and minimize drug resistance.
Supplementary Data
Supplementary materials are available at The Journal of Infectious Diseases online (http://jid.oxfordjournals.org/). Supplementary materials consist of data provided by the author that are published to benefit the reader. The posted materials are not copyedited. The contents of all supplementary data are the sole responsibility of the authors. Questions or messages regarding errors should be addressed to the author.
Notes
Financial support. This work was supported by the Bill & Melinda Gates Foundation (OPP1005974). The funders had no role in study design, data collection and analysis, decision to publish, or preparation of the manuscript.
Potential conflicts of interest. U. L. A. acknowledges grant support from the Bill and Melinda Gates Foundation (OPP1005974). J. W. M. is a member of the scientific advisory board of Gilead Sciences, has share options of RFS Pharmaceuticals, and acknowledges grant support from the AIDS Clinical Trials Group (National Institute of Allergy and Infectious Diseases [NIAID] U01AI38858), the Microbicide Trials Network (NIAID U01AI068633), the National Cancer Institute (Science Applications International Corporation [SAIC] contract 20XS190A), and the Bill and Melinda Gates Foundation (OPP1005974). All other authors report no potential conflicts.
All authors have submitted the ICMJE Form for Disclosure of Potential Conflicts of Interest. Conflicts that the editors consider relevant to the content of the manuscript have been disclosed.
References
- 1.Baeten JM, Donnell D, Ndase P, et al. Antiretroviral prophylaxis for HIV prevention in heterosexual men and women. N Engl J Med. 2012;367:399–410. doi: 10.1056/NEJMoa1108524. [DOI] [PMC free article] [PubMed] [Google Scholar]
- 2.Grant RM, Lama JR, Anderson PL, et al. Preexposure chemoprophylaxis for HIV prevention in men who have sex with men. N Engl J Med. 2010;363:2587–99. doi: 10.1056/NEJMoa1011205. [DOI] [PMC free article] [PubMed] [Google Scholar]
- 3.Thigpen MC, Kebaabetswe PM, Paxton LA, et al. Antiretroviral preexposure prophylaxis for heterosexual HIV transmission in Botswana. N Engl J Med. 2012;367:423–34. doi: 10.1056/NEJMoa1110711. [DOI] [PubMed] [Google Scholar]
- 4.World Health Organization. Antiretroviral therapy for HIV infection in adults and adolescents: recommendations for a public health approach. Geneva, Switzerland: 2010. 2010 revision. [PubMed] [Google Scholar]
- 5.Anderson RM, May RM. Infectious diseases of humans: dynamics and control. Oxford: Oxford University Press; 1991. [Google Scholar]
- 6.Van Damme L, Corneli A, Ahmed K, et al. Preexposure prophylaxis for HIV infection among African women. N Engl J Med. 2012;367:411–22. doi: 10.1056/NEJMoa1202614. [DOI] [PMC free article] [PubMed] [Google Scholar]
- 7.Marrazzo J, Ramjee G, Nair G, et al. Pre-exposure Prophylaxis for HIV in Women: Daily Oral Tenofovir, Oral Tenofovir/Emtricitabine, or Vaginal Tenofovir Gel in the VOICE Study (MTN 003) 20th Conference on Retroviruses and Opportunistic Infections; March 3-6, 2013; Atlanta, GA. [Google Scholar]
- 8.Wandel S, Egger M, Rangsin R, et al. Duration from seroconversion to eligibility for antiretroviral therapy and from ART eligibility to death in adult HIV-infected patients from low and middle-income countries: collaborative analysis of prospective studies. Sex Transm Infect. 2008;84(Suppl 1):i31–6. doi: 10.1136/sti.2008.029793. [DOI] [PMC free article] [PubMed] [Google Scholar]
- 9.Wawer MJ, Gray RH, Sewankambo NK, et al. Rates of HIV-1 transmission per coital act, by stage of HIV-1 infection, in Rakai, Uganda. J Infect Dis. 2005;191:1403–9. doi: 10.1086/429411. [DOI] [PubMed] [Google Scholar]
- 10.SACEMA. The modes of transmission of HIV in South Africa. Geneva, Switzerland: UNAIDS; 2009. [Google Scholar]
- 11.Department of Health South Africa. HIV and AIDS and STI Strategic Plan for South Africa, Pretoria. 2007–2011. 2007. [Google Scholar]
- 12.Department of Health South Africa. HIV and AIDS and STI Strategic Plan for South Africa, Pretoria. 2012–2016. 2012. [Google Scholar]
- 13.Mahy M, Lewden C, Brinkhof MW, et al. Derivation of parameters used in Spectrum for eligibility for antiretroviral therapy and survival on antiretroviral therapy. Sex Transm Infect. 2010;86(Suppl 2):ii28–34. doi: 10.1136/sti.2010.044255. [DOI] [PMC free article] [PubMed] [Google Scholar]
- 14.Nglazi MD, Lawn SD, Kaplan R, et al. Changes in programmatic outcomes during 7 years of scale-up at a community-based antiretroviral treatment service in South Africa. J Acquir Immune Defic Syndr. 2011;56:e1–8. doi: 10.1097/QAI.0b013e3181ff0bdc. [DOI] [PMC free article] [PubMed] [Google Scholar]
- 15.UNAIDS. Global report: UNAIDS report on the global AIDS epidemic 2012. 2012.
- 16.Wandeler G, Keiser O, Pfeiffer K, et al. Outcomes of antiretroviral treatment programs in rural Southern Africa. J Acquir Immune Defic Syndr. 2012;59:e9–16. doi: 10.1097/QAI.0b013e31823edb6a. [DOI] [PMC free article] [PubMed] [Google Scholar]
- 17.Department of Health South Africa. Operational plan for comprehensive HIV and AIDS care, management and treatment for South Africa, Pretoria. 2003. [Google Scholar]
- 18.World Health Organization. HIV in the WHO African Region: progress towards achieving universal access to priority health sector interventions, Geneva, Switzerland: 2011 update. 2011. [Google Scholar]
- 19.El-Khatib Z, Ekstrom AM, Ledwaba J, et al. Viremia and drug resistance among HIV-1 patients on antiretroviral treatment: a cross-sectional study in Soweto, South Africa. AIDS. 2010;24:1679–87. doi: 10.1097/QAD.0b013e32833a097b. [DOI] [PMC free article] [PubMed] [Google Scholar]
- 20.Hance AJ, Lemiale V, Izopet J, et al. Changes in human immunodeficiency virus type 1 populations after treatment interruption in patients failing antiretroviral therapy. J Virol. 2001;75:6410–7. doi: 10.1128/JVI.75.14.6410-6417.2001. [DOI] [PMC free article] [PubMed] [Google Scholar]
- 21.Harrison L, Castro H, Cane P, et al. The effect of transmitted HIV-1 drug resistance on pre-therapy viral load. AIDS. 2010;24:1917–22. doi: 10.1097/QAD.0b013e32833c1d93. [DOI] [PubMed] [Google Scholar]
- 22.Hosseinipour MC, van Oosterhout JJ, Weigel R, et al. The public health approach to identify antiretroviral therapy failure: high-level nucleoside reverse transcriptase inhibitor resistance among Malawians failing first-line antiretroviral therapy. AIDS. 2009;23:1127–34. doi: 10.1097/QAD.0b013e32832ac34e. [DOI] [PMC free article] [PubMed] [Google Scholar]
- 23.Kearney M, Maldarelli F, Shao W, et al. Human immunodeficiency virus type 1 population genetics and adaptation in newly infected individuals. J Virol. 2009;83:2715–27. doi: 10.1128/JVI.01960-08. [DOI] [PMC free article] [PubMed] [Google Scholar]
- 24.Little S. Transmission of HIV drug resistance and treatment response. Program and Abstracts of the 14th Conference on Retroviruses and Opportunistic Infections; 25–28 February; Los Angeles, CA. 2007. [Google Scholar]
- 25.Modjarrad K, Chamot E, Vermund SH. Impact of small reductions in plasma HIV RNA levels on the risk of heterosexual transmission and disease progression. AIDS. 2008;22:2179–85. doi: 10.1097/QAD.0b013e328312c756. [DOI] [PMC free article] [PubMed] [Google Scholar]
- 26.Pingen M, Nijhuis M, de Bruijn JA, Boucher CA, Wensing AM. Evolutionary pathways of transmitted drug-resistant HIV-1. J Antimicrob Chemother. 2011;66:1467–80. doi: 10.1093/jac/dkr157. [DOI] [PubMed] [Google Scholar]
- 27.Wainberg MA, Moisi D, Oliveira M, Toni TD, Brenner BG. Transmission dynamics of the M184V drug resistance mutation in primary HIV infection. J Antimicrob Chemother. 2011;66:2346–9. doi: 10.1093/jac/dkr291. [DOI] [PubMed] [Google Scholar]
- 28.Hamers RL, Wallis CL, Kityo C, et al. HIV-1 drug resistance in antiretroviral-naive individuals in sub-Saharan Africa after rollout of antiretroviral therapy: a multicentre observational study. Lancet Infect Dis. 2011;11:750–9. doi: 10.1016/S1473-3099(11)70149-9. [DOI] [PubMed] [Google Scholar]
- 29.Hamers RL, Schuurman R, Sigaloff KC, et al. Effect of pretreatment HIV-1 drug resistance on immunological, virological, and drug-resistance outcomes of first-line antiretroviral treatment in sub-Saharan Africa: a multicentre cohort study. Lancet Infect Dis. 2012;12:307–17. doi: 10.1016/S1473-3099(11)70255-9. [DOI] [PubMed] [Google Scholar]
- 30.Barth RE, van der Loeff MF, Schuurman R, Hoepelman AI, Wensing AM. Virological follow-up of adult patients in antiretroviral treatment programmes in sub–Saharan Africa: a systematic review. Lancet Infect Dis. 2010;10:155–66. doi: 10.1016/S1473-3099(09)70328-7. [DOI] [PubMed] [Google Scholar]
- 31.Deeks SG, Wrin T, Liegler T, et al. Virologic and immunologic consequences of discontinuing combination antiretroviral-drug therapy in HIV-infected patients with detectable viremia. N Engl J Med. 2001;344:472–80. doi: 10.1056/NEJM200102153440702. [DOI] [PubMed] [Google Scholar]
- 32.Gupta RK, Hill A, Sawyer AW, et al. Virological monitoring and resistance to first-line highly active antiretroviral therapy in adults infected with HIV-1 treated under WHO guidelines: a systematic review and meta-analysis. Lancet Infect Dis. 2009;9:409–17. doi: 10.1016/S1473-3099(09)70136-7. [DOI] [PubMed] [Google Scholar]
- 33.Jain V, Sucupira MC, Bacchetti P, et al. Differential persistence of transmitted HIV-1 drug resistance mutation classes. J Infect Dis. 2011;203:1174–81. doi: 10.1093/infdis/jiq167. [DOI] [PMC free article] [PubMed] [Google Scholar]
- 34.Rehle TM, Hallett TB, Shisana O, et al. A decline in new HIV infections in South Africa: estimating HIV incidence from three national HIV surveys in 2002, 2005 and 2008. PLOS One. 2010;5:e11094. doi: 10.1371/journal.pone.0011094. [DOI] [PMC free article] [PubMed] [Google Scholar]
- 35.Nowak MA, May R. Virus dynamics: mathematical principles of immunology and virology. New York: Oxford University Press; 2001. [Google Scholar]
- 36.Cohen MS, Chen YQ, McCauley M, et al. Prevention of HIV-1 infection with early antiretroviral therapy. N Engl J Med. 2011;365:493–505. doi: 10.1056/NEJMoa1105243. [DOI] [PMC free article] [PubMed] [Google Scholar]
- 37.Hofer E. Sensitivity analysis in the context of uncertainty analysis for computationally intensive models. Comput Phys Commun. 1999;117:21–34. [Google Scholar]
- 38.Long L, Fox M, Sanne I, Rosen S. The high cost of second-line antiretroviral therapy for HIV/AIDS in South Africa. AIDS. 2010;24:915–9. doi: 10.1097/QAD.0b013e3283360976. [DOI] [PubMed] [Google Scholar]
- 39.Keiser O, Chi BH, Gsponer T, et al. Outcomes of antiretroviral treatment in programmes with and without routine viral load monitoring in Southern Africa. AIDS. 2011;25:1761–9. doi: 10.1097/QAD.0b013e328349822f. [DOI] [PMC free article] [PubMed] [Google Scholar]
- 40.Abbas UL, Anderson RM, Mellors JW. Potential impact of antiretroviral chemoprophylaxis on HIV-1 transmission in resource-limited settings. PLOS ONE. 2007;2:e875. doi: 10.1371/journal.pone.0000875. [DOI] [PMC free article] [PubMed] [Google Scholar]
- 41.Miller DK, Homan SM. Determining transition probabilities: confusion and suggestions. Med Decis Making. 1994;14:52–8. doi: 10.1177/0272989X9401400107. [DOI] [PubMed] [Google Scholar]
- 42.Granich RM, Gilks CF, Dye C, De Cock KM, Williams BG. Universal voluntary HIV testing with immediate antiretroviral therapy as a strategy for elimination of HIV transmission: a mathematical model. Lancet. 2009;373:48–57. doi: 10.1016/S0140-6736(08)61697-9. [DOI] [PubMed] [Google Scholar]
- 43.UNAIDS. AIDS at 30: Nations at the crossroads. 2011. [Google Scholar]
- 44.Vital signs: HIV prevention through care and treatment—United States. MMWR Morb Mortal Wkly Rep. 2011;60:1618–23. [PubMed] [Google Scholar]
- 45.World Health Organization. Towards universal access: Scaling up priority HIV/AIDS interventions in the health sector. 2010. Geneva, WHO. [Google Scholar]
- 46.Rosen S, Fox MP. Retention in HIV care between testing and treatment in sub-Saharan Africa: a systematic review. PLOS Med. 2011;8:e1001056. doi: 10.1371/journal.pmed.1001056. [DOI] [PMC free article] [PubMed] [Google Scholar]
- 47.Gupta RK, Jordan MR, Sultan BJ, et al. Global trends in antiretroviral resistance in treatment-naive individuals with HIV after rollout of antiretroviral treatment in resource-limited settings: a global collaborative study and meta-regression analysis. Lancet. 2012;380:1250–8. doi: 10.1016/S0140-6736(12)61038-1. [DOI] [PMC free article] [PubMed] [Google Scholar]
- 48.Hamers RL, Sigaloff KC, Wensing AM, et al. Patterns of HIV-1 drug resistance after first-line antiretroviral therapy (ART) failure in 6 sub–Saharan African countries: implications for second-line ART strategies. Clin Infect Dis. 2012;54:1660–9. doi: 10.1093/cid/cis254. [DOI] [PubMed] [Google Scholar]
- 49.Inciardi JA, Surratt HL, Kurtz SP, Cicero TJ. Mechanisms of prescription drug diversion among drug-involved club- and street-based populations. Pain Med. 2007;8:171–83. doi: 10.1111/j.1526-4637.2006.00255.x. [DOI] [PMC free article] [PubMed] [Google Scholar]
- 50.Wolpaw BJ, Mathews C, Chopra M, et al. The failure of routine rapid HIV testing: a case study of improving low sensitivity in the field. BMC Health Serv Res. 2010;10:73. doi: 10.1186/1472-6963-10-73. [DOI] [PMC free article] [PubMed] [Google Scholar]
Associated Data
This section collects any data citations, data availability statements, or supplementary materials included in this article.