

Abstract
The rise of zebrafish as a neuroscience research model organism, in conjunction with recent progress in single-cell resolution whole-brain imaging of larval zebrafish, opens a new window of opportunity for research on interval timing. In this article, we review zebrafish neuroanatomy and neuromodulatory systems, with particular focus on identifying homologies between the zebrafish forebrain and the mammalian forebrain. The neuroanatomical and neurochemical basis of interval timing is summarized with emphasis on the potential of using zebrafish to reveal the neural circuits for interval timing. The behavioural repertoire of larval zebrafish is reviewed and we demonstrate that larval zebrafish are capable of expecting a stimulus at a precise time point with minimal training. In conclusion, we propose that interval timing research using zebrafish and whole-brain calcium imaging at single-cell resolution will contribute to our understanding of how timing and time perception originate in the vertebrate brain from the level of single cells to circuits.
Keywords: interval timing, corticostriatal circuits, habenula, two-photon microscopy, anticipatory response
1. Introduction
The ability to gauge the passage of time in the seconds-to-minutes range, defined as interval timing, is fundamental to vertebrate behaviour and cognition, but the underlying neural mechanisms at the circuit level remain elusive. Zebrafish (Danio rerio) offer great potential for studies of timing because of recent progress in neuroimaging techniques. Specifically, it is now possible to monitor neural activity in the entire brain at single-cell resolution by using calcium imaging in larval zebrafish [1,2]. This provides an unprecedented opportunity to investigate the relationship between brain, behaviour and cognition. In particular, whole-brain calcium imaging is especially suitable for studying functions that require cooperation among multiple brain regions. Interval timing is one such cognitive function because it involves cortico-striatal circuits [3]. To facilitate future interval-timing studies from molecular to cellular and circuit levels, we review zebrafish forebrain anatomy, neuromodulatory systems and behavioural repertoire. Calcium imaging data showing stimulus expectation that arises from presentation of temporally patterned stimuli are also presented to demonstrate that imaging the entire brain of a larval zebrafish opens a new window on how time perception is instantiated in the vertebrate brain.
2. Zebrafish forebrain neuroanatomy
Most cognitive functions rely on the forebrain, which comprises the telencephalon (cortical and sub-cortical regions in mammals; pallium and subpallium in fish) and the diencephalon (including the thalamus, pineal body and habenula). While this basic forebrain organization is conserved across vertebrates (figure 1a) [8], it is still uncertain whether the fish telencephalon contains a region that is functionally equivalent to the mammalian neocortex. One recent study implicated the dorsal part of the pallium as a functional homologue [9], but additional studies are required. Hence, here we only consider non-neocortical regions in the forebrain that have defined cognitive functions in mammals, interval timing in particular, and compare each region with its counterpart(s) in fish.
Figure 1.
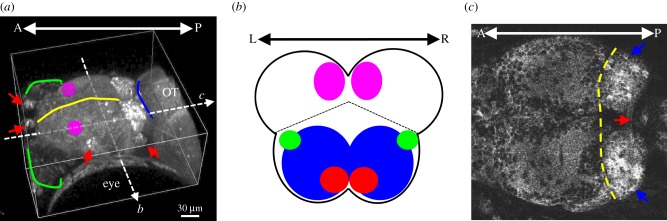
Anatomical structures of zebrafish forebrain. (a) Lateral view of a zebrafish forebrain that includes the telencephalon, in which the yellow line indicates the extent and divides this structure into two hemispheres, and the diencephalon, in which the blue line indicates the boundary between this structure and the optic tectum (OT) in the midbrain. The green line indicates the olfactory epithelium. The red arrows indicate the lateral line organ. The ADP (magenta area) is proposed to be the homologue of mammalian hippocampus [4]. (b) Coronal section (from the white dashed arrow b in a) of the telencephalon. The dashed line separates the dorsal telencephalon (pallium) and ventral telencephalon (subpallium, blue). Subpallium includes the potential homologue of mammalian BG based on GAD67-mRNA labelling [5]. The EN (green) is the homologue of the globus pallidus internal segment [4]. The dorsal medial pallium (magenta) is the homologue of mammalian basolateral/lateral amygdala, whereas the ventral subpallium (red) is presumably the homologue of mammalian central amygdala [6]. (c) Transverse section of the forebrain region (from the white dashed arrow c in a), in which the telencephalon and the habenula (blue arrows) are separated by the yellow dashed line. The red arrow indicates the habenula commissure that connects the two habenula. This 8-day old fish is a triple transgenic Nacre zebrafish, carrying the HuC:Gal4 pan-neural driver, GAL4s1011t driver and the fluorescent calcium indicator GCaMP3 under the UAS promoter [7]. Scale bar, 30 µm.
(a). Zebrafish homologues of basal ganglia: the subpallium
The mammalian basal ganglia (BG) include the striatum, globus pallidus, subthalamic nucleus and substantia nigra pars reticulata. A major characteristic of the BG is its dense populations of GABAergic medium spiny neurons (MSNs), which contain glutamate decarboxylase (GAD), an enzyme that helps to convert glutamate into GABA. Thus, one method for identifying the BG homologues in zebrafish, in addition to determining connectivity or immunohistochemical labelling and in situ hybridization [9,10], is to locate GAD67-mRNA-rich regions in the brain. Indeed, GAD67 is expressed in all subpallial regions in zebrafish (figure 1b) [5]. In particular, the entopeduncular nucleus (EN) has been identified as equivalent to the mammalian globus pallidus internal segment (GPi), which gives rise to the BG output to the thalamus and habenula [4,11]. In rodents, primates and humans, the dorsal striatum is essential for time keeping [12–14]. One current biological model of interval timing—the striatal beat frequency model—posits that cortico-striatal circuits are critical for time perception [15,16]. In this model, the striatal MSNs serve as coincidence detectors that discriminate different cortical input patterns to quantify the passage of time [17]. Given that thousands of cortical inputs project to individual striatal MSNs [18], how multi-region connections between such large numbers of participating neurons give rise to timing is currently unobservable in mammals owing to the limited number of neurons that can be recorded simultaneously using traditional electrophysiological techniques. In zebrafish, it is possible to observe all brain neurons simultaneously [1,2], and therefore we can monitor both the pallium and the subpallium concurrently to reveal the functional microcircuits for interval timing.
(b). Hippocampus and amygdala: the pallium
The zebrafish homologue of the mammalian hippocampus appears to be the anterodorsolateral pallium (ADP, figure 1a), because this region displays high spontaneous neural activity embedded with fast ripple oscillations (above 100 Hz) in the adult zebrafish brain [4]. The fish lateral pallium is also involved in trace conditioning, which is a hippocampal-dependent task in mammals [19]. Nevertheless, more anatomical pieces of evidence are needed to justify that the fish ADP is a hippocampus homologue, such as whether there are subfields (like CA1, CA3) in fish ADP with unique intrinsic connections, just to name one. The involvement of the hippocampus in interval timing is implied by rodent data showing that the remembered criterion time is persistently shorter (or earlier) than the actual criterion time following hippocampal lesions [20,21]. In addition, the hippocampus may also participate in temporal memory consolidation [22] and in bridging temporal gaps of discontinuous episodic events [23], leading to a recent proposal that there are time cells in the hippocampus for representing the flow of time in episodic-like memories [24].
For the amygdala, a recent review suggests that the dorsomedial portion of the pallium in Actinopterygii (the ray-finned fish class that includes zebrafish, goldfish and rainbow trout) is the homologue of the basolateral/lateral amygdala [6]. The homologue of the central amygdala seems to be located in the ventral subpallium (figure 1b). In mammals, the basolateral/lateral amygdala process fear-related information, while pain processing, expression of innate behaviours and anxiety are subserved by the central amygdala [25]. For timing, a recent study shows that amygdala neurons are sensitive to temporal reward structure and display expectation/anticipatory responses to reward [26]. In addition, emotion can modulate time perception, as demonstrated in rodent and human studies [27,28], but where and how this modulation occurs at the circuit level is currently unknown.
(c). Habenula: the dorsal diencephalon
The habenula (figure 1c) is an evolutionarily conserved structure in vertebrates [29]. It comprises two sub-nuclei—medial and lateral in mammals and dorsal and ventral in zebrafish [30], and each sub-nucleus has its own distinct input and output connections. The medial habenula (using mammalian nomenclature) receives inputs from the forebrain limbic circuits, such as the posterior septum, and projects to the interpeduncular nucleus (IPN), and the IPN further projects to the raphe nucleus and periaqueductal grey in the brainstem. The lateral habenula receives inputs from the BG (GPi) and projects to the midbrain ventral tegmental area, the locus coeruleus (LC), and the rostromedial tegmental nucleus [31–33]. Reflecting these complex connections, the proposed functions of the habenula are diverse and include value-based decision-making [34], anticipation of future events [35] and emotional regulation [36–38]. Although the habenula, especially the lateral habenula, is downstream of the BG and upstream of midbrain dopamine areas, both of which are critical for interval timing [3], it appears to be an overlooked brain region with respect to timing studies.
3. Zebrafish neuromodulatory systems
(a). Dopamine
Dopamine neurons project from midbrain to forebrain regions, such as the cortex (mesocortical) and the striatum (mesostriatal) in mammals. Psychoactive drugs that alter dopamine neurotransmission can also change the perception of time [39] in a manner that can be characterized as a change in the speed of a hypothetical internal clock. That is, immediately following systemic injections of dopaminergic agonists, the speed of the internal clock is relatively faster, thus leading to the experience of a longer subjective time for a given objective time [40]. In contrast, when synaptic dopamine levels are low, the speed of the internal clock is relatively slower and time seems to drag [41]. The presence of tyrosine hydroxylase (TH), a rate-limiting enzyme, which catalyses the transformation of l-tyrosine to the dopamine precursor l-DOPA, can be used to identify catecholamine neurons in zebrafish. Because TH is expressed in both dopaminergic and noradrenergic neurons, it is not a conclusive marker for dopaminergic neurons. A secondary marker is required to clearly distinguish dopamine- and norepinephrine (NE)-releasing neurons in the zebrafish brain. That said, recent labelling studies revealed that the olfactory bulb, subpallium and ventral diencephalon express TH genes (figure 2, red areas) [42]. In addition, zebrafish have paralogous TH genes (TH1 and TH2), two genes that code for similar proteins, while mammals only have one TH gene [43,44]. The functional differences, if any, between TH1- and TH2-expressing neurons remain to be determined as some neurons express one TH gene only while others express both. In larval zebrafish, the developing putative dopamine regions start functioning 3–4 days post fertilization (dpf), immediately after hatching [47]. Indeed, altering dopamine neurotransmission by exposure to D1 or D2 receptor agonists/antagonists affects locomotion in 5-dpf zebrafish [48]. In addition, it is interesting to note that the TH1-expressing region in the subpallium is near the border between the ventral pallium and dorsal subpallium that stretches from anterior to posterior into an elongated striped area (figure 2, the red area below the dashed line) [43]. Although the function of this striped area remains to be determined, it is possible that it is the equivalent of the mammalian dorsal striatum.
Figure 2.
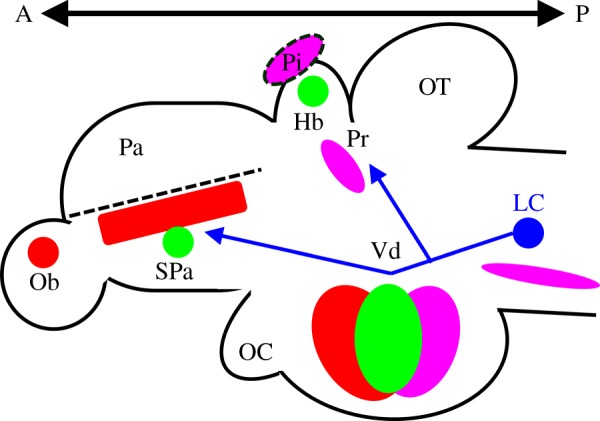
Schematic diagram of zebrafish neuromodulatory systems in a sagittal view of the brain. Dopamine: the red areas indicate potential dopaminergic regions in the olfactory bulb, subpallium and many regions in the ventral diencephalon based on expression of TH genes and secondary markers [42–44]. The dashed line, which is right above the TH1-expressing subpallial region, separates the pallium and subpallium. Acetylcholine: the green areas show the ChAT-positive regions in the habenula, subpallium and sparsely in the ventral diencephalon [45]. Norepinephrine: the blue area indicates the NE containing cell bodies of the LC. The blue lines indicate its projections to the forebrain regions, such as the subpallium, pretectum and ventral diencephalon [42]. Serotonin: the magenta areas indicate the 5-HT cell body regions in the ventral diencephalon, raphe nucleus (below LC), pretectum and the pineal (between and above Hb) [46]. Note that we have not labelled individual subregions in the ventral diencephalon for dopamine (red), ACh (green) and 5-HT (magenta), because this is beyond the scope of the current review. Thus, the colour ellipsoids in the ventral diencephalon overlap. Hb, habenula; LC, locus coeruleus; Ob, olfactory bulbs; OC, optic chiasm; OT, optic tectum; Pa, pallium; Pi, pineal body; Pr, pretectum; SPa, subpallium; Vd, ventral diencephalon.
(b). Acetylcholine
The neuromodulator acetylcholine (ACh) is also involved in mammalian interval timing. The effects on interval timing of modifying ACh levels are quite different from the effects of dopamine manipulations. In rodent studies, increasing ACh activity by systemic injection of centrally active cholinergic agonists gradually changes timing performance, as if the remembered target duration is shorter, while decreasing brain ACh activity level leads to the opposite pattern [49]. Unlike the dopamine clock effect described above, the ACh memory effect develops across several sessions of chronic drug injection, suggesting that it is probably related to how temporal memory is consolidated after each training session and how the remembered temporal content is retrieved under the influence of chronic cholinergic drug injections [50]. In zebrafish, immunohistochemical labelling of choline acetyltransferase (ChAT, an ACh synthesis enzyme) indicates that there are several ChAT-positive areas in the adult forebrain [45]. These include the subpallium and medial habenula, as well as some distributed regions in the ventral diencephalon (figure 2, green areas). The ChAT-positive neurons in the subpallium may be equivalent to the septal cholinergic neurons in the mammalian basal forebrain, especially the nucleus basalis of Meynert (NBM) [45]. In mammals, this region is rich in ACh and projects to the neocortex [51]. Lesioning the NBM in rats reduces brain ACh activity and leads to longer remembered durations [52]. In the timing literature, systemic injection of nicotine has been shown to increase the speed of the internal clock in rats [53], possibly through its interaction with dopamine systems, an interaction recently shown in zebrafish [54]. Notably, a recent study shows that cholinergic neurons in the rodent medial habenula display spontaneous pacemaking activity at a frequency of 2–10 Hz, a range that can be increased by exposure to nicotine in vitro [55]. Whether this spontaneous pacemaking activity is related to any aspect of interval timing remains to be determined.
(c). Norepinephrine and serotonin
Two other major neuromodulators, NE and serotonin (5-HT), that might be related to timing, are also present in zebrafish [56]. In brief, zebrafish NE is synthesized in the LC, which lies in the metencephalon (part of the brain stem) and projects to the dorsal diencephalon (e.g. pretectum) and ventral telencephalon (subpallium) in its ascending pathway by 3 dpf (figure 2, blue area and its projections) [42]. In human studies, blocking NE reuptake with reboxetine (leading to more NE activity at the synapse) improved the subject's performance in a temporal discrimination task [57]. The effects of NE on timing behaviours are usually attributed to working memory and attention [58].
Regarding 5-HT, a recent study suggests that in zebrafish there are 5-HT-containing neurons in the pineal, pretectum, hypothalamus and raphe nucleus in the hindbrain (figure 2, magenta areas) [46]. In addition, numerous 5-HT projections are present in the dorsolateral and dorsomedial pallium as well as the ventral subpallium. These areas may correspond to the mammalian hippocampus and amygdala as shown in figure 1b [6]. Accordingly, we can infer that 5-HT in zebrafish may also participate in the functions of the hippocampus and amygdala, such as memory and emotion. A recent study using calcium imaging shows that neural activity in the dorsal raphe can modulate how visual information is processed when a 5–7-dpf zebrafish larva is in a heightened emotional state [59]. Different emotional states may affect information processing and therefore distort the perception of time [28].
4. Behaviour and cognition in larval zebrafish
Given the potential for using zebrafish to investigate the neural circuits underlying interval timing, it is important to develop appropriate behavioural assays. Furthermore, to directly observe brain activity change as a function of training, the behavioural training in zebrafish should be completed during the larval stage, a time window during which the skull is absent and the brain has relatively low lipid content—two ideal factors for non-invasive in vivo calcium imaging. The larval stage of zebrafish lasts from 3 dpf to approximately 30 dpf. During this period, the brain is still growing, but most of the critical brain regions and neuromodulatory systems are already functioning. At 5–6 dpf, the yolk of the embryo is completely consumed and the fish's brain must be mature enough to support a complex repertoire of foraging-related behaviour and cognition, possibly including interval timing. Taking this into consideration, the behavioural and cognitive abilities of larval zebrafish first need to be explored. A review of the full behavioural repertoire in larval zebrafish is available elsewhere [60], so here we focus on recent studies of conditioned behaviours because animal timing work usually requires conditioning techniques. In addition, tasks that can be quickly acquired during the larval stage are of greatest interest for imaging purposes.
(a). Conditioned swimming behaviours
Timing studies using laboratory animals require the animals to be conditioned to perform a task. The conditioning task can be Pavlovian, i.e. pairing a conditioned stimulus (CS) with an unconditioned stimulus (US), or instrumental, such as requiring rodents to press a lever to obtain a reinforcer. The task can be appetitive or aversive, but most animal timing studies are based on appetitive conditioning. In fish, swimming can be conditioned, and variables such as swim speed, tail movement and location in a tank can be measured. For example, when adult goldfish were trained in a swimming task by pairing a 5 or 15 s light CS with an aversive US (an electrical shock), the fish displayed a response function (water displacement induced by fish activity) with a peak centred around the scheduled time of shock delivery following 200 training trials distributed across 20 sessions [61]. In a different CS–US aversive conditioning task, both adult [62] and larval [63] zebrafish acquired the CS–US contingency (less than 15 s) after about 10 conditioning trials. In this type of conditioning task, accurate timing is required to ensure that responses do not occur too early or too late, but are optimized.
In an escape/avoidance version of the CS–US conditioning paradigm, in which the fish could prevent US onset (avoidance) or terminate it (escape) by swimming to the non-CS side within 10 s (the CS duration), adult goldfish attained the performance criterion after 120–180 conditioning trials with 10 trials per daily session [19]. In the same study, when a 5-s temporal gap was introduced in between the 10-s CS and US (i.e. trace conditioning), adult goldfish could still attain the performance criterion after about the same amount of training. More importantly, fish that received an ablation of the dorsomedial pallium (equivalent to basolateral/lateral amygdala in mammals) after reaching the learning criterion failed to retain their performance post-operatively, in both trace and non-trace versions of the task. In contrast, fish that received an ablation of the lateral pallium, a region that may be functionally equivalent to the mammalian hippocampus, performed normally in the non-trace task, but not in the trace task. These findings suggest that the dorsomedial pallium is critical for maintaining avoidance responses in an aversive CS–US conditioning task, while the lateral pallium is responsible for keeping track of the temporal gap between the CS and US. In an appetitive CS–US trace conditioning paradigm, juvenile rainbow trout (another ray-finned fish species) learned the task with a 3.4-s trace interval after about three weeks of training [64]. In addition, in a recent appetitive Pavlovian conditioning study, adult zebrafish displayed timed conditioned responses at 4, 8 and 16-s CS–US delay conditions after one month of training (20 trials per day) [65].
Because adult zebrafish are not suitable for non-invasive whole-brain calcium imaging (other than imaging the dorsal surface of the brain after removal of the skull as shown by Aoki et al. [9]), a recent study examined the time course of conditioned learning in larval zebrafish [66]. The fish were trained in an aversive visuospatial classical conditioning task in a daily session (six trials per session) continuously from 7 to 42 dpf. Fish began showing improvement on the task when older than 21 dpf and reached the adult performance level at around 42 dpf. In an operant version of the task in the same study, five-week old fish learned the task within 36 trials (shocks), whereas a group of four-week old fish required 100 shock trials to achieve the same performance level. Fish younger than four weeks performed even worse. In conclusion, behaviourally conditioning larval zebrafish can be difficult compared with conditioning adult fish owing to developmental constraints. Thus, if one wants to conduct calcium imaging using a behavioural conditioning paradigm, one needs to optimize the task parameters to ensure that fish can acquire the task during the larval stage.
(b). Virtual environment and conditioned tail movement
Another requirement of calcium imaging is that the fish's head must be immobilized. One solution is to provide a virtual reality environment such that the visual feedback the fish receives indicates it is moving (i.e. fictive movement) [67,68]. Another approach that allows the fish to slightly ‘move’ in a way that does not disturb brain imaging is to permit tail movement, while the remaining body, especially the head, is embedded in agarose. Using this approach, one study showed that a 4-s light CS and a tactile US (that elicits unconditioned tail movement) activated different populations of neurons in the cerebellum, while only a few cerebellar neurons (2.12%) responded to both CS and US [69]. This learning can be observed in 6–8-dpf larvae within seven trials of CS–US pairing. In a similar study, Sumbre et al. [70] observed that tail movement was evoked and entrained by a strong rhythmic visual pattern, which included at least 10 cycles of repetitive stimuli and a fixed inter-stimulus interval (ISI). In addition to tail movement, it also elicited synchronized calcium transients in the tectum, a midbrain structure critical for visual information processing [71]. This rhythmic responding pattern extended beyond the offset of the visual stimulus presentation for both the tail movement and the tectal neuron response, as if the fish was following the visual stimulus rhythm after it stopped. The finding suggests that the temporal properties of external stimuli are encoded at the neuronal level and followed by the fish at the behavioural level.
5. Time-based expectation in the larval zebrafish brain
Given that a larval zebrafish as young as 4 dpf can repeat the temporal pattern of a series of visual stimuli [70], we assumed that imaging the entire forebrain under a similar condition may reveal the neural circuits involved in this type of timing. We developed a triple transgenic line carrying HuC:Gal4, a pan-neural driver, GAL4s1011t and the fluorescent calcium indicator GCaMP3 under the UAS promoter [7] in pigmentless Nacre zebrafish. Five (n = 5) larval zebrafish (6–8 dpf) from the F2 in-crossed generation were imaged under a two-photon microscope. Fish were anaesthetized by a muscle relaxant, mivacurium, 20 min before the experiment and mounted in 2% low-melting agarose in a glass-bottom dish, surrounded by two pairs of LEDs (red and UV) outside the dish and on each side anterior to the fish. Each fish was presented with a stimulus sequence that comprised four repetitions of the same-colour, same-duration stimulus with a fixed 20-s ISI as illustrated in figure 3a. This visual sequence design was intended to evoke a rhythmic neural response in the brain as shown in the tectum by Sumbre et al. [70]. Because fish were imaged under conditions of otherwise complete darkness, each LED illumination was a long flash of light to the whole recording chamber. All five fish completed five blocks of testing: Block 1 was the baseline recording without any stimulus, Blocks 2 and 3 comprised 20-s stimulus (red in Block 2 and UV in Block 3), whereas Blocks 4 and 5 comprised 30-s stimulus presentations with red and UV, respectively. Each block took about 5 min to complete and the inter-block interval was about another 5 min. During light exposure, the brain was imaged at five focal planes, at an interval of 1 s per z-stack.
Figure 3.

(a) Schematic diagram and time line of the experiment design. The stimulus is turned on four times for 20 s in Blocks 2 and 3 and 30 s in Blocks 4 and 5, all with a fixed ISI at 20 s. Block 1 is baseline recording, during which no stimuli were presented. The missing fifth stimulus (the empty dashed rectangular box) is the time window in which we identify the OSR neurons throughout the brain. In Block 1, the first empty dashed rectangular box (labelled AA) was used as the time window to obtain the baseline number of neurons meeting the OSR criteria for comparison with Blocks 2 and 3. The second empty dashed rectangular box in Block 1 (labelled BB) was used as the baseline window to obtain the OSR for comparison with Blocks 4 and 5. (b) Schematic diagram of cell segmentation of the whole brain using ImageJ automated algorithm (see the electronic supplementary materials for details). The brain is dissected into five different regions—blue for the habenula, red for the pallium, yellow for the anterior-dorsolateral pallium, light blue for the olfactory bulb and green for the tectum. The entire brain was scanned at five different z-planes with a distance of 12 µm between planes. With a range of 48 µm from top to ventral, the imaging covers the entire habenula and most of the pallium (1 pixel = 0.215 µm). (c) Mean (±s.e.m.) number of segmented neurons as a function of five recording blocks in each of the five subregions. There was no significant difference (p = 0.91) in the factor block and no significant interaction (p = 0.31) between block and brain regions across the five blocks indicating that the number of identified neurons remain at the same level across blocks. (d) Mean (±s.e.m.) pallium OSR neurons for colour and block conditions. The symbol †† indicates a significant difference for the factor of colour (p < 0.01) while the symbol ** indicates a significant difference for the factor of block (p < 0.01). The symbol ‡ indicates a significant interaction between colour and block (p < 0.05). (e) Mean (±s.e.m.) habenula OSR neurons for colour and block conditions. The symbol † indicates a significant difference for the factor of colour (p < 0.05), while the symbol ** indicates a significant difference for the factor of block (p < 0.01). (f) Ratio heatmap (F/F0) of habenula OSR neurons from all five fish in the 30-s UV, red and baseline conditions. The green rectangle bar in the beginning of the block indicates the time window (6–40 s) where the mean baseline fluorescence level (F0) was taken. The list of neurons from top to bottom is sorted by ascending standard deviation (s.d. from min to max) during the stimulus sequence, thus neurons with lesser response during the stimulus sequence appear at the top of each colour condition. There were 81 habenula OSR neurons (Rows 1–81) in the UV condition and 83 habenula OSR neurons (Rows 101–183) in the red condition. In the baseline, only 27 habenula neurons (Rows 201–227) met the OSR criteria owing to spontaneous activity in the habenula.
We noted that a number of neurons fired strongly when a fifth stimulus would have occurred had one been scheduled, although no stimulus was actually delivered as indicated by the fifth rectangular box in figure 3a. We term these cells omitted stimulus response (OSR) neurons, consistent with prior usage [72]. As shown in figure 3b, we divided the brain image into five subregions. The average number of recorded neurons from each subregion across blocks is plotted in figure 3c. A two-way ANOVA treating block (five blocks) and brain regions (five areas) as factors confirmed that there was no significant change (p = 0.91) of the number of neurons across five blocks, suggesting that our automated cell segmentation routine using an ImageJ algorithm across recording blocks was reliable (see the electronic supplementary material for details). The OSR neurons were defined as those showing lower than a mean of 1.2 F/F0 (a ratio change over baseline fluorescence level) value during the presentation of the stimulus sequence in conjunction with showing higher than 1.7 F/F0 value in at least 3 consecutive seconds during the 20-s window in which a fifth stimulus would have occurred had the stimulus presentation pattern been continued. These thresholding criteria (1.2 and 1.7) ensure that the identified OSR neurons were responding the strongest during the omitted stimulus time period, but were less active during the presentation of the stimulus sequence.
For statistical purposes, we grouped data from Blocks 2 and 3, in which the stimulus duration was 20 s into the first level of the block factor. Data from Blocks 4 and 5 were grouped as the second level of the block factor. The colour factor comprised red, UV and baseline. For the number of identified OSR neurons among the five subregions, a two-way ANOVA on each subregion confirmed a significant colour effect in the habenula (p < 0.05) and the pallium (p < 0.01). A significant block effect was also observed in the habenula (p < 0.01), pallium (p < 0.01) and tectum (p < 0.001). The interaction between colour and block was significant only in the pallium (p < 0.05) region. No OSR neurons were identified in the olfactory bulb or the ADP region. Because the recording area covered a small portion of the tectum only (figure 3b), the tectum data are not representative and are excluded from further discussion. Hence, we focus on the habenula and pallium OSR data. As illustrated in figure 3d, more pallium OSR neurons were observed in the red block after the stimulus duration was increased from 20 to 30 s, which was confirmed by a significant interaction between colour and block (p = 0.013) and post-hoc comparisons (p < 0.01 by Fisher LSD). Thus, the effects shown in figure 3d were largely driven by the increase of red OSR neurons. As illustrated in figure 3e, a significant increase of the number of OSR neurons was observed as a function of colour (p < 0.05) and block (p < 0.01), but no significant interaction was found. This suggests that the habenula showed an equivalent increase in OSR neurons in both the red and UV blocks (p = 0.92 by Fisher LSD) when the stimulus duration was increased to 30 s.
In summary, our data confirm the possibility of using whole-brain calcium imaging at single-cell resolution in temporal processing experiments. Specifically, the number of habenula OSR neurons in the red and UV blocks was significantly increased in later recording blocks, either because of more training experience with the stimulus sequence or because the stimulus duration was increased from 20 to 30 s. By looking at the ratio heatmap in figure 3f, the habenula OSR appears to result from timing of the ISI as some of the OSR neurons began showing excitation at the offset of each stimulus presentation, and reached the highest response level during the omitted stimulus time period. The OSR response observed here is conceptually similar to the anticipatory response shown in the lateral habenula in previous primate studies [35], but differs in that there was no reward or punishment in our paradigm. Therefore, stimulus valence through conditioning is probably not required to evoke a habenula anticipatory response, but a sequence of visual stimuli with a fixed ISI is sufficient. On a related note, the detection and prediction of periodic visual stimulus patterns has also been shown in the retina ganglion cells [72] and the tectum [70], but our experiment differs in the length of the stimulus duration, ISI duration (in the millisecond range in [72]), and the number of stimulus repetitions (a minimum of 10 repetitions in [70]) that are required to evoke an OSR. Here, three exposures of the fixed ISI were enough to evoke an OSR in the habenula after the fish had some experience with the same stimulus sequence. Our data also indicate that a 6–8-dpf larval zebrafish can time up to 20 s within 1 h of training.
6. Future interval-timing studies using zebrafish
Zebrafish offer several advantages for the study of the neural mechanisms underlying interval timing in vertebrates. For example, genetically encoded calcium indicators that report calcium-dependent neural activity can be easily developed and maintained in zebrafish to establish reliable transgenic lines, as demonstrated by our data. By using the Gal4/UAS system [73], specific neural populations can be labelled with Gal4 driver lines based on these cells’ genetic properties [7]. On the behavioural side, there are two ways to conduct timing studies—motor timing or perceptual timing. The motor timing approach, such as swimming in a certain location of a tank at a certain time window, may not be plausible in young larval zebrafish because of two concerns. First, it may require a sustained amount of training for a larval zebrafish to learn a visuospatial task, as demonstrated by Valente et al. [66], such that by the time the fish has acquired the task, the brain is no longer accessible for non-invasive imaging techniques, unless the skull is removed, and even then only the brain surface is accessible for imaging [9]. Second, a behaving and moving zebrafish head is certainly not ideal for imaging. However, there are exceptions to the second concern. A recent study successfully applied calcium imaging of the tectum while a 5-dpf larval fish was capturing a moving paramecium (a protozoan that larval fish hunt for food) [74]. This study was possible because larval fish often swim in intermittent bouts, thereby allowing the calcium signals in a non-moving tectum to be recorded in between the swimming bouts while the prey-capturing behavioural sequence was still ongoing. This new experimental approach may provide some hints for developing future behavioural and cognitive tasks, including timing tasks.
The use of perceptual timing tasks that allow investigation of how the fish perceives the duration of a stimulus or a sequence of stimuli is more plausible given the current technical limitations. A perceptual timing task can also be combined with restricted tail movement as some previous studies have shown promising results (CS–US conditioning in [69] and CS-entrained rhythms in [70]) in young larval fish, with minimum training required. It is also possible to train a larval fish in a different environment before imaging and then record the brain calcium signals to the same stimulus under a microscope, but this depends on how well a fish can generalize what it learned across different contexts.
State-of-the-art research on interval timing suggests that it is a cognitive function that relies on multiple brain regions, with cortico-striatal circuits currently under the research spotlight [75,76]. However, the details of how neurons in cortico-striatal circuits generate the sense of time remain to be elucidated. Using traditional electrophysiological recording techniques to record only a subset of neurons in the circuits is not sufficient to reveal the entire timing network. Imaging studies of the entire zebrafish forebrain at single-cell resolution (e.g. figure 3b) may provide this knowledge. For example, by combining whole-brain calcium imaging in conjunction with exposing fish to psychoactive drugs that alter the neurotransmission of dopamine or ACh, we can examine how clock-speed and temporal memory consolidation/retrieval are modulated at cell and circuit levels.
In addition, a developing brain following intense behavioural training may also be dynamically changing by itself owing to, for example, neurogenesis, synaptogenesis and synaptic pruning. As traditional in vivo extracellular electrophysiological recording techniques cannot distinguish between new and old cells over the course of several days, learning-dependent cellular and synaptic modification cannot be represented by frequency information of action potentials recorded near the electrodes. In contrast, whole-brain calcium imaging in zebrafish will be able to preserve these dynamic changes as there are calcium indicators for imaging cell bodies [77] and synaptic terminals [78] and structural changes owing to development or behavioural training [79]. As interval timing is a complex cognitive function that usually requires several days of training to adjust behaviour properly, its underlying cellular and synaptic change over the course of training will become visible under a microscope.
The experiment was approved and under the guidance of the Institutional Animal Care and Use Committee (IACUC) of the Biological Resource Centre at Biopolis (#120771).
References
- 1.Ahrens MB, Orger MB, Robson DN, Li JM, Keller BJ. 2013. Whole-brain functional imaging at cellular resolution using light-sheet microscopy. Nat. Methods 10, 413–420. ( 10.1038/nmeth.2434) [DOI] [PubMed] [Google Scholar]
- 2.Panier T, Romano SA, Olive R, Pietri T, Sumbre G, Candelier R, Debregeas G. 2013. Fast functional imaging of multiple brain regions in intact zebrafish larvae using Selective Plane Illumination Microscopy. Front. Neural Circuits 7, 65. [DOI] [PMC free article] [PubMed] [Google Scholar]
- 3.Coull JT, Cheng RK, Meck WH. 2011. Neuroanatomical and neurochemical substrates of timing. Neuropsychopharmacology 36, 3–25. ( 10.1038/npp.2010.113) [DOI] [PMC free article] [PubMed] [Google Scholar]
- 4.Vargas R, Thorsteinsson H, Karlsson KA. 2012. Spontaneous neural activity of the anterodorsal lobe and entopeduncular nucleus in adult zebrafish: a putative homologue of hippocampal sharp waves. Behav. Brain Res. 229, 10–20. ( 10.1016/j.bbr.2011.12.025) [DOI] [PubMed] [Google Scholar]
- 5.Mueller T, Guo S. 2009. The distribution of GAD67-mRNA in the adult zebrafish (Teleost) forebrain reveals a prosomeric pattern and suggests previously unidentified homologies to tetrapods. J. Comp. Neurol. 516, 553–568. ( 10.1002/cne.22122) [DOI] [PMC free article] [PubMed] [Google Scholar]
- 6.Maximino C, Lima MG, Oliveira KRM, Batista EDJO, Herculano AM. 2013. ‘Limbic associative’ and ‘autonomic’ amygdala in teleosts: a review of the evidence. J. Chem. Neuroanat. 48–49, 1–13. ( 10.1016/j.jchemneu.2012.10.001) [DOI] [PubMed] [Google Scholar]
- 7.Scott E. 2009. The Gal4/UAS toolbox in zebrafish: new approaches for defining behavioral circuits. J. Neurochem. 110, 441–456. ( 10.1111/j.1471-4159.2009.06161.x) [DOI] [PubMed] [Google Scholar]
- 8.Mueller T, Wullimann MF. 2009. An evolutionary interpretation of teleostean forebrain anatomy. Brain Behav. Evol. 74, 30–42. ( 10.1159/000229011) [DOI] [PubMed] [Google Scholar]
- 9.Aoki T, et al. 2013. Imaging of neural ensemble for the retrieval of a learned behavioral program. Neuron 78, 1–14. ( 10.1016/j.neuron.2013.04.009) [DOI] [PubMed] [Google Scholar]
- 10.Mueller T, Wullimann MF, Guo S. 2008. Early teleostean basal ganglia development visualized by zebrafish Dlx2a, Lhx6, Lhx7, Tbr2 (ecomesa), and GAD67 gene expression. J. Comp. Neurol. 507, 1245–1257. ( 10.1002/cne.21604) [DOI] [PubMed] [Google Scholar]
- 11.Hong S, Hikosaka O. 2008. The globus pallidus sends reward-related signals to the lateral habenula. Neuron 60, 720–729. ( 10.1016/j.neuron.2008.09.035) [DOI] [PMC free article] [PubMed] [Google Scholar]
- 12.Meck WH. 2006. Neuroanatomical localization of an internal clock: a functional link between mesolimbic, nigrostriatal, and mesocortical dopaminergic systems. Brain Res. 1109, 93–107. ( 10.1016/j.brainres.2006.06.031) [DOI] [PubMed] [Google Scholar]
- 13.Jin DZ, Fujii N, Graybiel AM. 2009. Neural representation of time in cortico-basal ganglia circuits. Proc. Natl Acad. Sci. USA 106, 19 156–19 161. ( 10.1073/pnas.0909881106) [DOI] [PMC free article] [PubMed] [Google Scholar]
- 14.Coull JT, Vidal F, Nazarian B, Macar F. 2004. Functional anatomy of the attentional modulation of time estimation. Science 503, 1506–1508. ( 10.1126/science.1091573) [DOI] [PubMed] [Google Scholar]
- 15.Matell MS, Meck WH. 2000. Neuropsychological mechanisms of interval timing behavior. Bioassays 22, 94–103. () [DOI] [PubMed] [Google Scholar]
- 16.Matell MS, Meck WH, Nicolelis MAL. 2003. Interval timing and the encoding of signal duration by ensembles of cortical and striatal neurons. Behav. Neurosci. 117, 760–773. ( 10.1037/0735-7044.117.4.760) [DOI] [PubMed] [Google Scholar]
- 17.Meck WH, Penney TB, Pouthas V. 2008. Cortico-striatal representation of time in animals and humans. Curr. Opinion Neurobiol. 18, 145–152. ( 10.1016/j.conb.2008.08.002) [DOI] [PubMed] [Google Scholar]
- 18.Wilson CJ. 1995. The contribution of cortical neurons to the firing pattern of striatal spiny neurons. In Models of information processing in the basal ganglia (eds Houk JC, Davis JL, Beiser DG.), pp. 29–50. Cambridge, MA: MIT Press. [Google Scholar]
- 19.Portavella M, Torres B, Salas C. 2004. Avoidance response in Goldfish: emotional and temporal involvement of medial and lateral telencephalic pallium. J. Neurosci. 24, 2335–2342. ( 10.1523/JNEUROSCI.4930-03.2004) [DOI] [PMC free article] [PubMed] [Google Scholar]
- 20.Olton DS, Meck WH, Church RM. 1987. Separation of hippocampal and amygdaloid involvement in temporal memory dysfunctions. Brain Res. 404, 180–188. ( 10.1016/0006-8993(87)91369-2) [DOI] [PubMed] [Google Scholar]
- 21.Balci F, Meck WH, Moore H, Brunner D. 2009. Timing deficits in aging and neuropathology. In Animal models of human cognitive aging (eds Bizon JL, Wood A.), pp. 161–201. Totowa, NJ: Humana Press. [Google Scholar]
- 22.Lewis PA, Couch TJ, Walker MP. 2011. Keeping time in your sleep: overnight consolidation of temporal rhythm. Neuropsychologia 49, 115–123. ( 10.1016/j.neuropsychologia.2010.10.025) [DOI] [PMC free article] [PubMed] [Google Scholar]
- 23.MacDoland CJ, Lepage KQ, Eden UT, Eichenbaum H. 2011. Hippocampal ‘time cells’ bridge the gap in memory for discontinuous events. Neuron 71, 737–749. ( 10.1016/j.neuron.2011.07.012) [DOI] [PMC free article] [PubMed] [Google Scholar]
- 24.MacDonald CJ, Carrow S, Place R, Eichenbaum H. 2013. Distinct hippocampal time cell sequences represent odor memories in immobilized rats. J. Neurosci. 33, 14 607–14 616. ( 10.1523/JNEUROSCI.1537-13.2013) [DOI] [PMC free article] [PubMed] [Google Scholar]
- 25.Phelps EA, LeDoux JE. 2005. Contribution of the amygdala to emotion processing: from animal models to human behavior. Neuron 48, 175–187. ( 10.1016/j.neuron.2005.09.025) [DOI] [PubMed] [Google Scholar]
- 26.Bermudez MA, Gobel C, Schultz W. 2012. Sensitivity to temporal reward structure in amygdala neurons. Curr. Biol. 22, 1839–1844. ( 10.1016/j.cub.2012.07.062) [DOI] [PMC free article] [PubMed] [Google Scholar]
- 27.Meck WH, MacDonald CJ. 2007. Amygdala inactivation reverses fear's ability to impair divided attention and make time stand still. Behav. Neurosci. 121, 707–720. ( 10.1037/0735-7044.121.4.707) [DOI] [PubMed] [Google Scholar]
- 28.Mella N, Conty L, Pouthas V. 2011. The role of physiological arousal in time perception: psychophysiological evidence from an emotion regulation paradigm. Brain Cogn. 75, 18–28. ( 10.1016/j.bandc.2010.10.005) [DOI] [PubMed] [Google Scholar]
- 29.Stephenson-Jones M, Floros O, Robertson B, Grillner S. 2011. Evolutionary conservation of the habenula nuclei and their circuitry controlling the dopamine and 5-hydroxytryptophan (5-HT) systems. Proc. Natl Acad. Sci. USA 109, E164–E173. [DOI] [PMC free article] [PubMed] [Google Scholar]
- 30.Hendricks M, Jesuthasan S. 2007. Asymmetric innervation of the habenula in zebrafish. J. Comp. Neurol. 502, 611–619. ( 10.1002/cne.21339) [DOI] [PubMed] [Google Scholar]
- 31.Aizawa H, Amo R, Okamoto H. 2011. Phylogeny and ontogeny of the habenula structure. Front. Neurosci. 5, 138 ( 10.3389/fnins.2011.00138) [DOI] [PMC free article] [PubMed] [Google Scholar]
- 32.Bianco IH, Wilson SW. 2009. The habenula nuclei: a conserved asymmetric relay station in the vertebrate brain. Phil. Trans. R. Soc. B 364, 1005–1020. ( 10.1098/rstb.2008.0213) [DOI] [PMC free article] [PubMed] [Google Scholar]
- 33.Hong S, Jhou TC, Smith M, Saleem KS, Hikosaka O. 2011. Negative reward signals from the lateral habenula to dopamine neurons are mediated by rostromedial tegmental nucleus in primates. J. Neurosci. 31, 11 457–11 471. ( 10.1523/JNEUROSCI.1384-11.2011) [DOI] [PMC free article] [PubMed] [Google Scholar]
- 34.Hikosaka O. 2010. The habenula: from stress evasion to value-based decision-making. Nat. Rev. Neurosci. 11, 503–513. ( 10.1038/nrn2866) [DOI] [PMC free article] [PubMed] [Google Scholar]
- 35.Bromgerg-Martin ES, Matsumoto M, Hikosaka O. 2010. Distinct tonic and phasic anticipatory activity in lateral habenula and dopamine neurons. Neuron 67, 144–155. ( 10.1016/j.neuron.2010.06.016) [DOI] [PMC free article] [PubMed] [Google Scholar]
- 36.Jesuthasan S. 2012. Fear, anxiety and control in the zebrafish. Dev. Neurobiol. 72, 395–403. ( 10.1002/dneu.20873) [DOI] [PubMed] [Google Scholar]
- 37.Okamoto H, Agetsuma M, Aizawa H. 2012. Genetic dissection of the zebrafish habenula, a possible switching board for selection of behavioral strategy to cope with fear and anxiety. Dev. Neurobiol. 72, 386–394. ( 10.1002/dneu.20913) [DOI] [PubMed] [Google Scholar]
- 38.Yamaguchi T, Danjo T, Pastan I, Hikida T, Nakanishi S. 2013. Distinct roles of segregated transmission of the septo-habenula pathway in anxiety and fear. Neuron 78, 537–544. ( 10.1016/j.neuron.2013.02.035) [DOI] [PMC free article] [PubMed] [Google Scholar]
- 39.Meck WH. 1996. Neuropharmacology of timing and time perception. Cogn. Brain Res. 3, 227–242. ( 10.1016/0926-6410(96)00009-2) [DOI] [PubMed] [Google Scholar]
- 40.Cheng RK, MacDonald CJ, Meck WH. 2006. Differential effects of cocaine and ketamine on time estimation: implications for neurobiological models of interval timing. Pharmacol. Biochem. Behav. 85, 114–122. ( 10.1016/j.pbb.2006.07.019) [DOI] [PubMed] [Google Scholar]
- 41.Lake JI, Meck WH. 2013. Differential effects of amphetamine and haloperidol on temporal reproduction: dopaminergic regulation of attention and clock speed. Neuropsychogia 51, 284–292. ( 10.1016/j.neuropsychologia.2012.09.014) [DOI] [PubMed] [Google Scholar]
- 42.Kastenhuber E, Kratochwil CF, Ryu S, Schweitzer J, Driever W. 2010. Genetic dissection of dopaminergic and noradrenergic contributions to catecholaminergic tracts in early larval zebrafish. J. Comp. Neurol. 518, 439–458. ( 10.1002/cne.22214) [DOI] [PMC free article] [PubMed] [Google Scholar]
- 43.Filippi A, Mahler J, Schweitzer J, Driever W. 2010. Expression of the paralogous tyrosine hydroxylase encoding genes th1 and th2 reveals the full complement of dopaminergic and noradrenergic neurons in zebrafish larval and juvenile brain. J. Comp. Neurol. 518, 423–438. ( 10.1002/cne.22213) [DOI] [PMC free article] [PubMed] [Google Scholar]
- 44.Yamamoto K, Ruuskanen JO, Wullimann MF, Vernier P. 2010. Two tyrosine hydroxylase genes in vertebrates: new dopaminergic territories revealed in the zebrafish brain. Mol. Cell Neurosci. 43, 394–402. ( 10.1016/j.mcn.2010.01.006) [DOI] [PubMed] [Google Scholar]
- 45.Mueller T, Vernier P, Wullimann MF. 2004. The adult central nervous cholinergic system of a neurogenetic model animal, the zebrafish Danio rerio. Brain Res. 1011, 156–169. ( 10.1016/j.brainres.2004.02.073) [DOI] [PubMed] [Google Scholar]
- 46.Lillesaar C. 2011. The serotonergic system in fish. J. Chem. Neuroanat. 41, 294–308. ( 10.1016/j.jchemneu.2011.05.009) [DOI] [PubMed] [Google Scholar]
- 47.Mahler J, Filippi A, Driever W. 2010. DeltaA/DeltaD regulate multiple and temporally distinct phases of notch signaling during dopaminergic neurogenesis in zebrafish. J. Neurosci. 30, 16 621–16 635. ( 10.1523/JNEUROSCI.4769-10.2010) [DOI] [PMC free article] [PubMed] [Google Scholar]
- 48.Souza BR, Romano-Silva MA, Tropepe V. 2011. Dopamine D2 receptor activity modulates Akt signaling and alters GABAergic neuron development and motor behavior in zebrafish larvae. J. Neurosci. 31, 5512–5525. ( 10.1523/JNEUROSCI.5548-10.2011) [DOI] [PMC free article] [PubMed] [Google Scholar]
- 49.Meck WH, Church RM. 1987. Cholinergic modulation of the content of temporal memory. Behav. Neurosci. 101, 457–464. ( 10.1037/0735-7044.101.4.457) [DOI] [PubMed] [Google Scholar]
- 50.Meck WH. 2006. Temporal memory in matured and aged rate is sensitive to choline acetyltransferase inhibition. Brain Res. 1108, 168–175. ( 10.1016/j.brainres.2006.06.047) [DOI] [PubMed] [Google Scholar]
- 51.Jacobs SE, Fine A, Juliano SL. 1994. Cholinergic basal forebrain transplants restore diminished metabolic activity in the somatosensory cortex of rats with acetylcholine depletion. J. Neurosci. 14, 697–711. [DOI] [PMC free article] [PubMed] [Google Scholar]
- 52.Meck WH, Church RM, Wenk GL, Olton DS. 1987. Nucleus basalis magnocellularis and medial septal area lesions differentially impair temporal memory. J. Neurosci. 7, 3505–3511. [DOI] [PMC free article] [PubMed] [Google Scholar]
- 53.Hinton SC, Meck WH. 1996. Increasing the speed of an internal clock: the effects of nicotine on interval timing. Drug Dev. Res. 38, 204–211. () [DOI] [Google Scholar]
- 54.Eddins D, Petro A, Williams P, Cerutti DT, Levin ED. 2009. Nicotine effects on learning in zebrafish: the role of dopaminergic systems. Psychopharmacology 202, 103–109. ( 10.1007/s00213-008-1287-4) [DOI] [PubMed] [Google Scholar]
- 55.Gorlich A, Antolin-Fontes B, Ables JL, Frahm S, Slimak MA, Dougherty JD, Tallon I-I. 2013. Reexposure to nicotine during withdrawal increases the pacemaking activity of cholinergic habenula neurons. Proc. Natl Acad. Sci. USA 110, 17 077–17 082. ( 10.1073/pnas.1313103110) [DOI] [PMC free article] [PubMed] [Google Scholar]
- 56.McLean DL, Fetcho JR. 2004. Ontogeny and innervation patterns of dopaminergic, noradrenergic, and serotonergic neurons in larval zebrafish. J. Comp. Neurol. 480, 38–56. ( 10.1002/cne.20280) [DOI] [PubMed] [Google Scholar]
- 57.Rammsayer TH, Hennig J, Haag A, Lange N. 2001. Effects of noradrenergic activity on temporal processing in humans. Q. J. Exp. Psychol. B. 54, 247–258. ( 10.1080/02724990143000036) [DOI] [PubMed] [Google Scholar]
- 58.Penney TB, Holder MD, Meck WH. 1996. Clonidine-induced antagonism of norepinephrine modulates the attentional processes involved in peak-interval timing. Exp. Clin. Psychopharm. 4, 82–92. ( 10.1037/1064-1297.4.1.82) [DOI] [Google Scholar]
- 59.Yokogawa T, Hannan MC, Burgess HA. 2012. The dorsal raphe modulates sensory responsiveness during arousal in zebrafish. J. Neurosci. 32, 15 205–15 215. ( 10.1523/JNEUROSCI.1019-12.2012) [DOI] [PMC free article] [PubMed] [Google Scholar]
- 60.Fero K, Yokogawa T, Burgess HA. 2011. The behavioral repertoire of larval zebrafish. In Zebrafish models in neurobehavioural research (eds Kalueff AV, Cachat JM.), ch. 12, pp. 249–291. Berlin, Germany: Springer. [Google Scholar]
- 61.Drew MR, Zupan B, Cooke A, Couvillon PA, Balsam PD. 2005. Temporal control of conditioned responding in Goldfish. J. Exp. Psych. Anim. Behav. Proc. 31, 31–39. ( 10.1037/0097-7403.31.1.31) [DOI] [PubMed] [Google Scholar]
- 62.Agetsuma M, et al. 2010. The habenula is crucial for experience-dependent modification of fear responses in zebrafish. Nat. Neurosci. 13, 1354–1356. ( 10.1038/nn.2654) [DOI] [PubMed] [Google Scholar]
- 63.Lee A, Mathuru AS, Teh C, Kibat C, Korzh V, Penney TB, Jesuthasan S. 2010. The habenula prevents helpless behavior in larval zebrafish. Curr. Biol. 20, 2211–2216. ( 10.1016/j.cub.2010.11.025) [DOI] [PubMed] [Google Scholar]
- 64.Nordgreen J, Janczak AM, Hovland AL, Ranheim B, Horsberg TE. 2010. Trace classical conditioning in rainbow trout (Oncorhynchus mykiss): what do they learn? Anim. Cogn. 13, 303–309. ( 10.1007/s10071-009-0267-3) [DOI] [PubMed] [Google Scholar]
- 65.Cerutti D, Jozefowiez D, Staddon JER. 2013. Rapid, accurate time estimation in zebrafish (Danio rerio). Behav. Process. 99, 21–25. ( 10.1016/j.beproc.2013.06.007) [DOI] [PubMed] [Google Scholar]
- 66.Valente A, Huang K-H, Portugues R, Engert F. 2012. Ontogeny of classical and operant learning behaviors in zebrafish. Learn. Mem. 19, 170–177. ( 10.1101/lm.025668.112) [DOI] [PMC free article] [PubMed] [Google Scholar]
- 67.Ahrens MB, Li JM, Orger MB, Robson DN, Schier AF, Engert F, Portugues R. 2012. Brain-wide neuronal dynamics during motor adaptation in zebrafish. Nature 485, 471–477. ( 10.1038/nature11057) [DOI] [PMC free article] [PubMed] [Google Scholar]
- 68.Engert F. 2013. Fish in the matrix: motor learning in a virtual world. Front. Neural Circuits 6, 125 ( 10.3389/fncir.2012.00125) [DOI] [PMC free article] [PubMed] [Google Scholar]
- 69.Aizenberg M, Schuman EM. 2011. Cerebellar-dependent learning in larval zebrafish. J. Neurosci. 31, 8708–8712. ( 10.1523/JNEUROSCI.6565-10.2011) [DOI] [PMC free article] [PubMed] [Google Scholar]
- 70.Sumbre G, Muto A, Baier H, Poo MM. 2008. Entrained rhythmic activities of neuronal ensembles as perceptual memory of time interval. Nature 456, 102–106. ( 10.1038/nature07351) [DOI] [PMC free article] [PubMed] [Google Scholar]
- 71.Niell CM, Smith SJ. 2005. Functional imaging reveals rapid development of visual response properties in the zebrafish tectum. Neuron 45, 941–951. ( 10.1016/j.neuron.2005.01.047) [DOI] [PubMed] [Google Scholar]
- 72.Schwartz G, Harris R, Shrom D, Berry MJ., 2nd 2007. Detection and prediction of periodic patterns by the retina. Nat. Neurosci. 10, 552–554. ( 10.1038/nn1887) [DOI] [PMC free article] [PubMed] [Google Scholar]
- 73.Scott E, Baier H. 2009. The cellular architecture of the larval zebrafish tectum, as revealed by Gal4 enhancer trap lines. Front. Neural Circuits 3, 13. [DOI] [PMC free article] [PubMed] [Google Scholar]
- 74.Muto A, Ohkura M, Abe G, Nakai J, Kawakami K. 2013. Real-time visualization of neuronal activity during perception. Curr. Biol. 23, 307–311. ( 10.1016/j.cub.2012.12.040) [DOI] [PubMed] [Google Scholar]
- 75.Buhusi CV, Meck WH. 2005. What makes us tick? Functional and neural mechanisms of interval timing. Nat. Rev. Neurosci. 6, 755–765. ( 10.1038/nrn1764) [DOI] [PubMed] [Google Scholar]
- 76.Merchant H, Harrington DL, Meck WH. 2013. Neural basis of the perception and estimation of time. Annu. Rev. Neurosci. 36, 313–336. ( 10.1146/annurev-neuro-062012-170349) [DOI] [PubMed] [Google Scholar]
- 77.Chen T-W, et al. 2013. Ultrasensitive fluorescent proteins for imaging neuronal activity. Nature 499, 295–300. ( 10.1038/nature12354) [DOI] [PMC free article] [PubMed] [Google Scholar]
- 78.Dreosi E, Odermatt B, Morostkar MM, Ladnado L. 2009. A genetically encoded reporter of synaptic activity in vivo. Nat. Methods 6, 883–889. ( 10.1038/nmeth.1399) [DOI] [PMC free article] [PubMed] [Google Scholar]
- 79.Leung LC, Wang GX, Mourrain P. 2013. Imaging zebrafish neural activity from whole brain to synapse. Front. Neural Circuits 7, 76 ( 10.33389/fncir.2013.00076) [DOI] [PMC free article] [PubMed] [Google Scholar]