

Abstract
In Italy, during the course of the past century to the present-day, measles incidence underwent a remarkable decreasing trend that started well before the introduction of the national immunization programme. In this work, we aim at examining to what extent both the demographic transition, characterized by declining mortality and fertility rates over time, and the vaccination programme are responsible for the observed epidemiological pattern. Making use of a non-stationary, age-structured disease transmission model, we show that in the pre-vaccination era, from 1901 to 1982, the decline in birth rates has resulted in a drastic decrease in the effective transmission rate, which in turn has determined a declining trend of measles incidence (from 25.2 to 10.3 infections per 1000 individuals). However, since 1983, vaccination appears to have become the major contributing factor in the decrease of measles incidence, which otherwise would have remained stable as a consequence of the nearly constant birth rates. This led to a remarkable decrease in the effective transmission rate, to a level well below the critical threshold for disease persistence. These findings call for the adoption of epidemiological models, which deviate the age structure from stationary equilibrium solutions, to better understand the biology of infectious diseases and evaluate immunization programmes.
Keywords: infectious diseases, demography, population dynamics
1. Introduction
Despite a long history of immunization programmes, measles is still circulating in several regions of Europe, mainly in the form of recurring spatially localized epidemics [1–3]. This poses serious concerns about the possibility of reaching the goal set by the Member States in the WHO Europe Region of eliminating measles by 2015 [4] and it calls for a deeper understanding of measles transmission dynamics.
A lot of work has been done towards understanding some common patterns of measles, such as seasonality and cyclic epidemics [5–11], disease persistence [6,11], transmission potential [12,13], relation between fertility and epidemic size [7,14] and the effects of spatial heterogeneity in the birth rates [11].
The aim of this work is to understand and quantify the roles of the demographic transition and of the implemented routine vaccination programme in shaping the observed pattern of measles incidence over time. Qualitatively, the potential impact of these factors on measles incidence could be inferred theoretically [15]. This study, however, represents the first attempt to decipher and quantify their relative weights.
The proposed investigation is motivated by the analysis of historical incidence of measles in Italy, which shows an almost continuous decreasing trend from the beginning of past century–well before the introduction of the national immunization programme in 1983–to the present day. Specifically, here we aim to answer the following two questions: (i) which are the causes of the observed decreasing trend of incidence before the introduction of measles vaccine in 1983? In fact, while it is well known that changes in birth rate reflect on disease incidence—over the past century, the Italian population underwent dramatic demographic changes—it is not clear whether the observed pattern is fully imputable to demographic transition; (ii) what is the net effect of vaccination on measles incidence? In fact, it is not clear whether the observed decreasing trend of incidence since 1983 is solely ascribable to the introduction of measles vaccine.
To answer these questions, we abandon the classic paradigm of constant population and stable age distribution over time in favour of a non-stationary, age-structured mathematical model of disease transmission, informed with longitudinal demographic data. Calibration and validation of the proposed non-stationary epidemiological model are critical issues. The availability of serological data collected both before (in 1978) and after (in 1997 and 2004) the onset of the vaccination programme [16–18], and the availability of historical data on measles incidence from 1925 to 2009, make Italy particularly suitable for such a study.
2. Material and methods
To assess the relative weights of the demographic transition and of the vaccination programme on measles incidence in Italy during the course of past century, a deterministic age-structured model was developed—with the population grouped into 1-year age classes—which is capable of describing both demographic changes in the Italian population as well as measles transmission dynamics from 1901 to 2009.
The model is informed with longitudinal data on age-specific mortality rates, birth rates and migration flows. All these factors are essential to reproduce the demographic structure of the Italian population over time. Specifically, realistic mortality and birth rates are necessary to reconstruct the age structure of the population over time, and thus the pattern that characterized the demographic transition. Migration flows are necessary to obtain realistic predictions of population size over time—the number of Italian emigrants from 1895 to 1985 is estimated to be about 23 million and the number of immigrants from 2002 to 2009 is estimated to be about 3.5 million. Birth- and age-specific mortality rates are derived from census data (provided by the Italian Institute of Statistics), collected every 10 years; for intercensual years, we made a linear interpolation between the data from two consecutive censuses. Migration flows are estimated by combining estimates of the yearly number of migrants (provided by the Italian Institute of Statistics) and recent estimates of the age distribution of migrants [19]. Demographic data are shown in the electronic supplementary material.
To calibrate and validate the model, we make use of the following epidemiological data sets: serological data coming from three studies conducted in 1978 [16], 1997 [17] and 2004 [18]; yearly incidence from 1925 to 2009 (provided by the Italian Institute of Statistics); data on average age at infection in different years and age distribution of cases for the year 2009 [3].
In order to model the disease transmission process, the population of each age class i is divided into five epidemic classes: susceptible (Si(t), individuals who can acquire infection), susceptible vaccinated (Fi(t), individuals who are still susceptible after having received one or two vaccine doses), latent (Li(t), individuals who have been infected and are not able to transmit the pathogen yet), infectious (Ii(t), individuals who have been infected and are able to transmit the pathogen) and removed (Ri(t), individuals who are immune to the disease, either because of vaccination or because they recovered from infection). The mean durations of both the latent (1/ω) and the infectious (1/γ) period are fixed at 7 days [12], whereas immunity is assumed to be lifelong.
As baseline choice, although it has largely been shown in the literature that mixing patterns are assortative by age [20,21], we make the simplest assumption of homogeneous mixing, i.e. all individuals in the population are exposed to the same force of infection. The main reason that led us to make this simplistic assumption is that, given the dramatic social and demographic changes observed during the past century (e.g. in household size and composition, school attendance rate and urbanization level), our knowledge on current age-mixing pattern cannot be considered representative of the whole studied period and no quantitative historical data on mixing pattern by age are available.
We do not assume any seasonal forcing even though within-year measles dynamics is well documented and follows a clear seasonal pattern, triggered by alternation of school term periods and summer holidays. Again, this assumption was made because, to our knowledge, current seasonal forcing cannot be considered representative of the whole period. Indeed, school attendance rates have dramatically increased during the past century and school term periods may have changed (e.g. because of changes in school organization and wars).
Although heterogeneous mixing and seasonality rate are not considered in the baseline model, the sensitivity of our results to different assumptions on contact patterns (in particular, we use age-specific contact matrices reported in [20] and [21]) and to seasonal variation of the transmission rate was considered.
The model accounts for vaccination of 1-year-old children and a second booster dose given to children at the age of 5 years. There are two parameters regulating the vaccination process: (i) vaccine efficacy, i.e. the probability that an individual becomes immune after the administration of a vaccine dose (which is assumed to be f = 95% as reported in the literature; see, for instance, [12]); and (ii) vaccination coverage, i.e. the fraction of individuals of a given age who are vaccinated for the first time, v1(t), or receive the second dose, v5(t). These data were obtained from the Italian Ministry of Health and the Italian Institute of Statistics and they are shown in the electronic supplementary material.
The model has only one free parameter, namely the disease-specific transmission rate β, and consists of the following set of ordinary differential equations:
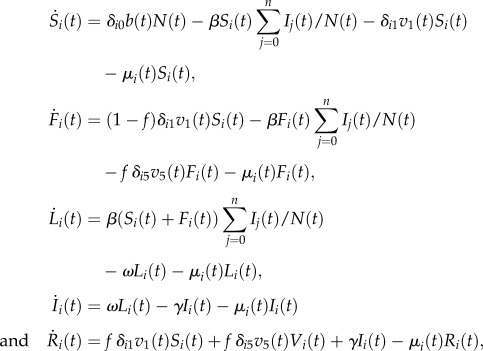 |
where b(t) is the yearly birth rate, μi(t) are yearly age-specific mortality rates, N(t) represents the total population, n = 100 years is the maximum age considered in the model and δij is the Dirac delta function.
As the age structure of the Italian population in 1901 can be considered in equilibrium (see the electronic supplementary material), initial conditions of the system in 1901 are defined as the equilibrium solution of the system with birth and mortality rates by age fixed to those observed in 1901 and a certain transmission rate β, and initialized with 10 infected individuals.
Posterior distribution of β was explored by Markov chain Monte Carlo (MCMC) sampling applied to the likelihood of serological data coming from two studies conducted in the pre-vaccination (1978) and vaccination (2004) era, respectively. A log scale was used for sampling as parameter β is positive definite [22].
The fundamental quantity regulating disease dynamics is the basic reproduction number (R0), which represents the average number of secondary infections generated by a typical index case during the entire period of infectiousness [12]. R0 can be computed analytically for this model as the dominant eigenvalue of the next generation matrix associated to the transmission model [23], and can be approximated by R0 = β/γ.
Starting from results presented in [7,24], it is straightforward to show that changing the birth rate by a given factor ε produces exactly the same dynamical transitions as changing the transmission rate by the same factor, that is, changing birth rates from b to (1 + ɛ)b is equivalent to changing the transmission rate from β to β(1 + ɛ). This argument can be readily generalized to the case where a fraction v of newborns is vaccinated with vaccine efficacy f. Therefore, we define β(1 + ɛ)(1 − fv) to be the effective transmission rate of the disease. We analyse changes in measles epidemiology in terms of changes of the effective transmission rate.
Details on model formulation, parameterization and calibration can be found in the electronic supplementary material.
3. Results and discussion
(a). Validation of the demographic model
A prerequisite for analysing the effects of demographic transition on measles incidence is the availability of a reliable and robust demographic model. The analysis of historical demographic data shows that the age distribution of the Italian population before the 1901 census was in a stationary equilibrium (see the electronic supplementary material). Afterwards, at least four main events have characterized the demographic dynamics in Italy: the drop in birth rates during the two world wars, the ‘baby boom’ in the 1950s, and another prolonged drop in birth rate since the seventies. These changes, coupled with the drop in mortality rates, especially in children and the elderly, have led to the progressive aging of the Italian population. Only in recent years has immigration contributed to sustaining population growth. As shown in figure 1a, the population model, informed with longitudinal data on birth rates, age-specific mortality rates and emigration/immigration rates, well explains the demographic dynamics of the Italian population since the beginning of the past century. The agreement with available historical data on the age structure of the Italian population is excellent (figure 1b) and the coefficient of determination R2 is larger than 0.99 (p-value < 0.0001) in all tested years. In the electronic supplementary material, we compare observed and predicted population size over time and analyse the effects of emigration and immigration fluxes.
Figure 1.
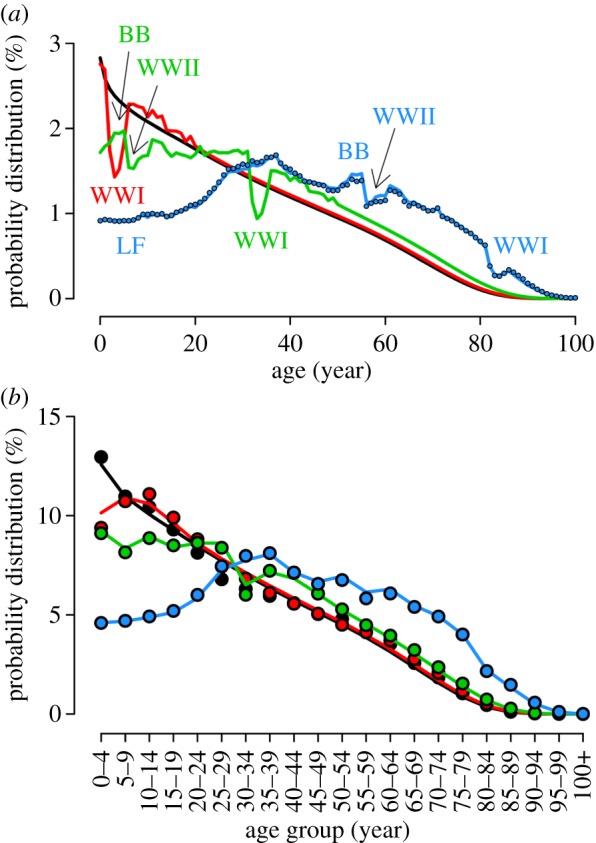
(a) Simulated age distribution of the Italian population in 1901, (black line); 1921, (red line); 1951, (green line) and 2001, (blue line). Labels indicate the most important demographic events of the last century: the two World Wars (WWI and WWII, respectively), the ‘baby boom’ of the 1950s (BB) and a period of low fertility since the 1970s (LF). Blue points represent the actual age distribution as resulting from the 2001 census. (b) Simulated age distribution of 1901, 1921, 1951 and 2001 (lines) compared to historical records, available for 5-year age groups (points).
(b). Calibration of the disease transmission model
Although the model has only one degree of freedom, the fit to serological data is excellent (figure 2a,b): indeed, for the majority of data points, the observed average seroprevalence falls in the 95% CI of model predictions and for all age groups observed, and predicted 95% CI intersects. The transmission rate was estimated to be β = 677.9 per year (95% CI: 657.7–698.1 yr−1), resulting in R0 = 13 (95% CI: 12.6–13.4) in 1901. This estimate is in quite good agreement with the estimated range 11–12 obtained in [12] by analysing historical measles data for England and Canada.
Figure 2.
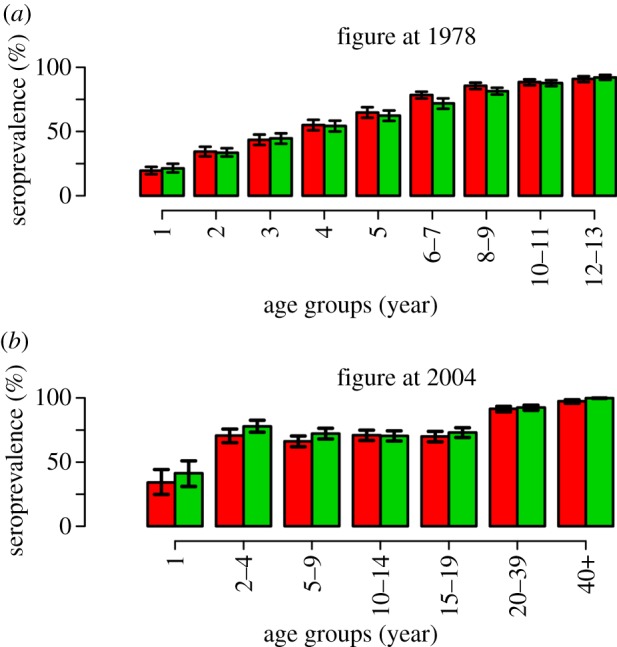
(a) Average observed (red) and predicted (green) seroprevalence by age group in 1978. Black lines represent 95% CI as obtained from exact binomial test both for data and model simulations, where the probability of being seropositive by age groups is the one predicted by the model and the sample size is the same as the actual serosurvey [16]. (b) As (a), but for 2004. Serosurvey data are taken from [18].
Remarkably, in the electronic supplementary material, we show that the classic equilibrium equations (stationary age structure and endemic equilibrium) produce a worse fit to the 1978 serological data (2004 data are not suitable for this analysis as they are affected by the effects of time-varying vaccination) with respect to the proposed non-stationary model. In fact, in general, serological data depend on a long history of infections, and, specifically for the 1978 serosurvey data, on infections occurred from 1965 to 1978. This period was characterized by one of the most remarkable drops in birth rate in the history of the Italian population (about 35% from 1965 to 1978) and, consequently, a proportional drop in the effective transmission rate. Therefore, older age classes (e.g. 1965–1972 birth cohorts) have experienced a higher force of infection, at least in their first years of life, with respect to younger age classes (e.g. 1973–1978 birth cohorts). This is the reason why classical equilibrium equations, not accounting for demographic changes, underestimate seroprevalence in older age classes and overestimate seroprevalence in younger age classes, thus resulting in an overall worse fit. All in all, this supports the use of the proposed model to analyse the role of demographic transition on measles incidence.
(c). Validation of the disease transmission model
Once parameterized, we validate the model against a set of data not used for model calibration.
In the first half of the past century, measles incidence in Italy underwent a dramatic decreasing trend, even well before the introduction of vaccination (figure 3a). Although incidence data reported to the statutory notification system suffer from underreporting (as well as being variable over time and by region [16]) and have a crude temporal resolution (yearly data), a comparison between the incidence predicted by the model, and that reported to the statutory notification system, adjusted for underreporting, shows a high correlation (Spearman's rank correlation: ρ = 0.99, p < 0.0001; coefficient of determination: R2 = 0.94, p-value < 0.0001; figure 3a). Both the observed and the predicted incidence were averaged over a moving window of 15 years. Estimates of underreporting (7.4%) were obtained by analysing monthly incidence data from 1980 to 1996 (details in the electronic supplementary material). Poor validation before the 1950s can be explained by contact structure and seasonality being different from recent years and on which we have no information. By restricting the comparison to years after 1950, the coefficient of determination R2 increases to 0.99, p-value < 0.0001.
Figure 3.
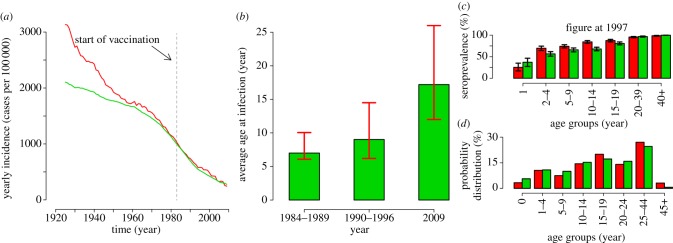
(a) Yearly measles incidence over time as reported to the statutory notification system (multiplied by the inverse of the estimated reporting rate, namely 7.4%; see the electronic supplementary material) averaged over a moving window of 15 years (red line, notification data) and the same quantity as predicted by the model (green line, model prediction). The vertical dashed grey line represents the year in which the Italian immunization programme started. (b) Average age at infection as predicted by the model in selected time window (green bars, predicted national average) compared with the range (minimum and maximum) of the median age at infection as observed in the different Italian regions (red lines, regional national average). (c) Average observed (red) and predicted (green) seroprevalence by age group in 1997. Black lines represent 95% CI as obtained from exact binomial test both for data and model simulations where the probability of being seropositive by age groups is the one predicted by the model and the sample size is the same as the actual serosurvey [17]. (d) Probability distribution of cases by age group in 2009 as reported to the surveillance system (red) and as predicted by the model (green).
Estimates of the average age at infection are available only in three time windows, all lying in the vaccination era. Whenever such data are available, model predictions for the whole of Italy lie inside the minimum and maximum average age at infection observed in the 21 Italian Regions (figure 3b). It is worthwhile to stress that the large regional variability may depend on the observed different levels of vaccine coverage [25]. Moreover, our results show a bump in the average age at infection during the World War I, which is in line with the recorded historical data on measles mortality [26].
The model was also validated against serological data collected in 1997 [17]; the comparison between observed and predicted seroprevalence by age groups is shown in figure 3c. The model slightly underestimates seroprevalence in children aged 2–4 and 10–14 years. However, for all other age groups, the observed and the predicted 95% CI intersect.
Detailed age-specific incidence data are available for 2009: as shown in figure 3d, age distribution of cases peaked in adults (individuals aged 25–44 years) both in model predictions and in the surveillance data, and the predicted distribution of cases by age is in good agreement with the one observed (Spearman's rank correlation: ρ = 0.98, p = 0.0004; coefficient of determination: R2 = 0.97, p-value < 0.001).
(d). Assessing the relative weights of demographic transition and vaccination in the decrease of measles incidence
The observed trend of the birth rate over time yields an estimate of an almost always decreasing pattern in the effective transmission rate during the pre-vaccination era. Specifically, the effective transmission rate drops from 677.9 per year (95% CI: 657.7–698.1 per year) in 1901 to 236.4 per year (95% CI: 229.3–243.4 per year) in 1982, almost three times lower than in 1901 (figure 4a). The introduction of vaccination in 1983 contributed to accelerate this decreasing trend (figure 4a). In particular, together with the effect of demographic changes, the immunization programme contributed to lowering the effective transmission rate so that the threshold for measles elimination was reached (figure 4a). Without the introduction of the immunization programme in 1983, the effective transmission rate would have remained nearly constant to those values that were predicted for the early 1980s (figure 4a).
Figure 4.

(a) Effective transmission rate over time adjusted for birth rate and vaccination (mean: green line, 95% CI: light green area) and adjusted only for birth rate (mean: blue line, 95% CI: cyan area); see the electronic supplementary material for details. The vertical dashed grey line represents the year in which the Italian immunization programme started. The shaded grey area represents the invasion threshold of the disease. (b) Estimated yearly incidence over time (mean: green line, 95% CI: light green area) and estimated yearly incidence over time by assuming no vaccination (mean: blue line, 95% CI: cyan area). The vertical dashed grey line represents the year in which the Italian immunization programme started. (c) Number of avoided infections per vaccine dose (black, scale on the left) and vaccination coverage (red, scale on the right) over time. (d) Predicted average age at infection over time (green line) and predicted average age at infection by assuming no vaccination (blue line). The vertical dashed grey line represents the year in which the Italian immunization programme started. (e) Simulated average measles seroprevalence by age in 1901 (green), 1950 (blue), 1982 (i.e. the year before the start of measles immunization programme; red) and 2009 (black). Grey lines represent serological profiles in intermediate years. (f) Percentage variation of seroprevalence by age group over time with respect to the seroprevalence in 1901 in the same age group.
Figure 4b shows the effects of demographic transition and vaccination on measles incidence. The average incidence was estimated to be 25.2 (95% CI: 25.1–25.3) per 1000 individuals in 1901 and dropped to 10.3 (95% CI: 10.2–10.4) per 1000 individuals in 1982. Without the introduction of measles vaccine, in the past 30 years, the incidence would have remained nearly constant at values observed in the early 1980s. We also found a strong positive correlation between birth rate and both the predicted and observed measles incidence (Spearman's rank correlation: ρ = 0.97, p < 0.0001 and ρ = 0.88, p < 0.0001, respectively). In addition, both predicted and observed measles incidence appear to be strongly positively correlated with the effective transmission rate (Spearman's rank correlation: ρ = 0.97, p < 0.0001 and ρ = 0.89, p < 0.0001, respectively).
We estimated that the number of avoided cases per vaccine dose (i.e. the difference between the number of cases predicted by the model without and with vaccination, divided by the number of vaccinated individuals, cumulated over time) readily increased over time and nowadays is close to 1 (figure 4c), strongly supporting the cost-effectiveness of measles vaccination. Our estimates comply with those reported in [27] where authors estimate the number of avoided infections per vaccine dose to be about 0.11 in Palermo (Sicily) from 1993 to 1997. Such a low value might be a consequence of the low vaccine coverage and force of infection (as a consequence of demographic factors) over that period.
As highlighted in figure 4d, a remarkable increase in the ages of cases over time is predicted in the pre-vaccination era: in particular, the average age at infection is estimated to have increased from 2.8 years (95% CI: 2.7–2.9 years) in 1901 to 5.9 years (95% CI: 5.8–6.1 years) in 1982. By looking at the vaccination era, we found a drastic increase in the average age at infection: the estimated average age at infection in 2009 was 17 years (95% CI: 16.7–17.3 years).
The impact of decreasing incidence and increasing age at infection in shaping age-specific measles seroprevalence can be appreciated by looking at figure 4e where, according to model simulations, we predict a progressive reduction of seropositive individuals in children and adolescents up to the start of the national measles immunization programme in 1983. This decline is well marked especially in individuals aged less than 10 years; in particular, as shown in figure 4f, during the pre-vaccination era variations of up to 50% in seropositive individuals are predicted in children aged 0–3 years and up to 40% in the other age classes. In later years, the effect of the immunization campaign prevails over that of demographic transition in shaping seroprevalence profiles by age. In particular, by looking at predictions for 2009, it emerges that low vaccine coverage from 1983 to the end of past century has generated a protection gap particularly relevant among individuals aged 10–30 years (less than 80% of individuals protected; see figure 4e) who are currently the most affected age group.
(e). Sensitivity analysis
The effects of different assumptions on mixing patterns by age on model results were evaluated. The model was calibrated with two different contact matrices by age available for Italy, namely the Polymod matrix [20] and the synthetic contact matrix reported in [21]. Overall, results show that mixing patterns are likely to have changed so much during the course of the past century that our knowledge on the current age-mixing pattern cannot be considered representative for the whole period. Nonetheless, the use of contact matrices may contribute to improving predictions for the most recent period, characterized by higher average age at infection, and thus contacts between individuals in different age groups become more relevant. Details on this topic can be found in the electronic supplementary material.
It is well documented that measles dynamics follows a clear seasonal pattern. Our analysis, based on the analysis of monthly incidence from 1980 to 1996, supports the already proposed hypothesis (see for instance [7,8]) that this pattern is mainly driven by the school calendar. However, we also show that the within-year pattern does not influence the global trend of disease incidence, whose analysis is the main aim of this work. We also found that the seasonal reporting rate may vary between 1.5 and 25%, a result consistent with available estimates on its geographical variability [28]. An in-depth discussion on this topic can be found in the electronic supplementary material.
We found that results are insensitive to length and distribution of latent and infectious periods, unless we consider unreasonably long durations. Details on this topic can be found in the electronic supplementary material.
4. Conclusion
In this work, we aimed to answer the following two questions: (i) what are the causes of the observed decreasing trend in the incidence of measles cases before the introduction of measles vaccine in 1983? (ii) What is the net effect of vaccination on measles incidence? For the first question, our results clearly support the hypothesis that demographic transition is mainly responsible for the observed decreasing trend in incidence before the introduction of the measles vaccine. For the second question, our results show that incidence would have remained almost constant since the early 1980s as a result of nearly constant birth rates. Thus, our results support the hypothesis that the decreasing trend of incidence observed in the vaccination era is mainly attributable to the direct effect of vaccination.
More in detail, we found that demographic transition is responsible for a threefold decrease in the effective transmission rate during the pre-vaccination era, which in turn contributed to a proportional decrease in measles incidence (from about 25.2 per 1000 individuals in 1901 to 10.3 per 1000 individuals in 1982). Demographic transition also determined a drastic increase in the average age at infection (from 2.1 years in 1901 to 5.5 years in 1982) during the pre-vaccination era and remarkable differences (up to 50% in young age classes) in terms of measles seroprevalence by age. As for the vaccination era, we found that the number of avoided infections per vaccine dose readily rose to values close to 1 and vaccination greatly contributed to making the final step in decreasing the effective transmission rate to values below the critical threshold for disease persistence. Conversely, the average age at infection increased to values between 15 and 20 years in 2009 and, as an effect of initially low vaccine coverage before 2000, a protection gap particularly relevant in individuals aged 10–30 years (less than 80% of individuals protected) has emerged. These results support the hypothesis that measles has become no more endemic in Italy and explain why its epidemiology is characterized by series of sporadic spatially localized outbreaks occurring in age classes (mostly 10–30 years old) that are still unprotected.
From the methodological point of view, it is interesting to observe how (unexpectedly) well a non-stationary age-structured model, informed with longitudinal demographic and vaccination data and with only one free parameter (namely, the disease-specific transmission rate), is able to describe the observed measles epidemiology. However, in order to predict the future dynamics of measles and to evaluate the effectiveness of immunization programmes, the model needs to be improved in several aspects. First of all, demographic projections are required, accounting for changes in birth rates, immigration trends and mortality rates by age. Moreover, as highlighted by the conducted sensitivity analysis, the model should be enriched by accounting for structured contacts [29–31], for instance by age [20,21]. In fact, homogeneous mixing models, such as the one introduced in this paper, tend to overestimate the overall number of cases [32]. While this may not be an important issue when analysing historical data, where cases occur almost only in children and the majority of still susceptible children get infected during the same epidemic season, accounting for heterogeneous contacts by age (or social context) becomes more relevant during the disease elimination process, which is instead characterized by smaller numbers of cases, shift of the age at infection from childhood to older ages, spatially localized outbreaks and small clusters of secondary cases in high schools and universities. Another important feature that is needed to decipher the impact of demographic transition and immunization programmes, but that is missing in this model, is the spatial structure. Accounting for differences in population density [10] and patterns of human mobility [33–35] could help to explain large regional differences in terms of case incidence and average age at infection. However, retrieving longitudinal/historical mobility data to determine the strength of the connections between spatially distinct populations is a very hard task.
In general, our results recommend the introduction of a new class of models that deviate the age distribution from stationary equilibrium solutions by accounting for demographic changes. This will make it possible to deeply understand epidemiologic features of infectious diseases and, from the public health perspective, to better evaluate the short- to medium-term effects of mass vaccination programmes for endemic diseases, notably in developing countries that are undergoing dramatic demographic changes.
Acknowledgements
The authors thank the anonymous reviewers for their comments, Laura Fumanelli and Alessia Melegaro for comments on an early version of the manuscript.
Funding statement
This work was partially supported by the EU FP7 Epiwork project for research funding. The funders had no role in study design, data collection and analysis, decision to publish or preparation of the manuscript.
References
- 1.Muscat M, Bang H, Wohlfhrt J, Glismann S, Molbak K. 2009. Measles in Europe: an epidemiological assessment. Lancet 373, 383–389 (doi:10.1016/S0140-6736(08)61849-8) [DOI] [PubMed] [Google Scholar]
- 2.EUVACNET A surveillance community network for vaccine preventable infectious diseases. Status of measles surveillance data See http://www.euvac.net/graphics/euvac/status_2011.html (accessed 9 August 2012). [DOI] [PubMed]
- 3.Filia A, et al. 2011. Measles in Italy, July 2009 to September 2010. Euro Surveill. 16, pii.19925. [PubMed] [Google Scholar]
- 4.World Health Organization (WHO) 2010. Renewed commitment to measles and rubella elimination and prevention of congenital rubella syndrome in the WHO European Region by 2015. Moscow, Russia: WHO Regional Office for Europe; See http://www.euro.who.int/en/who-we-are/governance/regional-committee-for-europe/past-sessions/sixtieth-session/documentation/working-documents/eurrc6015 (accessed 9 August 2013). [Google Scholar]
- 5.Bolker BM, Grenfell BT. 1993. Chaos and biological complexity in measles dynamics. Proc. R. Soc. Lond. B 251, 75–81 (doi:10.1098/rspb.1993.0011) [DOI] [PubMed] [Google Scholar]
- 6.Keeling MJ, Grenfell BT. 1997. Disease extinction and community size: modeling the persistence of measles. Science 275, 65–67 (doi:10.1126/science.275.5296.65) [DOI] [PubMed] [Google Scholar]
- 7.Earn DJD, Rohani P, Bolker BM, Grenfell BT. 2000. A simple model for complex dynamical transitions in epidemics. Science 287, 667–670 (doi:10.1126/science.287.5453.667) [DOI] [PubMed] [Google Scholar]
- 8.Grassly N, Fraser C. 2008. Seasonal infectious disease epidemiology. Proc. R. Soc. B 273, 2541–2550 (doi:10.1098/rspb.2006.3604) [DOI] [PMC free article] [PubMed] [Google Scholar]
- 9.Ferrari MJ, Grais RF, Bharti N, Conlan AJK, Bjørnstad ON, Wolfson LJ, Guerin PJ, Djibo A, Grenfell BT. 2008. The dynamics of measles in sub-Saharan Africa. Nature 451, 679–684 (doi:10.1038/nature06509) [DOI] [PubMed] [Google Scholar]
- 10.Bharti N, Tatem AJ, Ferrari MJ, Grais RF, Djibo A, Grenfell BT. 2011. Explaining seasonal fluctuations of measles in Niger using nighttime lights imagery. Science 334, 1424–1427 (doi:10.1126/science.1210554) [DOI] [PMC free article] [PubMed] [Google Scholar]
- 11.Bjornstad O, Finkenstadt BF, Grenfell BT. 2002. Dynamics of measles epidemics: estimating scaling of transmission rates using a time series SIR model. Ecol. Monogr. 72, 169–184 (doi:10.2307/3100023) [Google Scholar]
- 12.Anderson RM, May RM. 1992. Infectious diseases of humans: dynamics and control. Oxford, UK: Oxford University Press [Google Scholar]
- 13.Edmunds WJ, Gay NJ, Kretzschmar M, Pebody RG, Wachmann H. 2000. The pre-vaccination epidemiology of measles, mumps and rubella in Europe: implications for modeling studies. Epidemiol. Infect. 125, 635–650 (doi:10.1017/S0950268800004672) [DOI] [PMC free article] [PubMed] [Google Scholar]
- 14.Finkenstadt BF, Grenfell BT. 2000. Time series modeling of childhood disease: a dynamical system approach. J. R. Stat. Soc. C 49, 187–205 (doi:10.1111/1467-9876.00187) [Google Scholar]
- 15.Iannelli M, Manfredi P. 2007. Demographic change and immigration in age-structured epidemiological models. Math. Popul. Stud. 14, 169–191 (doi:10.1080/08898480701426241) [Google Scholar]
- 16.Santoro R, Ruggeri FM, Battaglia M, Rapicetta M, Grandolfo ME, Annesi I, Cortellessa CM. 1984. Measles epidemiology in Italy. Int. J. Epidemiol. 13, 201–209 (doi:10.1093/ije/13.2.201) [DOI] [PubMed] [Google Scholar]
- 17.Gabutti G, Rota MC, Salmaso S, Bruzzone BM, Bella A, Crovari P, the Serological Study group 2002. Epidemiology of measles, mumps and rubella in Italy. Epidemiol. Infect. 129, 543–550 (doi:10.1017/S0950268802007677) [DOI] [PMC free article] [PubMed] [Google Scholar]
- 18.Rota MC, Massari M, Gabutti G, Guido M, De Donno A, Atti MLCd. 2008. Measles serological survey in the Italian population: interpretation of results using mixture model. Vaccine 26, 4403–4409 (doi:10.1016/j.vaccine.2008.05.094) [DOI] [PubMed] [Google Scholar]
- 19.Eurostat 2011. Migrants in Europe. A statistical portrait of the first and second generation See http://epp.eurostat.ec.europa.eu/cache/ITY_OFFPUB/KS-31–10–539/EN/KS-31–10–539-EN.PDF (accessed 9 August 2013).
- 20.Mossong J, et al. 2008. Social contacts and mixing patterns relevant to the spread of infectious diseases. PLoS Med. 5, e74 (doi:10.1371/journal.pmed.0050074) [DOI] [PMC free article] [PubMed] [Google Scholar]
- 21.Fumanelli L, Ajelli M, Manfredi P, Vespignani A, Merler S. 2012. Inferring the structure of social contacts from demographic data in the analysis of infectious diseases spread. PLoS Comput. Biol. 8, e1002673 (doi:10.1371/journal.pcbi.1002673) [DOI] [PMC free article] [PubMed] [Google Scholar]
- 22.Dorigatti I, Cauchemez S, Pugliese A, Ferguson NM. 2012. A new approach to characterising infectious disease transmission dynamics from sentinel surveillance: application to the Italian 2009–2010 A/H1N1 influenza pandemic. Epidemics 4, 9–21 (doi:10.1016/j.epidem.2011.11.001) [DOI] [PMC free article] [PubMed] [Google Scholar]
- 23.Diekmann O, Heesterbeek JAP, Metz JAJ. 1990. On the definition and the computation of the basic reproduction ratio R0 in models for infectious diseases in heterogeneous populations. J. Math. Biol. 28, 365–382 (doi:10.1007/BF00178324) [DOI] [PubMed] [Google Scholar]
- 24.May RM. 1986. Biomathematics, vol. 17, pp. 405–442 Berlin, Germany: Springer [Google Scholar]
- 25.Salmaso S, Rota MC, Ciofi Degli Atti ML, Tozzi AE, Kreidl P. 1999. Infant immunization coverage in Italy: estimates by simultaneous EPI cluster surveys of regions. Bull. WHO 77, 843–851 [PMC free article] [PubMed] [Google Scholar]
- 26.Mortara G. 1925. La Salute Pubblica in Italia Durante e Dopo la Guerra. New Haven, CT: Yale University Press; [In Italian] [Google Scholar]
- 27.Lucioni C, et al. 2000. Measles vaccination policy in Palermo (Sicily) in the mid-nineties: a cost–benefit evaluation. J. Prev. Med. Hyg. 41, 1–12 [Google Scholar]
- 28.Williams JR, Manfredi P, Butler AR, Ciofi degli Atti M, Salmaso S. 2003. Heterogeneity in regional notification patterns and its impact on aggregate national case notification data: the example of measles in Italy. BMC Pub. Health 3, 23 (doi:10.1186/1471-2458-3-23) [DOI] [PMC free article] [PubMed] [Google Scholar]
- 29.Ferguson NM, Cummings DAT, Cauchemez S, Fraser C, Riley S, Meeyai A, Iamsirithaworn S, Burke DS. 2005. Strategies for containing an emerging influenza pandemic in Southeast Asia. Nature 437, 209–214 (doi:10.1038/nature04017) [DOI] [PubMed] [Google Scholar]
- 30.Cauchemez S, Valleron AJ, Boelle P-Y, Flahault A, Ferguson NM. 2008. Estimating the impact of school closure on influenza transmission from Sentinel data. Nature 452, 750–754 (doi:10.1038/nature06732) [DOI] [PubMed] [Google Scholar]
- 31.Merler S, Ajelli M, Pugliese A, Ferguson NM. 2011. Determinants of the spatiotemporal dynamics of the 2009 H1N1 pandemic in Europe: implications for real-time modelling. PLoS Comput. Biol. 7, e1002205 (doi:10.1371/journal.pcbi.1002205) [DOI] [PMC free article] [PubMed] [Google Scholar]
- 32.Ajelli M, Gonçalves B, Balcan D, Colizza V, Hu H, Ramasco JJ, Merler S, Vespignani A. 2010. Comparing large-scale computational approaches to epidemic modeling: agent-based versus structured metapopulation models. BMC Infect. Dis. 10, e190 (doi:10.1186/1471-2334-10-190) [DOI] [PMC free article] [PubMed] [Google Scholar]
- 33.Viboud C, Bjørnstad ON, Smith DL, Simonsen L, Miller MA, Grenfell BT. 2006. Synchrony, waves, and spatial hierarchies in the spread of influenza. Science 312, 447–451 (doi:10.1126/science.1125237) [DOI] [PubMed] [Google Scholar]
- 34.Colizza V, Barrat A, Barthelemy M, Valleron AJ, Vespignani A. 2007. Modeling the worldwide spread of pandemic influenza: baseline case and containment interventions. PLoS Med. 4, e13 (doi:10.1371/journal.pmed.0040013) [DOI] [PMC free article] [PubMed] [Google Scholar]
- 35.Merler S, Ajelli M. 2010. The role of population heterogeneity and human mobility in the spread of pandemic influenza. Proc. R. Soc. B. 277, 557–565 (doi:10.1098/rspb.2009.1605) [DOI] [PMC free article] [PubMed] [Google Scholar]