

Abstract
Trade-offs arise when two functional traits impose conflicting demands on the same design trait. Consequently, excellence in one comes at the cost of performance in the other. One of the most widely studied performance trade-offs is the one between sprint speed and endurance. Although biochemical, physiological and (bio)mechanical correlates of either locomotor trait conflict with each other, results at the whole-organism level are mixed. Here, we test whether burst (speed, acceleration) and sustained locomotion (stamina) trade off at both the isolated muscle and whole-organism level among 17 species of lacertid lizards. In addition, we test for a mechanical link between the organismal and muscular (power output, fatigue resistance) performance traits. We find weak evidence for a trade-off between burst and sustained locomotion at the whole-organism level; however, there is a significant trade-off between muscle power output and fatigue resistance in the isolated muscle level. Variation in whole-animal sprint speed can be convincingly explained by variation in muscular power output. The variation in locomotor stamina at the whole-organism level does not relate to the variation in muscle fatigue resistance, suggesting that whole-organism stamina depends not only on muscle contractile performance but probably also on the performance of the circulatory and respiratory systems.
Keywords: trade-off, locomotion, whole-organism, muscle
1. Introduction
Performance trade-offs are fundamental to understanding the large phenotypic diversity found among individuals, populations or species. Apart from originating because of physiological reasons [1], performance trade-offs may also arise when two functional traits cannot be optimized simultaneously as they pose conflicting demands on the same design feature. Consequently, excellence in one trait will come at the cost of performance in the other. Thus, a trade-off may result in a compromise phenotype (i.e. an individual performing sub-optimally for both traits), and as such may represent a constraint on evolution [2,3], or conversely, an organism may specialize in one trait at the expense of the other, in which case a trade-off may facilitate phenotypic differentiation [4–6].
Locomotor performance trade-offs have been extensively studied as the locomotor system is typically involved in executing multiple tasks (e.g. sprinting, manoeuvring, long-distance running, fighting), which may be dependent on the same design features (e.g. limb length, muscle mass, metabolic rates) in opposing ways (e.g. [7–10]). Of these trade-offs, the one between sprint speed and endurance is probably the most widely studied (e.g. mammals [9,11–13]; reptiles [7,14–16]; frogs [17,18]; fish [19,20]). Results of these studies are mixed despite the fact that a negative relationship between burst and sustained locomotion would seem intuitive owing to the contrasting biochemical and physiological features associated with these types of locomotion. Whereas fast-contracting, easily fatigued fast-twitch glycolytic (FG) muscle fibres are associated with sprinting and acceleration [21–24], fast-twitch oxidative glycolytic (FOG) muscle fibres, conferring both speed and endurance, are associated with lower-intensity activity over more extended periods of time [25–27]. In addition, in a single muscle, the proportion of FG fibres is negatively correlated with the proportion of FOG fibres [26,28,29]. Also, at the whole-muscle level, a trade-off exists whereby muscles producing high-power output are less fatigue-resistant and fatigue-resistant muscles produce less power [17,30–32].
Because muscles power movement, performance at the whole-animal level can be expected to be the net result of the performance of the underlying traits of skeletal muscle and the supporting cardiovascular and respiratory systems. However, it remains unclear whether and how physiological and muscular trade-offs translate into a performance trade-off at the whole-organism level. The one study explicitly testing for the existence of a trade-off at both the isolated-muscle and whole-organism levels reported incongruent results: whereas power output and fatigue resistance of the peroneus muscle in individual Xenopus laevis frogs were negatively correlated, individual burst and sustained swimming capacity of the whole animal were not [17]. Also, the hypothesized link between whole-organism locomotor performance and muscle mechanics often remains unclear. Apart from a few cases in which muscle power output was correlated directly to whole-animal locomotor speed and acceleration [23,33], other studies have failed to link inter-individual variation in muscle mechanics with differences in whole-organism performance [17,22,32].
Here, we explicitly investigate the fast versus sustained locomotion trade-off at two levels of organization (i.e. at the isolated-muscle and at the whole-organism levels) by comparing data among 17 lacertid lizard species. By linking muscular with organismal performance, we aim to elucidate the mechanistic basis of the hypothesized performance trade-off. We do so in an interspecific comparison, as the variation among species is typically greater than among individuals (cf. [17]) and may reflect the range of potential functional trade-offs that limit the evolution of performance [32]; we specifically opted to use lacertid lizards as a trade-off between speed and endurance has been shown to exist in locomotor performance in a subset of these species [7].
In addition to stamina and sprint speed, we also quantify acceleration capacity as a second type of fast explosive locomotion. Organisms in general, and lizards more specifically, typically use intermittent locomotion, during which they continuously accelerate and decelerate as their primary mode of movement. Acceleration capacity may therefore be of prime ecological relevance [34,35]. In addition, acceleration capacity has been previously shown to correlate with the proportion of FG fibres in a muscle [24] and with muscular power output [23,33]. Because the physiological and muscle mechanical correlates of burst acceleration may conflict with those of sustained locomotion (see above), a trade-off between acceleration and stamina at the whole-organism level can be expected. Empirical evidence for the existence of an acceleration–stamina trade-off, however, is scarce and ambiguous [18].
To measure whole-muscle performance, we here use the work loop technique, which evaluates the work and power output of the whole muscle in vitro while simulating its movement in vivo [36–38]. We chose to use the iliotibialis muscle, a cylindrical, parallel-fibred thigh muscle that functions primarily as knee extensor in reptiles [39–43]. Specifically, knee extensors have been shown to be of prime importance for the locomotor performance traits under study here, as the variation in knee extensor muscle mass is the principal determinant of variation in acceleration capacity and sprint speed in Anolis lizards [34].
Using an interspecific comparative approach, we ask (i) whether the variation in fast, explosive locomotor performance (sprint speed, acceleration) among lacertid lizard species is negatively correlated with the variation in sustained locomotor performance (stamina); (ii) whether the variation in iliotibialis muscular power output among lacertid lizard species is negatively correlated with the variation in iliotibialis muscle fatigue resistance; (iii) whether the variation in fast, explosive locomotor performance among lacertid lizard species is positively correlated with the variation in iliotibialis muscle power output; and (iv) whether the variation in sustained locomotor performance among lacertid lizard species is positively correlated with the variation in iliotibialis muscle fatigue resistance.
2. Material and methods
(a). Animals
Between November 2010 and June 2012, we quantified whole-organism locomotor performance and muscle performance in 17 lacertid species that were wild-caught, laboratory-bred or obtained through the pet trade. Upon arrival in the laboratory, we measured snout–vent length (SVL) of each individual to the nearest 0.01 mm, using digital callipers (Mitutoyo CD-15DC). We started the locomotor performance trials within two to six weeks after the animals arrived in the laboratory, with the exception of the laboratory-bred individual of Podarcis melisellensis. During experimentation, we did not observe any noticeable difference in performance capacity or behaviour between wild-caught or pet trade species.
Lizards were kept in the animal room of the Lab of Functional Morphology at the University of Antwerp, set at a 10 D : 14 L cycle and at a temperature of 28°C. Lacerta bilineata, Lacerta lepida and Psammodromus algirus were housed individually in terraria of 0.6 × 0.6 m. Other lizard species were housed with a maximum of five individuals per cage in cages of 0.5 × 1 m. Cages were equipped with a 75 or 100 W light bulb, according to the cage size, providing extra light and heat for 10 h per day. Rocks, branches and leaf litter were scattered on the cage bottom to provide basking and hiding spots. Lizards were fed crickets (Achetus domesticus) dusted with calcium and vitamin supplements three times per week. In addition to providing water ad libitum in water bowls, cages were sprayed with water twice a week.
(b). Locomotor performance
(i). Sprint speed
We quantified sprint speed following standard procedures (cf. [7,44]). Each individual was chased five times down a 2 m long electronic racetrack, with a cork substrate, equipped with photocells every 25 cm. Each run was scored as ‘good’ or ‘bad’ depending on the individual's willingness to run (cf. [45,46]). We would call a run a ‘good’ run if the lizard ran continuously, in the middle of the track, over a distance of at least 50 cm; in a bad run the animal frequently stopped and turned, and/or jumped from side to side. Bad runs were not included in further analyses. Prior to the start of the experiment, and between trials, lizards were placed in an incubator set at the species-selected body temperature (i.e. at 35°C for all species, except for Latastia longicaudata, in which case the incubator was set at 38°C [7]) for at least an hour. These temperatures are within the range of field-active body temperatures (cf. review in [47]). As an estimate of a lizard's maximal sprinting capacity, we used maximal speed attained over any 25 cm interval of the five trials.
(ii). Acceleration
We quantified acceleration capacity of each lizard on a 2 m long racetrack with a cork substrate. A dot was painted dorsally, at the level of the hip on each individual lizard, using a non-toxic white paint pen, to facilitate subsequent digitization. Each individual was tested five times. Prior to the start of the experiment and between trials, lizards were placed in an incubator set at 35°C (38°C for L. longicaudata) for at least an hour. A high-speed video camera (Redlake Motionscope) set at 500 Hz was placed 1 m above the track so that the first 0.5 m of the track was in view, filming the lizards dorsally when accelerating from a standstill. A scaling grid of known dimensions was filmed before the start of each filming session and was digitized (ProAnalyst v. 1.5.3.8) to calculate the scaling factor. Clips were subsequently digitized at 500 Hz, using the (semi-)automatic tracking option in ProAnalyst. Digitization started at least 20 frames prior to any movement by the lizard and stopped when the lizard ran out of view. We subsequently exported the scaled (in m) displacement coordinates to Excel (Microsoft Corp.) and filtered the data using a fourth-order zero-phase shift Butterworth low-pass data noise filter (VBA for Excel [48]) at 40 Hz. Based on the filtered data, the first and second derivatives of displacement against time were calculated and the latter was used as a measure of instantaneous acceleration. In 99% of the cases, the acceleration profile (i.e. instantaneous acceleration plotted over time) showed a clear peak before the end of the sequence. Cases in which this was not true were not withheld for further analyses. As an estimate of an individual's maximum acceleration capacity, we used the maximum instantaneous acceleration out of any of the five trials.
(iii). Stamina
We quantified stamina on a circular track with a cork substrate and a circumference of 2.5 m (cf. [18,49]). Each individual was tested three times with trials spread over two consecutive days. A trial was considered terminated if a lizard did not respond to multiple taps on the tail base and did not show a righting response when placed on its back (cf. [50]). Prior to the start of the experiment, lizards were placed in an incubator set at 35°C (38°C for L. longicaudata) for at least an hour. Between trials on the same day, this period was extended to at least two hours. As an estimate of a lizard's maximal stamina, we used the maximal time to exhaustion (in s) out of the three trials.
Our estimates of maximum performance are based on the performance of a limited number of individuals in a limited number of trials. We acknowledge the fact that some of the estimates may in fact represent submaximal performance.
(c). Muscle mechanics
(i). Muscle preparation
After quantification of all locomotor performance traits (i.e. maximum sprint speed, acceleration and stamina), one to six individuals of each species were transported to the laboratory at Coventry University (see electronic supplementary material, table S1). Animals were killed by decapitation and transection of the spinal cord in accordance with the British Home Office Animals Scientific Procedures Act 1986, Schedule 1. Immediately after having been killed, lizards were transferred to a bath with oxygenated (95% O2; 5% CO2) lizard Ringer's solution [51] where the m. iliotibialis was isolated from the left hind-limb. For each muscle, bone was left intact at the origin and the insertion.
(ii). Twitch and tetanic kinetics
For each muscle preparation the bone at one end was clamped via crocodile clips to a calibrated load cell (UF1, Pioden Controls, Canterbury, UK) and the bone at the other end was clamped to a motor arm attached to a calibrated linear variable displacement transducer at the other. Each muscle was maintained at 34.0 ± 0.5°C in circulating oxygenated lizard Ringer solution. Each preparation was stimulated via parallel platinum electrodes while being held at constant length to generate a series of twitches. Stimulus amplitude and muscle length were adjusted to maximize isometric twitch force. Square wave stimulus pulse width was set at 2.0 ms. The muscle length that yielded maximal twitch force was measured to the nearest 0.1 mm using a dissecting microscope fitted with an eyepiece graticule. An isometric tetanic force response was elicited by subjecting the muscle to a 200 ms train of stimulation (individual pulse width: 2 ms). Stimulation frequency was then altered to determine maximal tetanic force. A rest period of 5 min was allowed between each tetanic response (cf. [51,52]). For the maximal tetanus of each individual muscle measurements were made of the time taken from stimulus to maximal tetanus force and the time from last stimulus to half force relaxation.
(iii). Work loop measurements
The work loop technique was used to determine the power output of muscles during cyclical length changes [36]. Each muscle preparation was subjected to a set of four sinusoidal length changes, starting from the length that was optimal for maximal twitch force production. The muscle stimulation parameters (stimulation frequency and amplitude) found to yield maximal isometric force were used. Electrical stimulation and length changes were controlled via a D/A board (KUSB3116) and a customized program produced using Testpoint software (CEC Testpoint v. 7). For each work loop cycle muscle force was plotted against muscle length to generate a work loop, the area of which equated to the network produced by the muscle during the cycle of length change [36]. Instantaneous power output was calculated for every data point in each work loop (1000 data points per work loop) by multiplying instantaneous velocity by instantaneous force. Instantaneous power output values were averaged to generate an average power output for each length change cycle. The total strain of length change cycles was optimized at each cycle frequency. The cycle frequency of length change was altered, up and down, within the range of 2–26 Hz (the range varied depending on the species) to generate power-output cycle frequency curves. During these length changes, the muscle was subjected to phasic stimulation (active work loop cycles). Every 5 min the muscle was subjected to a further set of four work loop cycles with stimulation duration and stimulation phase parameters being altered until power was maximized at each cycle frequency. Before the fatigue run, a set of control sinusoidal length change and stimulation parameters were imposed on the muscle every four to five sets of work loops to monitor variation in the muscles ability to produce power/force. Any variation in power was found to be because of a matching change in ability to produce force. Therefore, the power produced by each preparation, prior to the fatigue run, was corrected to the control run that yielded the highest power output, assuming that alterations in power-generating ability were linear over time. At the end of experimentation muscles produced 94.9 ± 6.9% (mean ± s.d.) of their maximal control run power output. We used the maximum power produced by any of the runs as an estimate of an individual's maximum muscle power output.
Each muscle, on completion of the power-output cycle frequency curve, was subjected to a fatigue run consisting of 120 work loop cycles at a cycle frequency of 8 Hz using the stimulation pattern that had yielded peak power at that cycle frequency. As an estimate of an individual's muscle fatigue resistance, we used the proportion of power output at loop 12 to power output at loop 1. An example of a work loop of a non-fatigued versus a fatigued muscle is shown in electronic supplementary material, figure S1.
At the end of the muscle mechanics experiments, the bones and tendons were removed and each muscle was blotted on absorbent paper to remove excess Ringer's solution. Wet muscle mass was determined to the nearest 0.01 mg using an electronic balance (Mettler-Toledo). Normalized muscle power output (i.e. maximum average power output per length change cycle divided by wet muscle mass, measured in W kg−1 muscle mass) was used as an estimate of an individual's muscle-mass-specific power output.
(d). Statistical analyses
Mean values of SVL, whole-organism performance traits (i.e. sprint speed, acceleration and stamina) and muscle traits (i.e. absolute muscle power output, mass-specific muscle power output and fatigue resistance) were calculated for each species. Raw data of all traits measured (means ± s.e. per species) are presented in the electronic supplementary material, table S1. All, except fatigue resistance, were logarithmically (log 10) transformed prior to subsequent analyses. As fatigue resistance is expressed as a proportion, we transformed it using an arcsine transformation [53].
To test for trade-offs at both levels of organization, we performed bivariate correlations between the whole-organism performance traits (i.e. sprint speed versus stamina, acceleration versus stamina) and between muscle performance traits (i.e. absolute power output versus fatigue resistance, mass-specific power output versus fatigue resistance). To test which (of the variation in) muscle performance traits best explained the variation in whole-organism performance traits, we performed a multiple regression analysis (backward elimination method), with speed or acceleration as a dependent variable, and absolute power output and mass-specific power output as independent variables in each case. For stamina, we used regression analysis with stamina as the dependent variable and fatigue resistance as an independent variable. We re-did these analyses using the residual values of all traits (i.e. regressed against SVL) as input variables.
Because species share parts of their evolutionary history, they cannot be regarded as independent data points, as is required when performing traditional statistical analyses [54–56]. We used the phylogenetic independent contrast approach to take into account the phylogenetic relationships among the 17 lacertid species under study here. The independent contrast approach requires input of the topology and branch lengths of the phylogenetic tree. We combined results from several mitochondrial DNA studies [57–61] to compile a current best tree for the 17 species used (see electronic supplementary material, figure S2). Because divergence times among these species remain largely unknown, all branch lengths were set to unity. To check whether branch lengths were adequate, we plotted the diagnostic graphs (PDAP module in Mesquite [62]) and tested whether absolute values of standardized contrasts were correlated with their standard deviations [63]. Because in some cases the absolute values were correlated with their standard deviations (indicating that branch lengths were not adequate), we transformed branch lengths using Pagel's arbitrary branch length transformation, followed by Grafen's transformation with ρ set to 0.5.
We calculated independent contrasts (ICs) for all variables using the PDAP module in Mesquite v. 2.74 [62,64]. Using these ICs as input variables, we performed the bi-variate correlation and multiple regression analyses (through the origin) as described above. Residuals of the IC of all whole-organism and muscle performance traits against the IC of SVL were calculated. All analyses were rerun using the residual ICs as input variables. Reported p-values are of one-tailed tests.
In addition, we calculated the amount of phylogenetic signal present in all traits (absolute and size-corrected), as outlined by Blomberg et al. [65].
3. Results
Because none of the Lacerta agilis and P. melisellensis runs was scored as ‘good’ in the whole-organism performance trials, they were discarded from further analyses. Also, the muscle performance of the only L. lepida individual tested was very distinct (i.e. high mass-specific power output) from that of the 16 other species, and was not used in further analyses.
Non-phylogenetic bivariate correlations were non-significant for sprint speed and stamina, both in absolute and relative (to SVL) terms (table 1; figure 1a). The relationship between acceleration capacity and stamina tended to be positive, both in absolute and relative terms (table 1; figure 1c).
Table 1.
Bivariate correlations between burst and sustained locomotion at the whole-animal (i.e. sprint speed and acceleration versus stamina) and isolated-muscle levels (i.e. absolute power output and muscle mass-specific power output versus fatigue resistance). Both the results of non-phylogenetic traditional analyses and phylogenetic analyses, using the independent contrast approach, are shown. Also, results are given for both absolute values and residuals (against SVL). CI: 95% confidence intervals for the unstandardized coefficient. All tests are one-tailed. Significant relationships are shown in bold; trends in italic.
| whole-animal performance | |||||
|---|---|---|---|---|---|
| stamina |
|||||
| non-phylogenetic (n = 15) |
phylogenetic (n = 14) |
||||
| absolute | residual | absolute | residual | ||
| sprint speed | r | −0.10 | −0.06 | −0.19 | −0.25 |
| F | 0.14 | 0.045 | 0.49 | 0.85 | |
| p | 0.36 | 0.42 | 0.25 | 0.19 | |
| CI | −0.58 to 0.41 | −0.46 to 0.38 | −0.63 to 0.32 | −0.54 to 0.22 | |
| acceleration | r | 0.45 | 0.50 | 0.43 | 0.47 |
| F | 3.34 | 4.61 | 2.87 | 3.68 | |
| p | 0.09* | 0.058* | 0.11* | 0.08* | |
| CI | −0.06 to 0.67 | −0.01 to 0.67 | −0.08 to 0.69 | −0.04 to 0.63 | |
| muscle mechanics | |||||
|---|---|---|---|---|---|
| fatigue resistance |
|||||
| non-phylogenetic (n = 16) |
phylogenetic (n = 15) |
||||
| absolute | residual | absolute | residual | ||
| absolute power | r | −0.49 | 0.14 | −0.41 | 0.20 |
| F | 4.3 | 0.26 | 2.85 | 0.59 | |
| p | 0.029 | 0.62* | 0.06 | 0.46* | |
| CI | −3.64 to 0.06 | −1.55 to 2.53 | −2.94 to 0.35 | −1.29 to 2.73 | |
| mass-specific power | r | −0.69 | −0.44 | −0.58 | −0.24 |
| F | 12.93 | 3.37 | 7.04 | 0.87 | |
| p | 0.001 | 0.044 | 0.01 | 0.17 | |
| CI | −2.00 to −0.51 | −1.97 to 0.15 | −1.83 to −0.19 | −1.71 to 0.68 | |
*p-value for two-tailed test.
Figure 1.

Bivariate correlation between burst and sustained locomotion at the whole-organism level with the variation in body size (SVL) taken into account. (a,c) Results for traditional analyses, not taking phylogeny into account; (b,d) results for their phylogenetic counterparts. (a,b) residual sprint speed is not significantly correlated to residual stamina (r = −0.06, p = 0.42 and r = −0.25, p = 0.19, respectively) and (c,d) residual acceleration capacity tends to be positively correlated to residual stamina (r = 0.50, p = 0.06 and r = 0.47, p = 0.08, respectively).
Results from phylogenetic correlation analyses using the IC and residual IC of the whole-organism performance traits as input variables were similar, although there was a slight tendency for residual sprint speed and residual stamina to be negatively correlated (table 1; figure 1b,d).
As for the non-phylogenetic correlations between muscle performance traits, power output was negatively correlated to fatigue resistance, both in absolute and relative (to SVL) terms. Absolute mass-specific power output was negatively correlated to absolute fatigue resistance, but the relationship between the residuals was non-significant (table 1; figure 2a). Results for the phylogenetic analyses, using the IC and residual IC as input variables, were similar, except for the relationship between residual power output and residual fatigue resistance, which showed only a slightly negative trend (table 1; figure 2b).
Figure 2.
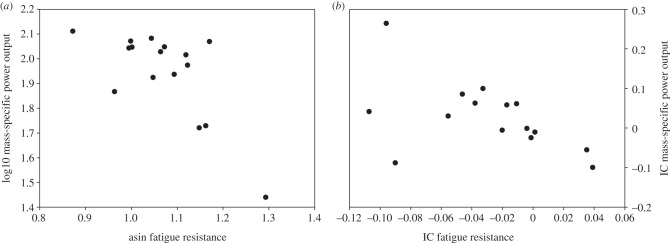
Bivariate correlation between iliotibialis muscle mass-specific power output and iliotibialis muscle fatigue resistance. Mass-specific power output is negatively correlated to fatigue resistance when using both (a) traditional non-phylogenetic analyses (r = −0.69, p = 0.001) and (b) phylogenetic analyses (r = −0.58, p = 0.01).
The multiple regression analysis with sprint speed as the dependent variable, and power output and mass-specific power output as independent variables, resulted in a highly significant model in which only the variation of absolute muscle power output was withheld. The same analysis using the residuals resulted in a similar model (table 2; figure 3a). This was also true for the phylogenetic analyses, using the IC and residual IC of sprint speed, absolute and mass-specific power output (table 2; figure 3b). A multiple regression analysis using acceleration as the dependent variable, and power output and mass-specific power output as independent variables, did not result in a significant model. Neither did the regression analyses using residuals, IC or residual IC of acceleration, power output and mass-specific power output (table 2). The multiple regression analysis with stamina as the dependent variable and fatigue resistance as the independent variable did not result in a significant model, although the variation in stamina tended to be negatively correlated to the variation in fatigue resistance (table 2). When using IC and residual IC of stamina and fatigue resistance, we did not obtain any significant models (table 2).
Table 2.
Multiple regressions (backward elimination method) with locomotor performance traits (i.e. sprint speed, acceleration, stamina) as dependent variables, and relevant isolated muscle performance traits (i.e. muscle absolute power output, muscle mass-specific power output, muscle fatigue resistance) as independent variables. The results of both non-phylogenetic traditional analyses and phylogenetic analyses, using the independent contrast approach, are shown. Also, results are given for both absolute values and residuals (against SVL). All tests are one-tailed. CI: 95% confidence intervals for the unstandardized coefficient. Significant models, and the variable withheld, are shown in bold; trends in italic. If none of the models was significant, the results are given for the full model (CI not shown).
| non-phylogenetic |
phylogenetic |
|||||
|---|---|---|---|---|---|---|
| dependent | independent | absolute | residual | absolute | residual | |
| sprint speed | absolute power | R | 0.69 | 0.52 | 0.77 | 0.63 |
| mass-specific power | r2 | 0.47 | 0.27 | 0.59 | 0.40 | |
| F(d.f.,d.f.) | 10.73(1,13) | 4.49(1,13) | 17.13(1,12) | 7.9(1,12) | ||
| P | 0.0035 | 0.028 | 0.0005 | 0.008 | ||
| CI | 0.09 to 0.43 | −0.01 to 0.51 | 0.14 to 0.44 | 0.06 to 0.48 | ||
| acceleration | absolute power | r | 0.36 | 0.14 | 0.33 | 0.07 |
| mass-specific power | r2 | 0.13 | 0.02 | 0.11 | 0.006 | |
| F(d.f.,d.f.) | 0.84(2,13) | 0.11(2,13) | 0.66(2,12) | 0.03(2,12) | ||
| p | 0.23 | 0.45 | 0.27 | 0.49 | ||
| stamina | fatigue resistance | r | 0.26 | −0.50 | −0.15 | −0.31 |
| r2 | 0.07 | 0.25 | 0.02 | 0.09 | ||
| F(d.f.,d.f.) | 0.88(1,13) | 3.99(1,13) | 0.28(1,12) | 1.23(1,12) | ||
| p | 0.18 | 0.072* | 0.61* | 0.29* | ||
*p-value for two-tailed test.
Figure 3.
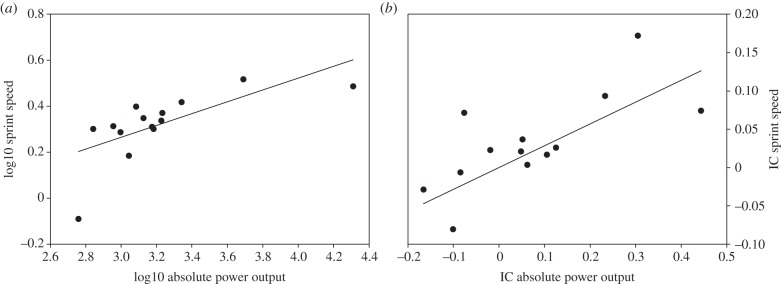
Regression between sprint speed and iliotibialis muscle power production. The variation in sprint speed is explained by the variation in absolute power output when using both (a) traditional non-phylogenetic analyses (r = 0.69, p = 0.0035) and (b) phylogenetic analyses (r = 0.77, p = 0.0005).
None of the traits showed a significant amount of phylogenetic signal, suggesting that these traits are not evolutionarily conserved (see electronic supplementary material, table S2).
4. Discussion
(a). Trade-offs
We find evidence, at the isolated muscle level, for a trade-off between fast and sustained locomotion among the 17 lacertid lizard species under study here. The trade-off between muscle power output and fatigue resistance, however, is not convincingly mirrored by a trade-off at the whole-animal level. Similarly, a trade-off between isolated muscle power production and muscle fatigue resistance was not translated into a trade-off between burst and sustained sprinting/swimming performance at the whole-organism level in previous studies on individual variation within species of frogs and mice [17,30,31]. The complex interplay with other muscles involved in locomotion, or with other non-muscular physiological factors associated with aerobic capacity, motivational and behavioural differences, were all factors previously hypothesized to mask the speed–endurance trade-off at the level of the whole animal [17].
We note, however, that the absence of a trade-off between sprint speed and stamina contradicts an earlier study, which showed that speed and endurance were negatively correlated among 12 lacertid lizard species [7]. However, whereas in the previous study we measured endurance (i.e. time till exhaustion when lizards were running at a low constant speed on a treadmill), in the present study we measured stamina (i.e. time till exhaustion when lizards were running at their ‘preferred’ speed(s) on a circular track). In fact, for the four species that were used in both studies (i.e. L. longicaudata, Podarcis muralis, Podarcis sicula and L. bilineata), the relationship between stamina and endurance, if anything, tends to be negative (r = −0.70, p = 0.30). We acknowledge the fact that endurance and stamina might represent two different measures of sustained locomotion, encompassing different demands upon the locomotor system. In addition, in the same previous study [7], ecological differences among species seemed to explain some of the variation in locomotor performance. Ecological differences between species could also account for some of the unexplained variation between species in locomotor performance observed in the present study.
Contrary to our expectations, however, the variation in acceleration capacity tends to be positively correlated to the variation in stamina, in both absolute and relative terms. This is surprising, as acceleration capacity (an explosive anaerobic locomotor event) and stamina (a sustained aerobic locomotor event) are predicted to pose conflicting demands on the fibre-type composition and mechanics of the muscles involved. Whereas burst acceleration has been shown to correlate to the proportion of FG fibres [30] and muscle power output [23,33] (this study), stamina is assumed to correlate to the proportion of FOG fibres [25–27]. Although at the muscular level, absolute and mass-specific power output trade off with fatigue resistance, this does not seem to be paralleled by a locomotor performance trade-off at the whole-organism level between acceleration and stamina. As we have no (bio)mechanical grounds to explain the positive relationship between acceleration and stamina, it seems plausible that the relationship is indirect, and influenced by other (non-muscular) physiological factors. The fact that the variation in acceleration capacity is not explained by the variation in absolute nor mass-specific power output, and the variation in stamina is not explained by the variation in muscular fatigue resistance, further corroborates this idea (see below). Finally, our measure of stamina on a circular track involves animals moving in bursts, which may represent some sort of sustained acceleration capacity; as such this may be correlated to absolute whole-organism acceleration performance.
(b). Mechanistic link between whole-organism and isolated muscle performance
The mechanistic link between our measures of whole-organism performance and isolated muscle performance remains partially unresolved. As for sprint speed, our results show that muscles of fast sprinters seem to produce high muscle power output in both absolute and relative terms. Although a positive correlation between speed and muscle power production has been predicted based on theoretical grounds, we believe our study is one of the few providing empirical evidence corroborating this hypothesis (cf. [23]). A comparison of locomotor performance (i.e. jumping and sprinting), fibre-type composition and muscle mechanics in three tropidurid lizard species showed that the documented differences in locomotor capacities were only partially explained by the muscular physiological attributes, and not by the muscle mechanical properties [22]. Similarly, Wilson and co-authors [17] did not find a significant relationship between swimming speed and muscle power production in individual frogs. In both cases, however, we believe the choice of experimental muscle may not have been ideal. The peroneus muscle in frogs is a small knee extensor muscle, not contributing much to locomotion [17]; the iliofibularis muscle used in the tropidurid study [22] (see also [66,67]) is a knee flexor, and a swing phase muscle. Recently, however, it has been demonstrated that locomotor performance (i.e. speed, acceleration) in lizards is not correlated to the biochemical and physiological properties of swing phase muscles. Rather, maximum performance is limited by those of the stance phase muscles [24]. Besides the fact that the muscle used in the present study (i.e. the iliotibialis muscle) is a knee extensor, shown to be a major determinant of speed and acceleration capacity [7], it is also a stance phase muscle (see also [68]). The difference in functional relevance in the context of locomotor capacity between the iliotibialis and the iliofibularis may explain the difference between the results in this and Kohlsdorf's study [22].
The variation in acceleration capacity, on the other hand, was not explained by the variation in absolute or mass-specific muscle power output either in absolute or in relative terms. This finding contradicts results from studies on frogs and lizards, where it has been shown that explosive burst locomotor events are associated with high mass-specific (muscular) power output [23,33]. However, note that in the first study measurements were done in vivo by means of electromyography, sonomicrometry and force measurements of the plantaris muscle while frogs were swimming voluntarily [23], whereas in the latter in vitro work measurements of isolated fibre bundles were performed with subsequent extrapolation of the measurements to the whole muscle [33].
Lastly, the variation in locomotor stamina was not explained by the variation in muscle fatigue resistance in either absolute or relative terms, among the 17 lacertid lizard species. We therefore do not find evidence of a muscle mechanistic basis for the capacity to sustain locomotion. Several explanations are plausible. First, stamina, like most locomotor performance traits, is determined by a whole suite of morphological, biochemical and physiological (muscular and non-muscular) traits, and the interplay among them. For instance, both at the interspecific and intraspecific level, time to exhaustion has been shown to correlate to the energetic cost of locomotion, enzymatic activity, respiratory and/or cardiovascular properties (e.g. [69–72]). Quantifying fatigue resistance in only one limb muscle may be too simplistic an approach as other (non-muscular) physiological factors may override the effect of muscle mechanics on sustained locomotor capacity. Second, our measure of fatigue resistance at the muscular level may not perfectly mimic our measure of locomotor stamina at the whole-organism level, and in vitro fatigue runs were much shorter than in vivo stamina trials. Whereas the entire fatigue run consisted of 120 cycles at 8 Hz, thus lasting 15 s in total, and our measure of fatigue resistance is estimated as the proportion of power output at cycle 12 (i.e. after 1.5 s) against power output at the first cycle, the maximum time to exhaustion in the whole animal ranged from 57 to 223 s. During the muscle experiments, all parameters were set to elicit maximum power output (see Material and methods), as measured in non-fatigued muscles, thereby recruiting all muscle fibres simultaneously. This may not reflect in vivo locomotor conditions as it is unlikely all fibres are recruited at once during extended bouts of locomotion. Instead, individual fibres or fibre bundles may alternate between rest and work [17].
In conclusion, in our dataset of 17 lacertid lizard species, we find evidence for a trade-off between burst and sustained locomotion at the isolated muscle level. However, this trade-off does not seem to be convincingly paralleled at the whole-organism level. Variation in locomotor sprint speed can be explained by variation in isolated muscle power output. In contrast, we did not find strong evidence to support the hypothesis that variation in locomotor acceleration capacity and stamina can be explained by variation in muscle mechanics.
Acknowledgements
We would like to thank Duje Lisičić, Shelley Edwards, Buyisile Makhubo, Deon Visser, Wolfgang Böhme, Le Fras Mouton and Jan Scholliers for help with fieldwork and experiments.
Animals were captured under permit numbers 0011-AAA004-00333 and 532-08-01-01/1-11-04. Experiments were carried out in accordance with procedures stipulated by the ethics committees of Coventry University and Antwerp University.
Funding statement
Funding was provided by the European Community's Seventh Framework Programme FP7/2007–2013, Future Emerging Technologies, Embodied Intelligence (grant no. 231688), to P.A., the National Research Foundation of South Africa (KISC funding) to K.A.T. and A.H., and an ANR grant (MOBIGEN, programme 6ieme extinction) to A.H.
References
- 1.Careau VC, Garland T., Jr 2012. Performance, personality, and energetics: correlation, causation, and mechanism. Phys. Biochem. Zool. 85, 543–571 (doi:10.1086/666970) [DOI] [PubMed] [Google Scholar]
- 2.Lewontin RC. 1978. Adaptation. Scient. Am. 239, 156–169 (doi:10.1038/scientificamerican0978-212) [DOI] [PubMed] [Google Scholar]
- 3.Arnold SJ. 1992. Constraints on phenotypic evolution. Am. Nat. 140, S85–S107 (doi:10.1086/285398) [DOI] [PubMed] [Google Scholar]
- 4.DeWitt TJ, Scheiner SM. 2004. Phenotypic plasticity: functional and conceptual approaches. Oxford, UK: Oxford University Press [Google Scholar]
- 5.Konuma J, Chiba S. 2007. Trade-offs between force and fit: extreme morphologies associated with feeding behavior in carabid beetles. Am. Nat. 170, 90–100 (doi:10.1086/518182) [DOI] [PubMed] [Google Scholar]
- 6.Herrel A, Podos J, Vanhooydonck B, Hendry AP. 2009. Force-velocity trade-off in Darwin's finch jaw function: a biomechanical basis for ecological speciation? Funct. Ecol. 23, 119–125 (doi:10.1111/j.1365-2435.2008.01494.x) [Google Scholar]
- 7.Vanhooydonck B, Van Damme R, Aerts P. 2001. Speed and stamina trade-off in lacertid lizards. Evolution 55, 1040–1048 (doi:10.1554/0014-3820(2001)055[1040:SASTOI]2.0.CO;2) [DOI] [PubMed] [Google Scholar]
- 8.Pasi BM, Carrier DR. 2003. Functional trade-offs in the limb muscles of dogs selected for running vs. fighting. J. Evol. Biol. 16, 324–332 (doi:10.1046/j.1420-9101.2003.00512.x) [DOI] [PubMed] [Google Scholar]
- 9.Dlugosz EM, Chappell MA, McGillivray DG, Syme DA, Garland T., Jr 2009. Locomotor trade-offs in mice selectively bred for high voluntary wheel running. J. Exp. Biol. 212, 2612–2618 (doi:10.1242/jeb.029058) [DOI] [PubMed] [Google Scholar]
- 10.Ellerby DJ, Gerry SP. 2011. Sympatric divergence and performance trade-offs of Bluegill ecomorphs. Evol. Biol. 38, 422–433 (doi:10.1007/s11692-011-9130-y) [Google Scholar]
- 11.Van Damme R, Wilson RB, Vanhooydonck B, Aerts P. 2002. Performance constraints in decathletes. Nature 415, 755–756 (doi:10.1038/415755b) [DOI] [PubMed] [Google Scholar]
- 12.Chappell MA, Garland T, Jr, Robertson GF, Saltzman W. 2007. Relationships among running performance, aerobic physiology and organ mass in male Mongolian gerbils. J. Exp. Biol. 210, 4179–4197 (doi:10.1242/jeb.006163) [DOI] [PubMed] [Google Scholar]
- 13.Garland T, Jr, Geiser F, Baudinette RV. 1988. Comparative locomotor performance of marsupial and placental mammals. J. Zool. Lond. 215, 505–522 (doi:10.1111/j.1469-7998.1988.tb02856.x) [Google Scholar]
- 14.Huey RB, Bennett AF, John-Alder HB, Nagy KA. 1984. Locomotor capacity and foraging behaviour of Kalahari lacertid lizards. Anim. Behav. 32, 41–50 (doi:10.1016/S0003-3472(84)80322-X) [Google Scholar]
- 15.Sorci G, Swallow JG, Garland T, Jr, Clobert J. 1995. Quantitative genetics of locomotor speed and endurance in the lizard Lacerta vivipara. Phys. Zool. 68, 698–720 [Google Scholar]
- 16.Stephens PR, Wiens JJ. 2008. Testing for evolutionary trade-offs in a phylogenetic context: ecological diversification and evolution of locomotor performance in emydid turtles. J. Evol. Biol. 21, 77–87 (doi:10.1111/j.1420-9101.2007.01467.x) [DOI] [PubMed] [Google Scholar]
- 17.Wilson RS, James RS, Van Damme R. 2002. Trade-offs between speed and endurance in the frog Xenopus laevis: a multi-level approach. J. Exp. Biol. 205, 1145–1152 [DOI] [PubMed] [Google Scholar]
- 18.Herrel A, Bonneaud C. 2012. Trade-offs between burst performance and maximal exertion capacity in a wild amphibian, Xenopus tropicalis. J. Exp. Biol. 215, 3106–3111 (doi:10.1242/jeb.072090) [DOI] [PubMed] [Google Scholar]
- 19.Reidy SP, Kerr SR, Nelson JA. 2000. Aerobic and anaerobic swimming performance of individual Atlantic cod. J. Exp. Biol. 203, 347–357 [DOI] [PubMed] [Google Scholar]
- 20.Langerhans RB. 2009. Trade-off between steady and unsteady swimming underlies predator-driven divergence in Gambusia affinis. J. Evol. Biol. 22, 1057–1075 (doi:10.1111/j.1420-9101.2009.01716.x) [DOI] [PubMed] [Google Scholar]
- 21.Esbjörnsson M, Sylvén C, Holm I, Jansson E. 1993. Fast twitch fibres may predict anaerobic performance in both females and males. Int. J. Sports Med. 14, 257–263 (doi:10.1055/s-2007-1021174) [DOI] [PubMed] [Google Scholar]
- 22.Kohlsdorf T, James RS, Carvalho JE, Wilson RS, Dal Pai-Silva M, Navas CA. 2004. Locomotor performance of closely related Tropidurus species: relationships with physiological parameters and ecological divergence. J. Exp. Biol. 207, 1183–1192 (doi:10.1242/jeb.00870) [DOI] [PubMed] [Google Scholar]
- 23.Richards CT, Biewener AA. 2007. Modulation of in vivo muscle power output during swimming in the African clawed frog (Xenopus laevis). J. Exp. Biol. 210, 3147–3159 (doi:10.1242/jeb.005207) [DOI] [PubMed] [Google Scholar]
- 24.Higham TE, Korchari PG, McBrayer LD. 2011. How muscles define maximum running performance in lizards: an analysis using swing- and stance-phase muscles. J. Exp. Biol. 214, 1685–1691 (doi:10.1242/jeb.051045) [DOI] [PubMed] [Google Scholar]
- 25.James RS, Altringham JD, Goldspink DF. 1995. The mechanical properties of fast and slow skeletal muscles of the mouse in relation to their locomotory function. J. Exp. Biol. 198, 491–502 [DOI] [PubMed] [Google Scholar]
- 26.Bonine KE, Gleeson TT, Garland T., Jr 2001. Comparative analysis of fiber-type composition in the iliofibularis muscle of phrynosomatid lizards (Squamata). J. Morph. 250, 265–280 (doi:10.1002/jmor.1069) [DOI] [PubMed] [Google Scholar]
- 27.Biewener AA. 2003. Animal locomotion. Oxford, UK: Oxford University Press [Google Scholar]
- 28.Bonine KE, Gleeson TT, Garland T., Jr 2005. Muscle fiber-type variation in lizards (Squamata) and phylogenetic reconstruction of hypothesized ancestral states. J. Exp. Biol. 208, 4529–4247 (doi:10.1242/jeb.01903) [DOI] [PubMed] [Google Scholar]
- 29.Scales JA, King AA, Butler MA. 2009. Running for your life or running for your dinner: what drives fiber-type evolution in lizard locomotor muscles. Am. Nat. 173, 543–553 (DOI10.1086/597613) [DOI] [PubMed] [Google Scholar]
- 30.Wilson RS, James RS, Kohlsdorf T, Cox VM. 2004. Interindividual variation of isolated muscle performance and fibre-type composition in the toad Bufo viridis. J. Comp. Physiol. B 174, 453–459 (doi:10.1007/s00360-004-0431-7) [DOI] [PubMed] [Google Scholar]
- 31.Wilson RS, James RS. 2004. Constraints on muscular performance: trade-offs between power output and fatigue resistance. Biol. Lett. 271, S222–S225 (doi:1098/rsbl.2003.0143) [DOI] [PMC free article] [PubMed] [Google Scholar]
- 32.Navas CA, James RS, Wilson RS. 2006. Interindividual variation in the muscle physiology of vertebrate ectotherms: consequences for behavioral and ecological performance. In Ecology and biomechanics: a mechanical approach to the ecology of animals and plants (eds Herrel A, Speck T, Rowe NP.), pp. 231–252 Boca Raton, FL: CRC Press [Google Scholar]
- 33.Curtin NA, Woledge RC, Aerts P. 2005. Muscle directly meets the vast power demands in agile lizards. Proc. R. Soc. B 272, 581–584 (doi:10.1098/rspb.2004.2982) [DOI] [PMC free article] [PubMed] [Google Scholar]
- 34.Vanhooydonck B, Herrel A, Van Damme R, Irschick DJ. 2006. The quick and the fast: the evolution of acceleration capacity in Anolis lizards. Evolution 60, 2137–2147 [PubMed] [Google Scholar]
- 35.Huey RB, Hertz PE. 1984. Effects of body size and slope on acceleration of a lizard (Stellio stellio). J. Exp. Biol. 110, 113–123 [Google Scholar]
- 36.Josephson RK. 1993. Contraction dynamics and power output of skeletal muscle. Annu. Rev. Physiol. 55, 527–546 (doi:10.1146/annurev.ph.55.030193.002523) [DOI] [PubMed] [Google Scholar]
- 37.Caiozzo VJ. 2002. Plasticity of skeletal muscle phenotype: mechanical consequences. Muscle Nerve 26, 740–768 (doi:10.1002/mus.10271) [DOI] [PubMed] [Google Scholar]
- 38.James RS, Tallis J, Herrel A, Bonneaud C. 2012. Warmer is better: thermal sensitivity of both maximal and sustained power output in the iliotibialis muscle isolated from adult Xenopus tropicalis. J. Exp. Biol. 215, 552–558 (doi:10.1242/jeb.063396) [DOI] [PubMed] [Google Scholar]
- 39.Snyder RC. 1962. Adaptations for bipedal locomotion of lizards. Am. Zool. 2, 191–203 [Google Scholar]
- 40.Bennett AF, Garland T, Jr, Else PL. 1989. Individual correlation of morphology, muscle mechanics, and locomotion in a salamander. Am. J. Physiol. Integr. Comp. Physiol. 256, R1200–R1208 [DOI] [PubMed] [Google Scholar]
- 41.Blob RW, Biewener AA. 2001. Mechanics of limb bone loading during terrestrial locomotion in the green Iguana (Iguana iguana) and American alligator (Alligator mississippiensis). J. Exp. Biol. 204, 1099–1122 [DOI] [PubMed] [Google Scholar]
- 42.Higham TE, Jayne BC. 2004. In vivo muscle activity in the hindlimbs of the arboreal lizard, Chamaleo calyptratus: general patterns and the effects of incline. J. Exp. Biol. 207, 249–261 (doi:10.1242/jeb.00745) [DOI] [PubMed] [Google Scholar]
- 43.Butcher MT, Blob RW. 2008. Mechanics of limb bone loading during terrestrial locomotion in river cooter turtles (Pseudemys concinna). J. Exp. Biol. 211, 1187–1202 (doi:10.1242/jeb.012989) [DOI] [PubMed] [Google Scholar]
- 44.Bauwens D, Garland T, Jr, Castilla AM, Van Damme R. 1995. Evolution of sprint speed in lacertid lizards: morphological, physiological and behavioral covariation. Evolution 49, 848–863 (doi:10.2307/2410408) [DOI] [PubMed] [Google Scholar]
- 45.van Berkum FH, Tsuji JS. 1987. Inter-familiar differences in sprint speed of hatchling Sceloporus occidentalis (Reptilia: Iguanidae). J. Zool. Lond. 212, 511–519 (doi:10.1111/j.1469-7998.1987.tb02921.x) [Google Scholar]
- 46.Tsuji JS, Huey RB, van berkum FH, Garland T, Jr, Shaw RG. 1989. Locomotor performance of hatchling fence lizards (Sceloporus occidentalis): quantitative genetics and morphometric correlates. Evol. Ecol. 3, 240–252 (doi:10.1007/BF02270725) [Google Scholar]
- 47.Castilla AM, Van Damme R, Bauwens D. 1999. Field body temperatures, mechanisms of thermoregulation and evolution of thermal characteristics in lacertid lizards. Natura Croatica 8, 253–274 [Google Scholar]
- 48.Van Wassenbergh S. 2007. VBA Excel add-in utilities and worksheet templates. See https://www.vantwerp.be/en/staff/sam-vanwassenbergh/my-website/excel-vba-tools. [Google Scholar]
- 49.Huyghe K, Vanhooydonck B, Herrel A, Tadić Z, Van Damme R. 2007. Morphology, performance, behavior and ecology of three color morphs in males of the lizard Podarcis melisellensis. Int. Comp. Biol. 47, 211–220 (doi:10.1093/icb/icm043) [DOI] [PubMed] [Google Scholar]
- 50.Huey RB, Dunham AE, Overall KL, Newman RA. 1990. Variation in locomotor performance of demographically known populations of the lizard Sceloporus merriami. Physiol. Zool. 63, 845–872 [Google Scholar]
- 51.Johnson TP, Swoap SJ, Bennett AF, Josephson RK. 1993. Body size, muscle power output and limitations on burst locomotor performance in the lizard Dipsosaurus dorsalis. J. Exp. Biol. 174, 199–213 [Google Scholar]
- 52.Herrel A, James RS, Van Damme R. 2007. Fight versus flight: physiological basis for temperature-dependent behavioral shifts in lizards. J. Exp. Biol. 210, 1762–1767 (doi:10.1242/jeb.003426) [DOI] [PubMed] [Google Scholar]
- 53.Sokal RR, Rohlf FJ. 1995. Biometry: the principles and practice of statistics in biological research. New York, NY: Freeman and Company [Google Scholar]
- 54.Felsenstein J. 1985. Phylogenies and the comparative method. Am. Nat. 125, 1–15 (doi:10.1086/284325) [Google Scholar]
- 55.Felsenstein J. 1988. Phylogenies and quantitative characters. Ann. Rev. Ecol. Syst. 19, 445–471 (doi:10.1146/annurev.es.19.110188.002305) [Google Scholar]
- 56.Harvey PH, Pagel MD. 1991. The comparative method in evolutionary biology. Oxford, UK: Oxford University Press [Google Scholar]
- 57.Harris DJ, Arnold EN, Thomas RH. 1998. Relationships of lacertid lizards (Reptilia: Lacertidae) estimated from mitochondrial DNA sequences and morphology. Proc. R. Soc. B 265, 1939–1948 (doi:10.1098/rspb.1998.0524) [DOI] [PMC free article] [PubMed] [Google Scholar]
- 58.Oliverio M, Bologna MA, Mariottini P. 2000. Molecular biogeography of the Mediterranean lizards Podarcis Wagler, 1830 and Teira Gray, 1838 (Reptilia, Lacertidae). J. Biogeogr. 27, 1403–1420 (doi:10.1046/j.1365-2699.2000.00517.x) [Google Scholar]
- 59.Godinho R, Crespo EG, Ferrand N, Harris DJ. 2005. Phylogeny and evolution of the green lizards, Lacerta spp. (Squamata: Lacertidae) based on mitochondrial and nuclear DNA sequences. Amphibia-Reptilia 26, 271–285 (doi:10.1163/156853805774408667) [Google Scholar]
- 60.Mayer W, Pavlicev M. 2007. The phylogeny of the family Lacertidae (Reptilia) based on nuclear DNA sequences: convergent adaptations to arid habitats within the family Eremiainae. Mol. Phyl. Evol. 44, 1155–1163 (doi:10.1016/j.ympev.2007.05.015) [DOI] [PubMed] [Google Scholar]
- 61.Edwards S, Vanhooydonck B, Herrel A, Measey GJ, Tolley KA. 2012. Convergent evolution associated with habitat decouples phenotype from phylogeny in a clade of lizards. PLoS ONE 7, e51636 (doi:10.1371/journal.pone.0051636) [DOI] [PMC free article] [PubMed] [Google Scholar]
- 62.Maddison WP, Maddison DR. 2010. Mesquite: a modular system for evolutionary analysis, v. 2.74 See http://mesquiteproject.org
- 63.Garland T, Jr, Midford PE, Ives AR. 1999. An introduction to phylogenetically based statistical methods, with a new method for confidence intervals on ancestral values. Am. Zool. 39, 374–388 [Google Scholar]
- 64.Midford PE, Garland T, Jr, Maddison WP. 2009. PDAP:PDTREE package for Mesquite, v. 1.15 See http://mesquiteproject.org/pdap_mesquite/
- 65.Blomberg SP, Garland T, Jr, Ives AR. 2003. Testing for phylogenetic signal in comparative data: behavioral traits are more labile. Evolution 57, 717–745 [DOI] [PubMed] [Google Scholar]
- 66.Marsh RL, Bennett AF. 1986. Thermal dependence of contractile properties of skeletal muscle from the lizard Sceloporus occidentalis with comments on methods for fitting and comparing force-velocity curves. J. Exp. Biol. 126, 63–77 [DOI] [PubMed] [Google Scholar]
- 67.Marsh RL. 1988. Ontogenesis of contractile properties of skeletal muscle and sprint performance in the lizard Dipsosaurus dorsalis. J. Exp. Biol. 137, 119–119 [DOI] [PubMed] [Google Scholar]
- 68.Marsh RL, Ellerby DJ, Carr JA, Henry HT, Buchanan CI. 2004. Partitioning the energetic of walking and running: swinging the limbs is expensive. Science 303, 80–83 (doi:10.1126/science.1090704) [DOI] [PubMed] [Google Scholar]
- 69.Garland T., Jr 1984. Physiological correlates of locomotory performance in a lizard: an allometric approach. Am. J. Physiol. 247, R806–R815 [DOI] [PubMed] [Google Scholar]
- 70.Garland T, Jr, Losos JB. 1994. Ecological morphology of locomotor performance in squamate reptiles. In Ecological morphology: integrative organismal biology (eds Wainwright PC, Reilly SM.), pp. 240–302 Chicago, IL: University of Chicago Press [Google Scholar]
- 71.Kolok AS. 1999. Interindividual variation in the prolonged locomotor performance of ectothermic vertebrates: a comparison of fish and herpetofaunal methodologies and a brief review of the recent fish literature. Can. J. Fish. Aquat. Sci. 56, 700–710 (doi:10.1139/f99-026) [Google Scholar]
- 72.Cano JM, Nicieza AG. 2006. Temperature, metabolic rate, and constraints on locomotor performance in ectotherm vertebrates. Funct. Ecol. 20, 464–470 (doi:10.1111/j.1365-2435.2006.01129.x) [Google Scholar]