

Significance
This work explains how the experimental time scale determines our perception of the free-energy landscape for a molecular system. Greater temporal resolution naturally resolves more free-energy minima, although this structure may be averaged out over longer time scales. Hence shorter observation times may resolve more states, but result in broken ergodicity. A consistent treatment of the thermodynamics that corresponds with a given experiment must therefore account for the feasibility of different rearrangement mechanisms on the relevant observation time scale. Hence we establish a connection between the concepts of molecular symmetry, ergodicity, and local equilibrium.
Abstract
When structures that interconvert on a given time scale are lumped together, the corresponding free-energy surface becomes a function of the observation time. This view is equivalent to grouping structures that are connected by free-energy barriers below a certain threshold. We illustrate this time dependence for some benchmark systems, namely atomic clusters and alanine dipeptide, highlighting the connections to broken ergodicity, local equilibrium, and “feasible” symmetry operations of the molecular Hamiltonian.
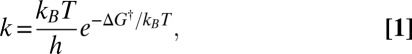
Free-energy surfaces or landscapes play a key role in the analysis of structure, dynamics, and thermodynamics in molecular science. In the present contribution we explain how comparison of theory and simulation with experiment should account for the time scale of observation, using atomic clusters and alanine dipeptide for illustration. First we explain the connection between the time scale and the free-energy barriers that separate different states. This connection is related to lumping schemes that group together local minima if they are connected by barriers below a certain threshold (1–4). To make this connection we use the Eyring–Polanyi formulation of the rate constant as
 |
where  is the Boltzmann constant, h is Planck’s constant, T is the temperature, and
  is the activation free energy (5–7). Assuming first-order kinetics, the decay of an initial reactant concentration
  as a function of time t is
where τ is the average lifetime. Hence
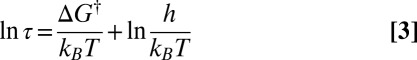 |
relates the free-energy barrier to the average lifetime, which we will associate with the observation time scale. If we lump together states connected by barriers less than a given threshold  , as in the recursive regrouping scheme (1–4), then the number of free-energy minima and transition states will change when
  passes through values corresponding to barrier heights on the landscape in question. In the canonical ensemble the occupation probability and free energy of a group of minima J are
 |
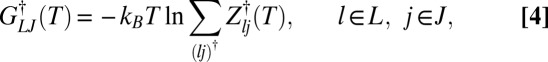
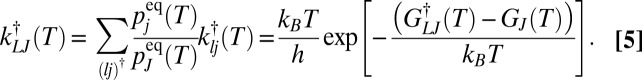
where  is the partition function for potential energy minimum j. The total rate constant for direct isomerization of minimum j to minimum l,
  , is obtained by summing over all of the transition states that directly connect the two minima, and the free energy of the transition states connecting groups J and L is then
 |
with
 |
Here a transition state is defined as a stationary point with a single negative Hessian eigenvalue (8).
The importance of the experimental observation time scale has certainly been recognized before, in the context of local equilibration and hierarchical relaxation (9–12), broken ergodicity (13), and for single-molecule experiments (14–17). However, the connection between these applications for spin models, structural glass-formers, and proteins, to feasible operations of the Hamiltonian, introduced to analyze the spectra of nonrigid molecules (18), is perhaps less well appreciated. In the present contribution we connect these diverse topics using an explicit lumping scheme based on time scale or free-energy thresholds, with visualization using disconnectivity graphs (19, 20).
The quantum-mechanical molecular Hamiltonian is invariant to  operations of the complete nuclear permutation–inversion group, consisting of any combination of permutations of atoms of the same element, i.e.,
  for element 1,
  for element 2, etc. (18, 21). The factor of 2 corresponds to inversion of all nuclear and electronic coordinates through the center of mass. The classification of molecular energy levels can be simplified by considering a subgroup whose elements are the feasible permutation–inversion operations (18). The feasible operations correspond to pathways in nuclear configuration space that are insurmountable on the given experimental time scale. These considerations are clearly the same principles that we must account for when analyzing broken ergodicity for glassy landscapes (22), where partition functions can be written explicitly as a function of the observation time scale (23), or for symmetry breaking by an applied field (24). The examples discussed below provide clear illustrations of how these ideas are connected.
Disconnectivity graphs (19, 20) based on free energy (1, 25) provide a powerful tool for visualizing the effect of a changing observation time scale, and are related to the earlier “energy lid” representation (9). The “filling in” problems that arise for free-energy surfaces projected onto order parameters (26–29) are avoided by the regrouping scheme used in the present work and the mincut procedure of Krivov and Karplus (27–29). In the mincut procedure a single effective free-energy barrier between states is constructed that accounts for all direct and indirect paths. The present regrouping scheme employs free-energy barriers designed to reproduce the rates associated with the slowest transitions of interest for a transformed kinetic transition network. Indirect connections between states are explicitly included in this network if they correspond to time scales beyond the chosen regrouping threshold. All these paths are accounted for when the overall rates are calculated from the resulting master equation formulation. The observables, namely the phenomenological rate constants, are obtained from the appropriate effective free-energy barriers in each approach. All of the results presented below correspond to kinetic transition networks constructed using geometry optimization techniques, and expanded using discrete path sampling (30, 31) approaches, as detailed elsewhere (32, 33).
Results for Atomic Clusters
Atomic clusters have proved to be valuable benchmark systems for developing and applying a wide variety of theory and methodology (34–36). To address the full space of permutation–inversion isomers we need to consider relatively small systems and a simple interatomic potential. The Lennard-Jones potential (37) is ideal for this purpose, because it provides a useful model of rare gas clusters, and leads to interesting emergent properties, such as chaotic dynamics (38, 39), for relatively small systems. The energy is
 |
where  and
and  are the pair equilibrium well depth and separation, respectively. We will use reduced units with
  throughout, where m is the atomic mass. The reduced units for
  and time are then
  and
and  , respectively. A cluster containing N atoms will be denoted LJN.
Landscapes for LJ6.
This cluster has two structures corresponding to local minima, namely the octahedron with point group  , and a capped trigonal bipyramid (CTB) with point group
  . The corresponding energies are
  and
and  . There are two distinct transition state structures: a
  transition state with potential energy
  links CTB and octahedral minima, whereas a
  transition state with
  connects permutational isomers of CTB.
The number of nonsuperimposable permutation–inversion isomers of a minimum with point group order o is  (36, 40). To prove this result we note that the
  arrangements of distinguishable particles over N sites in a chiral framework with point group symmetry order o can be partitioned into o sets, whose members are related by overall rotations. There are therefore
  versions (41) that cannot be interconverted by a barrierless overall rotation, and an equal number for the mirror image framework, giving
  distinct permutation–inversion isomers (42). For an achiral framework with point group order o there are
  proper operations, and the
  arrangements of particles over sites divide into
  sets, again giving
  nonsuperimposable permutation–inversion isomers (42). For LJ6 we therefore obtain a database containing 360 versions of the
  minimum and the
  transition state, 30 versions of the octahedral global minimum, and 720 versions of the
  transition state.
The potential energy disconnectivity graph for LJ6 with distinguished permutation–inversion isomers is shown in Fig. 1A. There are 30 subfunnels, each containing 1 version of the octahedron and 12 versions of the CTBP. If we consider the effect of an increasing free-energy regrouping threshold  at a fixed temperature of 0.1, the number of free-energy minima decreases to 30 at
  , corresponding to
  reduced units. Each of the 30 free-energy minima for
  corresponds to 1 version of the octahedron and 12 versions of the CTBP. Here and below, the free energies correspond to estimates obtained from the harmonic vibrational densities of states, where the partition function for permutation–inversion isomer j with potential energy
  is
is
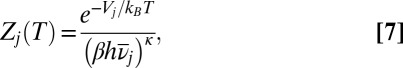 |
with  ,
,  the geometric mean vibrational frequency, and κ the number of vibrational degrees of freedom. The corresponding estimate from transition state theory (43–45) for the rate constant from j to l is
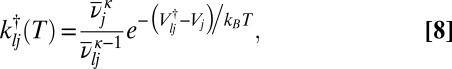 |
where  omits the unique mode with the imaginary frequency for the transition state, which has potential energy
  . With these approximations the regrouping threshold at which potential energy minima j and l are lumped together can be obtained analytically as a function of temperature as
 |
This threshold exhibits a local minimum at temperature  , whereas the corresponding τ value for the average lifetime is monotonically decreasing, as illustrated in Fig. 2 for the initial lumping in LJ6 corresponding to Fig. 1B. The lumping produces a significantly simpler graph, where each free-energy minimum now corresponds to a set of potential energy minima. A detailed analysis of the thermodynamic observables will be presented elsewhere.
Fig. 1.

(A) Potential energy, and (B) free-energy disconnectivity graphs for LJ6. The two distinct structures corresponding to local minima are illustrated in A. For B, harmonic vibrational densities of states were used at a reduced temperature of 0.1 and a regrouping threshold  .
.
Fig. 2.

Value of (Upper)  and (Lower) τ for which regrouping occurs in LJ6 to produce the pattern in Fig. 1B, both as a function of temperature.
For a monoatomic cluster the permutation–inversion degeneracies are exact. In the absence of quantum tunneling, if the higher barrier corresponding to the longest time scale in the system does not represent a feasible operation, then it makes no difference to the calculated thermodynamic properties if we lump together all of the inaccessible permutation–inversion isomers, or use a single subfunnel. All of the time scales calculated corresponding to processes within a subfunnel, i.e., the rearrangements that are observable for the experiment in question, are also conserved, because the extra degeneracy factors cancel exactly. However, interesting cases will arise if tunneling can occur, and in the contrasting limit of large colloids, where all of the particles are actually slightly different. New experiments in this field have recently revealed exciting possibilities for such mesoscale clusters, where particles of polystyrene microspheres behave as “pseudoatoms” (46, 47). Direct structural information has been obtained via optical microscopy, and the effect of symmetry on the thermodynamic properties has been verified experimentally and analyzed theoretically (42, 48–50).
Landscapes for LJ7.
This cluster has four structures corresponding to local minima with point groups  ,
,  ,
,  , and
, and  (51, 52). The number of distinct permutation–inversion isomers for each structure is 504, 1,680, 1,680 and 5,040, respectively. There are 12 transition states in this system (53, 54), which together produce a database of 71,400 permutation–inversion isomers.
The total number of potential energy minima when permutation–inversion isomers are distinguished is 8,904, which is too many to represent conveniently in a disconnectivity graph. Instead we illustrate the graph for the four structures when all permutation–inversion isomers are lumped together in Fig. 3A For a fixed temperature of 0.1 the number of free-energy minima decreases to 6,384 around  , then to 3,026 groups around
  , 505 groups for
  , and a single minimum appears for
  . The first crossover corresponds to a low-barrier rearrangement of the highest energy
  minimum to give 2,520 free-energy minima, each consisting of a pair of
  isomers. At
  the 2,520 pairs are retained, plus 504 minima corresponding to the isomers of the
  minimum, and a doubly degenerate global free-energy minimum, with each state containing half the isomers of the two
  structures. At the third crossover we find 504 minima, each corresponding to one version of the
  global minimum, and one group containing all of the other isomers, which is the global free-energy minimum (Fig. 3B).
Fig. 3.

(A) Potential energy, and (B) free-energy disconnectivity graphs for LJ7. The four distinct structures corresponding to local minima are illustrated in A. For B, harmonic vibrational densities of states were used at a reduced temperature of 0.1 and a regrouping threshold  .
.
Results for Alanine Dipeptide
The alanine amino acid, with acetyl and NHMe capping groups for the amino and carboxyl moieties, respectively, provides a simple but insightful illustration of time-scale considerations for a biomolecule. This system (denoted ala) was modeled using our OPTIM program (55) interface to the AMBER package (56, 57) and the AMBER99SB (57) force field. All of the relevant time-scale considerations arise for the peptide in vacuum, and hence this is the description we have adopted to avoid any complications arising from the description of solvent; a fixed temperature of 298 K is used for this molecule.
In common with other empirical force fields, spring terms in the potential are generally associated with specific atoms, so the full permutational symmetry of the Hamiltonian is already broken at this level. For ala described by AMBER99SB there are actually only three groups of permutable atoms, corresponding to the hydrogens of the methyl group attached to the α-carbon, and the methyl groups in the acetyl and NHMe caps. For the present purposes we do not need to distinguish permutational isomers corresponding to different versions of the capping groups, and we focus on the remaining Me group.
If enantiomers are distinguished (the inversion operation) but not permutational isomers, then the potential energy surface has two sets of three minima; the corresponding disconnectivity graph is illustrated in Fig. 4A. At a regrouping threshold of  the lowest two structures for each of the two enantiomeric branches can interconvert (Fig. 4B). At
  all three minima in each subfunnel merge (Fig. 4C); a single free-energy minimum is only obtained for
  . This result agrees with recent surveys of the potential energy landscape for alanine peptides, where mixed LD structures were identified as global minima in several cases, instead of the expected all-L form (58). The landscape separates into distinct funnels associated with alternative L and D forms for each alanine residue, as in Fig. 4. The corresponding barriers would prevent equilibrium sampling using conventional simulation methods, but the global minima are nevertheless rapidly located using basin-hopping global optimization (59–61).
Fig. 4.

Disconnectivity graphs for alanine dipeptide when permutational isomers are lumped together. (A) Potential energy graph, (B) free-energy graph for  , and (C) free-energy graph for
  .
.
If we now distinguish permutational isomers for the hydrogen atoms of the Me group, then the six minima of the potential energy surface are further split into 36 states (Fig. 5A). This situation corresponds to the isotopic composition hydrogen/deuterium/tritium for the methyl group, if quantum tunneling and zero-point effects are neglected. Two distinct energy scales are involved in the additional splitting. The first corresponds to rotation about the Me–C bond, involving barriers of order 4 kcal/mol, which interconverts versions of each structure in sets of three. The second process involves much higher barriers around 59 kcal/mol for changing the cyclic ordering of the H atoms at each Me. At  the lowest two distinct structures in the same enantiomeric branch and with identical Me H ordering are lumped together, producing 24 free-energy minima in total. Twelve of these minima correspond to pairs of isomers, whereas the other 12 are versions of the higher energy structure, as indicated in Fig. 5B. For
  three rotamers of each of the higher energy structures can interconvert, and there are now 16 distinct free-energy minima (Fig. 5C). With a small increase in regrouping threshold to
  the rotamers of the lowest two structures can also interconvert in sets of six, producing eight free-energy states (Fig. 5D). At
  all versions of the three distinct structures that correspond to the same enantiomeric branch and the same local H ordering at each Me group can interconvert. This regrouping leaves four free-energy minima (Fig. 5E). The barrier to reversing the order of the H atoms is only overcome around
  , leaving two states corresponding to sets of enantiomers (Fig. 5F). Finally, a single free-energy minimum is obtained around
  , as above.
Fig. 5.

Disconnectivity graphs for alanine dipeptide when permutational isomers are distinguished. (A) Potential energy graph, (B) free-energy graph for  , (C) free-energy graph for
  , (D) free-energy graph for
  , (E) free-energy graph for
  , and (F) free-energy graph for
  .
.
Conclusions
We have analyzed the fundamental connections between observation time scale, free-energy landscapes, broken ergodicity, and feasible molecular symmetry operations (18), which are generalized to describe any pathway that is sampled on the experimental time scale (36). Lumping together permutation–inversion isomers that are not connected by feasible pathways does not affect the local equilibrium thermodynamics corresponding to the subset of configuration space that is sampled. In terms of the dynamics, this lumping also preserves all of the kinetics associated with distinct states on the observation time scale. The longer time scales corresponding to unfeasible rearrangements are simply not observed.
In our analysis we have described qualitative changes in the perceived free-energy landscape as a function of a free-energy regrouping threshold  , and related this quantity to a time scale by considering first-order decay kinetics. In reality, transitions between states are stochastic, and crossovers between different regimes will occur over a finite temperature range. The clearest examples will occur when the separation of time scales for different processes is large. Alternative experiments can then yield different resolutions of the landscape, with shorter time scales, e.g., from femtosecond laser pulses, generally leading to higher resolution and multiexponential kinetics (62–65). Small peptides, such as the alanine dipeptide considered in the present work, may support crossovers that are quite well defined, associated with qualitatively distinct classes of intramolecular rearrangement mechanisms. Applications ranging from single-molecule experiments in biophysics (14–17) to confocal microscopy of colloidal clusters (46, 47), where the building blocks can be designed with different classes of interactions, will provide opportunities to exploit the present analysis.
Acknowledgments
The authors gratefully acknowledge discussions with colleagues at the Telluride Science Research Centre, which were made possible for D.J.W. by financial support from the Engineering and Physical Sciences Research Council and the European Research Council.
Footnotes
The authors declare no conflict of interest.
*This Direct Submission article had a prearranged editor.
References
- 1.Evans DA, Wales DJ. Free energy landscapes of model peptides and proteins. J Chem Phys. 2003;118:3891–3897. [Google Scholar]
- 2.Carr JM, Wales DJ. Global optimization and folding pathways of selected alpha-helical proteins. J Chem Phys. 2005;123(23):234901. doi: 10.1063/1.2135783. [DOI] [PubMed] [Google Scholar]
- 3.Carr JM, Wales DJ. Folding pathways and rates for the three-stranded beta-sheet peptide Beta3s using discrete path sampling. J Phys Chem B. 2008;112(29):8760–8769. doi: 10.1021/jp801777p. [DOI] [PubMed] [Google Scholar]
- 4.Carr JM, Wales DJ. Refined kinetic transition networks for the GB1 hairpin peptide. Phys Chem Chem Phys. 2009;11(18):3341–3354. doi: 10.1039/b820649j. [DOI] [PubMed] [Google Scholar]
- 5.Eyring H, Polanyi M. Uber einfache gasreaktionen. Z Phys Chem Abt B. 1931;12:279–311. [Google Scholar]
- 6.Evans MG, Polanyi M. Some applications of the transition state method to the calculation of reaction velocities, especially in solution. Trans Faraday Soc. 1935;31:875–894. [Google Scholar]
- 7.Eyring H. The activated complex in chemical reactions. J Chem Phys. 1935;3:107–115. [Google Scholar]
- 8.Murrell JN, Laidler KJ. Symmetries of activated complexes. Trans Faraday Soc. 1968;64:371–377. [Google Scholar]
- 9.Sibani P, Schön JC, Salamon P, Andersson J. Emergent hierarchical structures in complex-system dynamics. Europhys Lett. 1993;22:479–485. [Google Scholar]
- 10.Sibani P, Schriver P. Local phase-space structure and low-temperature dynamics of short-range Ising spin glasses. Phys Rev B Condens Matter. 1994;49(10):6667–6671. doi: 10.1103/physrevb.49.6667. [DOI] [PubMed] [Google Scholar]
- 11.Doye JPK, Wales DJ. On potential-energy surfaces and relaxation to the global minimum. J Chem Phys. 1996;105:8428–8445. [Google Scholar]
- 12.Calvo F, Wales DJ. Relaxation of caloric curves on complex potential energy surfaces. J Chem Phys. 2008;128(15):154501. doi: 10.1063/1.2850322. [DOI] [PubMed] [Google Scholar]
- 13.Ma SK. Statistical Mechanics. Singapore: World Scientific; 1985. [Google Scholar]
- 14.Yang H, et al. Protein conformational dynamics probed by single-molecule electron transfer. Science. 2003;302(5643):262–266. doi: 10.1126/science.1086911. [DOI] [PubMed] [Google Scholar]
- 15.Gopich IV, Szabo A. Single-macromolecule fluorescence resonance energy transfer and free-energy profiles. J Phys Chem B. 2003;107:5058–5063. [Google Scholar]
- 16.Baba A, Komatsuzaki T. Construction of effective free energy landscape from single-molecule time series. Proc Natl Acad Sci USA. 2007;104(49):19297–19302. doi: 10.1073/pnas.0704167104. [DOI] [PMC free article] [PubMed] [Google Scholar]
- 17.Baba A, Komatsuzaki T. Extracting the underlying effective free energy landscape from single-molecule time series—local equilibrium states and their network. Phys Chem Chem Phys. 2011;13(4):1395–1406. doi: 10.1039/c0cp00694g. [DOI] [PubMed] [Google Scholar]
- 18.Longuet-Higgins HC. The symmetry groups of non-rigid molecules. Mol Phys. 1963;6:445–460. [Google Scholar]
- 19.Becker OM, Karplus M. The topology of multidimensional potential energy surfaces: Theory and application to peptide structure and kinetics. J Chem Phys. 1997;106:1495–1515. [Google Scholar]
- 20.Wales DJ, Miller MA, Walsh TR. Archetypal energy landscapes. Nature. 1998;394:758–760. [Google Scholar]
- 21.Bunker PR, Jensen P. Molecular Symmetry and Spectroscopy. 2nd Ed. Ottawa: NRC Research Press; 1998. [Google Scholar]
- 22.Palmer RG. Broken ergodicity. Adv Phys. 1982;31:669–735. [Google Scholar]
- 23.Wales DJ, Doye JPK. Dynamics and thermodynamics of supercooled liquids and glasses from a model energy landscape. Phys Rev B. 2001;63:214204. [Google Scholar]
- 24.Berry RS. Time-dependent measurements and molecular structure: Ozone. Rev Mod Phys. 1960;32:447–454. [Google Scholar]
- 25.Krivov SV, Karplus M. Free energy disconnectivity graphs: Application to peptide models. J Chem Phys. 2002;117:10894–10903. [Google Scholar]
- 26.Bolhuis PG, Chandler D, Dellago C, Geissler PL. Transition path sampling: throwing ropes over rough mountain passes, in the dark. Annu Rev Phys Chem. 2002;53:291–318. doi: 10.1146/annurev.physchem.53.082301.113146. [DOI] [PubMed] [Google Scholar]
- 27.Krivov SV, Karplus M. Hidden complexity of free energy surfaces for peptide (protein) folding. Proc Natl Acad Sci USA. 2004;101(41):14766–14770. doi: 10.1073/pnas.0406234101. [DOI] [PMC free article] [PubMed] [Google Scholar]
- 28.Krivov SV, Karplus M. One-dimensional free-energy profiles of complex systems: Progress variables that preserve the barriers. J Phys Chem B. 2006;110(25):12689–12698. doi: 10.1021/jp060039b. [DOI] [PubMed] [Google Scholar]
- 29.Krivov SV, Karplus M. Diffusive reaction dynamics on invariant free energy profiles. Proc Natl Acad Sci USA. 2008;105(37):13841–13846. doi: 10.1073/pnas.0800228105. [DOI] [PMC free article] [PubMed] [Google Scholar]
- 30.Wales DJ. Discrete path sampling. Mol Phys. 2002;100:3285–3305. [Google Scholar]
- 31.Wales DJ. Some further applications of discrete path sampling to cluster isomerization. Mol Phys. 2004;102:891–908. [Google Scholar]
- 32.Wales DJ. Energy landscapes: Calculating pathways and rates. Int Rev Phys Chem. 2006;25:237–282. [Google Scholar]
- 33.Wales DJ. Energy landscapes: Some new horizons. Curr Opin Struct Biol. 2010;20(1):3–10. doi: 10.1016/j.sbi.2009.12.011. [DOI] [PubMed] [Google Scholar]
- 34.Sugano S. Microcluster Physics. Berlin: Springer; 1991. [Google Scholar]
- 35.Johnston RL. Atomic and Molecular Clusters. London: Taylor and Francis; 2002. [Google Scholar]
- 36.Wales DJ. Energy Landscapes. Cambridge, UK: Cambridge Univ Press; 2003. [Google Scholar]
- 37.Jones JE, Ingham AE. On the calculation of certain crystal potential constants, and on the cubic crystal of least potential energy. Proc R Soc A. 1925;107:636–653. [Google Scholar]
- 38.Komatsuzaki T, Berry RS. Regularity in chaotic reaction paths. I. Ar6. J Chem Phys. 1999;110:9160–9173. [Google Scholar]
- 39.Komatsuzaki T, Berry RS. Chemical reaction dynamics: many-body chaos and regularity. Adv Chem Phys. 2002;123:79–152. [Google Scholar]
- 40.Amar FG, Berry RS. the onset of non-rigid dynamics and the melting transition in ar7. J Chem Phys. 1986;85:5943–5954. [Google Scholar]
- 41.Bone RGA, Rowlands TW, Handy NC, Stone AJ. Transition states from molecular symmetry groups: Analysis of non-rigid acetylene trimer. Mol Phys. 1991;72:33–73. [Google Scholar]
- 42.Calvo F, Doye JPK, Wales DJ. Energy landscapes of colloidal clusters: Thermodynamics and rearrangement mechanisms. Nanoscale. 2012;4(4):1085–1100. doi: 10.1039/c1nr10679a. [DOI] [PubMed] [Google Scholar]
- 43.Pelzer H, Wigner E. Über die geschwindigkeitskonstante von austauschreaktionen. Z Phys Chem. 1932;B15:445–463. [Google Scholar]
- 44.Forst W. Theory of Unimolecular Reactions. New York: Academic; 1973. [Google Scholar]
- 45.Laidler KJ. Chemical Kinetics. New York: Harper & Row; 1987. [Google Scholar]
- 46.Meng G, Arkus N, Brenner MP, Manoharan VN. The free-energy landscape of clusters of attractive hard spheres. Science. 2010;327(5965):560–563. doi: 10.1126/science.1181263. [DOI] [PubMed] [Google Scholar]
- 47.Crocker JC. Materials science. Turning away from high symmetry. Science. 2010;327(5965):535–536. doi: 10.1126/science.1184457. [DOI] [PubMed] [Google Scholar]
- 48.Wales DJ. Energy landscapes of clusters bound by short-ranged potentials. ChemPhysChem. 2010;11(12):2491–2494. doi: 10.1002/cphc.201000233. [DOI] [PubMed] [Google Scholar]
- 49.Hormoz S, Brenner MP. Design principles for self-assembly with short-range interactions. Proc Natl Acad Sci USA. 2011;108(13):5193–5198. doi: 10.1073/pnas.1014094108. [DOI] [PMC free article] [PubMed] [Google Scholar]
- 50.Frenkel D, Wales DJ. Colloidal self-assembly: designed to yield. Nat Mater. 2011;10(6):410–411. doi: 10.1038/nmat3037. [DOI] [PMC free article] [PubMed] [Google Scholar]
- 51.Hoare MR. Structure and dynamics of simple microclusters. Adv Chem Phys. 1979;40:49–135. [Google Scholar]
- 52.Berry RS, Davis HL, Beck TL. Finding saddles on multidimensional potential surfaces. Chem Phys Lett. 1988;147:13–135. [Google Scholar]
- 53.Tsai CJ, Jordan KD. Use of an eigenmode method to locate the stationary points on the potential energy surfaces of selected argon and water clusters. J Phys Chem. 1993;97:11227–11237. [Google Scholar]
- 54.Doye JPK, Wales DJ. Surveying a potential energy surface by eigenvector- following - applications to global optimisation and the structural transformations of clusters. Zeit Phys D. 1997;40:194–197. [Google Scholar]
- 55.Wales DJ. (year?) OPTIM: A program for optimising geometries and calculating pathways.
- 56.Cornell WD, et al. A second generation force field for the simulation of proteins, nucleic acids and organic molecules. J Am Chem Soc. 1995;117:5179–5197. [Google Scholar]
- 57.Hornak V, et al. Comparison of multiple amber force fields and development of improved protein backbone parameters. Proteins: Struct, Funct, Bioinf. 2006;65:712–725. doi: 10.1002/prot.21123. [DOI] [PMC free article] [PubMed] [Google Scholar]
- 58.Somani S, Wales DJ. Energy landscapes and global thermodynamics for alanine peptides. J Chem Phys. 2013;139(12):121909. doi: 10.1063/1.4813627. [DOI] [PubMed] [Google Scholar]
- 59.Li Z, Scheraga HA. Monte Carlo-minimization approach to the multiple-minima problem in protein folding. Proc Natl Acad Sci USA. 1987;84(19):6611–6615. doi: 10.1073/pnas.84.19.6611. [DOI] [PMC free article] [PubMed] [Google Scholar]
- 60.Wales DJ, Doye JPK. Global optimization by basin-hopping and the lowest energy structures of Lennard-Jones clusters containing up to 110 atoms. J Phys Chem A. 1997;101:5111–5116. [Google Scholar]
- 61.Wales DJ, Scheraga HA. Global optimization of clusters, crystals, and biomolecules. Science. 1999;285(5432):1368–1372. doi: 10.1126/science.285.5432.1368. [DOI] [PubMed] [Google Scholar]
- 62.Sabelko J, Ervin J, Gruebele M. Observation of strange kinetics in protein folding. Proc Natl Acad Sci USA. 1999;96(11):6031–6036. doi: 10.1073/pnas.96.11.6031. [DOI] [PMC free article] [PubMed] [Google Scholar]
- 63.Wang Y, Baskin JS, Xia T, Zewail AH. Human myoglobin recognition of oxygen: dynamics of the energy landscape. Proc Natl Acad Sci USA. 2004;101(52):18000–18005. doi: 10.1073/pnas.0408379102. [DOI] [PMC free article] [PubMed] [Google Scholar]
- 64.Lin MM, Meinhold L, Shorokhov D, Zewail AH. Unfolding and melting of DNA (RNA) hairpins: The concept of structure-specific 2D dynamic landscapes. Phys Chem Chem Phys. 2008;10(29):4227–4239. doi: 10.1039/b804675c. [DOI] [PMC free article] [PubMed] [Google Scholar]
- 65.Sarkar K, Meister K, Sethi A, Gruebele M. Fast folding of an RNA tetraloop on a rugged energy landscape detected by a stacking-sensitive probe. Biophys J. 2009;97(5):1418–1427. doi: 10.1016/j.bpj.2009.06.035. [DOI] [PMC free article] [PubMed] [Google Scholar]