Significance
Zero-mode waveguides (ZMWs) provide a powerful technology for studying single-molecule real-time dynamics of biological systems. However, difficulties in instrumental implementation and ZMW fabrication prevented their widespread use. Here, we modify a commercially available ZMW-based DNA sequencer for use as a multipurpose single-molecule fluorescence instrument. The instrumentation presented here allows access to ZMWs for the general biophysics community for high-throughput multiplexed dynamics of single biological molecules.
Abstract
Zero-mode waveguides provide a powerful technology for studying single-molecule real-time dynamics of biological systems at physiological ligand concentrations. We customized a commercial zero-mode waveguide-based DNA sequencer for use as a versatile instrument for single-molecule fluorescence detection and showed that the system provides long fluorophore lifetimes with good signal to noise and low spectral cross-talk. We then used a ribosomal translation assay to show real-time fluidic delivery during data acquisition, showing it is possible to follow the conformation and composition of thousands of single biomolecules simultaneously through four spectral channels. This instrument allows high-throughput multiplexed dynamics of single-molecule biological processes over long timescales. The instrumentation presented here has broad applications to single-molecule studies of biological systems and is easily accessible to the biophysical community.
Determining the molecular details of the time evolution of complex multicomponent biological systems requires analysis at the single-molecule level because of their stochastic and heterogeneous nature. Ideally, such experiments would track simultaneously the composition of a biological system (bound ligands, factors, and cofactors) and the conformation of the individual molecules in real time. Single-molecule fluorescence methods, such as total internal reflection fluorescence (TIRF) microscopy, allow the observations of the compositional dynamics (through arrival of fluorescently labeled ligands, factors, or cofactors) and conformational dynamics (through FRET) of single-molecular species. However, these traditional single-molecule methods are hindered by limitations in maximal fluorescent component concentrations (up to 50 nM) (1), limited simultaneous detection (two to three colors) (2–6), and low throughput (a few hundred molecules at most per experiment) (7). As such, the full potential of single-molecule fluorescence to investigate a range of biological problems under physiologically relevant conditions has not yet been harnessed.
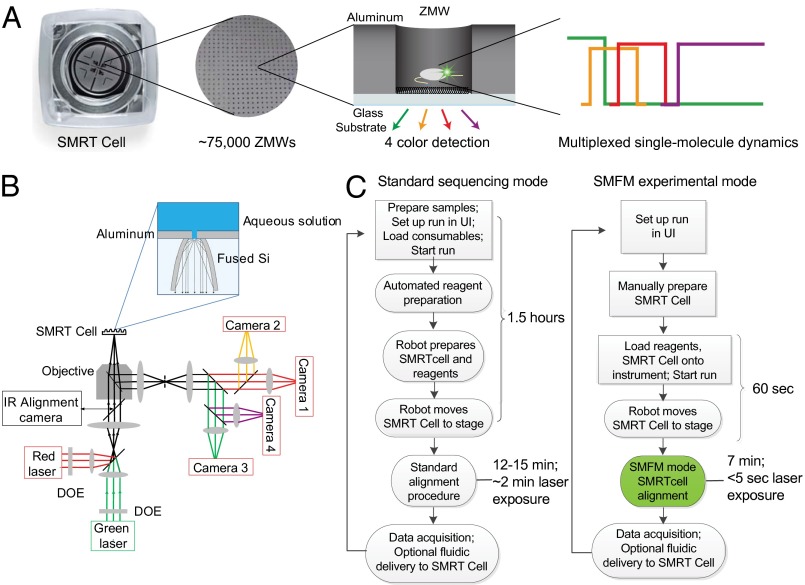
Zero-mode waveguides (ZMWs) are small metallic apertures patterned on glass substrates that overcome the concentration restrictions by optically limiting background excitation (8). Each ZMW consists of an ∼150-nm-diameter metallic aperture that restricts the excitation light to a zeptoliter volume, making possible experiments with near-physiological concentrations (up to 20 µM) of fluorescently labeled ligands (1). Previous advances in nanofabrication (9), surface chemistry (10), and detection instrumentation (11) have led to ZMW-based instrumentation capable of the direct observation of DNA polymerization (12), reverse transcription (13), processive myosin motion (14), and translation by the ribosome (15, 16) with multicolor single-molecule detection. However, this sophisticated technology has not been broadly available to the scientific community. Despite multiple efforts to develop ZMW instrumentation, the combined difficulties in fabricating the ZMW chips (17), the need for appropriate surface chemistry, and the required instrumentation development hindered their widespread use (18–21). To circumvent these problems, we repurposed commercially available ZMW chips [single-molecule real-time (SMRT) Cells] and adapted a ZMW-based DNA sequencer for use as a versatile single-molecule real-time fluorescent microscope to allow multiplexed collection of single-molecule fluorescence events. The instrument allows real-time delivery of reagents and simultaneous four-color detection with excellent signal to noise and low spectral cross-talk, making it particularly suitable for the study of complex biology (Fig. 1A). This instrumentation allows easy access for the general biophysical community to ZMW-based studies of multicomponent, single-molecule dynamics at physiological concentrations for a broad range of biological systems.
Fig. 1.
Overview of the customized RS instrument. (A) An SMRT Cell consists of 150,000 ZMWs, of which ∼75,000 ZMWs can be simultaneously imaged, allowing multiplexed detection of thousands of single molecules in real time across four spectral channels. (B) Simplified optical schematic of the custom RS instrument: continuous excitation is provided by a 532-nm laser and a 642-nm laser, which are separated into ∼75,000 beamlets that illuminate the array of ZMWs on the SMRT Cell that sits on a six-axis stage during data acquisition. The emitted light from the SMRT Cell is collected through the same objective in epifluorescence mode; notch filters in the collection path block transmission of excitation wavelengths. Emitted light is collected on four high-speed complementary metal-oxide-semiconductor (CMOS) cameras. (C) Comparison of workflows for standard sequencing and SMFM experimental mode shows steps for users (square boxes) and instrument (ovals). Modifications made for the SMFM mode reduce time to stage, alignment time, and exposure of components to laser illumination to allow for flexible single-molecule studies with labile reagents. DOE, diffractive optical element.
Results and Discussion
Adaptation of the PacBio ZMW-Based DNA Sequencer.
The PacBio ZMW-based DNA sequencer (RS) platform was designed to work in conjunction with ZMW-patterned arrays as an SMRT detection platform, and DNA sequencing was the first commercial application (Fig. 1B). The PacBio RS is a complex instrument with optics designed to illuminate simultaneously with green (532 nm) and red (642 nm) lasers and monitor single-molecule fluorescence events from up to ∼75,000–150,000 individual ZMWs on timescales ranging from milliseconds to hours. The fluorescence from each ZMW is collected with a micromirror structure on the bottom of the SMRT Cell and separated into four spectral channels, roughly corresponding to Cy3, Cy3.5, Cy5, and Cy5.5 emission maxima (Figs. S1 and S2). During movie acquisition, the SMRT Cell is also actively stabilized and aligned to the individual laser beamlets on a six-axis stage, allowing for hours of stable continuous acquisition. Humidified nitrogen gas is flowed across the chip for oxygen exclusion during acquisition and prevention of evaporation of liquid reagents. In addition to this specialized optical platform, the PacBio RS system contains automated liquid handling and data processing capabilities to support the SMRT sequencing technology. The bottoms of the SMRT Cell ZMW chips are derivatized with biotin–PEG, which can be used to immobilize biological complexes through neutravidin–biotin linkages.
We adapted the commercially available PacBio RS instrument to create a customized platform that provides the flexibility required for our single-molecule fluorescence microscopy (SMFM) studies (Fig. 1C). The original instrument workflow for DNA sequencing consists of a hardcoded 1.5-h automated reagent and chip preparation that provides little flexibility. The instrument workflow was modified to allow rapid single-chip manual runs to accommodate studies using labile reagents, allowing the user to freely immobilize any biological complex of interest on the chip. This modification reduces the original 1.5 h of instrument preparation to only 60 s, preventing the degradation of labile biological complexes. After reagent and chip preparation, the original workflow then aligns the chip and lasers, which takes ∼15 min, with ∼2 min of laser exposure; 2-min laser exposure before movie acquisition will photobleach most fluorescent dyes immobilized for single-molecule studies. We, thus, created a unique chip alignment procedure that minimizes photobleaching of surface-immobilized, dye-labeled moieties, enabling the user to identify ZMWs with singly loaded biomolecules even with nonphotostable dyes (Fig. S3). Finally, the instrument software was modified to allow users to set key experimental parameters, such as acquisition time, laser power, camera frame rates, and fluidics parameters, for greater flexibility in experimental design, which was impossible in the original workflow (Fig. S4). Information on the specific changes can be found in Materials and Methods. In-house scripts were written to view, process, and analyze the resulting data (Fig. S5). Together, these features allow the conversion of the PacBio RS into a powerful tool for customized ZMW single-molecule fluorescence studies using our SMFM experimental protocols.
Characterization of Fluorophore Properties on the RS.
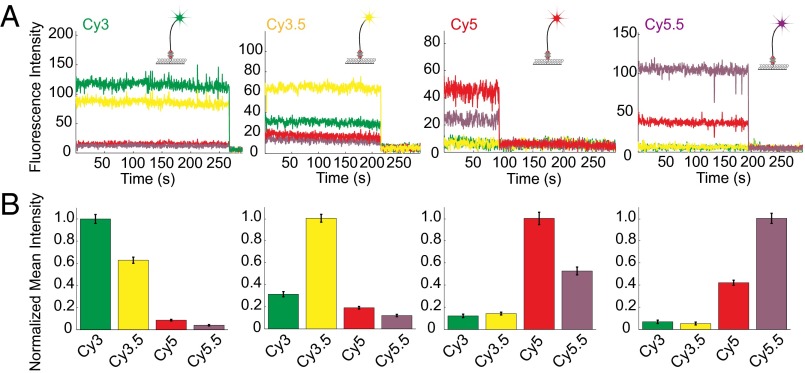
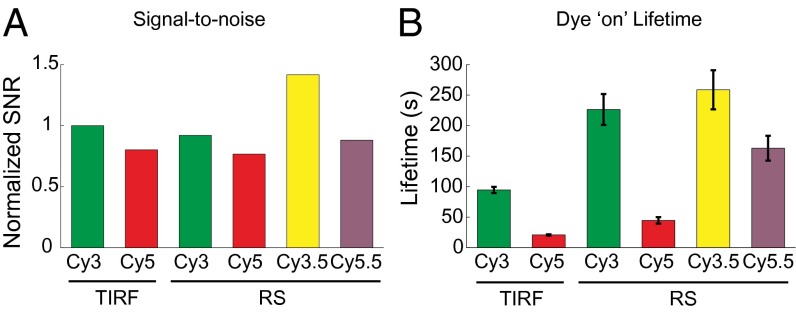
To test the suitability of the instrument for single-molecule experiments, we first characterized the compatibility of the existing optical train with commonly used cyanine dyes. We immobilized biotinylated DNA oligonucleotides conjugated to Cy3, Cy3.5, Cy5, or Cy5.5 dyes at the bottom of the ZMWs and dual illuminated the ZMW SMRT Cell simultaneously with 532- and 642-nm lasers. We detected the emission of each dye into the four spectral channels (552–580, 580–640, 640–677, and 677–750 nm). The filter characteristics needed for single-molecule sensitivity at 75,000 multiplex (filter properties of laser blocking > 12 OD, signal percent transmission > 90%) were achieved by designing a cohesive system with 12 customized filters. All four channels display stable high-intensity signals. Spectral bleedthrough to the neighboring channel (i.e., Cy3 dye to Cy3.5 channel) is ∼50%. This observed level of spectral bleedthrough is dependent on spectral separation between channels and the emission spectra of each dye and sufficient to allow us to distinguish between different dyes. Bleedthrough to nonneighboring channels (i.e., Cy3 dye to Cy5 or Cy5.5 channel) is negligible (Fig. 2). The signal-to-noise ratios (SNRs) (22, 23) for continuous single-molecule fluorescence of the four dyes on the custom RS are comparable with the SNRs measured on our in-house built TIRF (3.18 for Cy3, 4.90 for Cy3.5, 2.64 for Cy5, and 3.05 for Cy5.5) under our measurement conditions (Fig. 3 and SI Materials and Methods). ZMW aluminum walls slightly quench intensities in the red spectral window (Cy5 and Cy5.5), with the dyes Cy5 and Cy5.5 displaying comparatively lower SNR despite their higher quantum yield (quantum yield = 0.28 and 0.23, respectively) than Cy3 and Cy3.5 (quantum yield = 0.15) (16). The photostability lifetime of each dye (as defined by the continuous single-molecule emission before photobleaching and not the lifetime of the excited state commonly used in spectroscopy) exhibits a more than twofold increase compared with their values on TIRF, likely because of the more favorable environment of the dyes in the ZMWs and the oxygen exclusion mechanism of the custom RS (Fig. 3). The use of Cy3.5 and Cy5.5 instead of Cy2 used in prior experiments (16, 24) gives signals that have greater SNR and longer lifetimes without excitation by an additional 488-nm laser. This improvement in dye photostability as well as the ability to use a wide range of fluorescent dyes allows robust single-molecule tracking of dynamics of multicomponent systems over a range of timescales from milliseconds to hours.
Fig. 2.
Fluorophore characterizations on the custom RS. (A) Example traces of Cy3- (green), Cy3.5- (yellow), Cy5- (red), and Cy5.5-labeled (purple) biotinylated oligonucleotides immobilized on the bottom of the ZMWs under dual laser illumination (532 and 642 nm), showing the percentage of bleedthrough. (B) Normalized mean intensities of the four spectral channels for each colored dye. Spectral bleedthrough to the neighboring channel is ∼50%, whereas bleedthrough to the farther channels is negligible. The low bleedthrough allows efficient separation of the four spectral fluorophores. Numbers of molecules analyzed (from left to right) are n = 301, n = 265, n = 280, n = 200. Only a portion (∼5%, randomly picked) of the entire SMRT Cell was analyzed because of the large amount of data generated. Error bars are SEMs.
Fig. 3.
Comparison of fluorophore properties on the custom RS and TIRF. (A) The signal to noise on the home-built TIRF microscope and the custom RS (normalized to Cy3 on TIRF). SNRs on TIRF and RS are essentially equivalent under conditions in which experiments are normally conducted. (B) The continuous emission lifetimes of the dyes on TIRF and RS under constant laser illumination, showing a prolonged photostability of dyes on the custom RS, under conditions resulting in similar SNRs. These dye photostability lifetimes are measured under dual laser illumination. Error bars are SEMs.
Conformational Dynamics Through FRET on the RS.
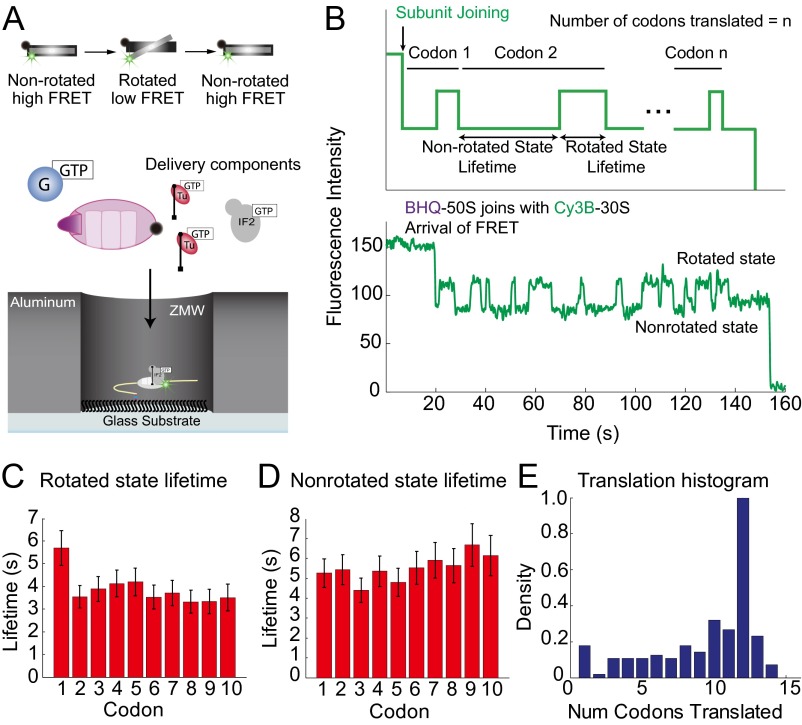
Single-molecule FRET is commonly used to follow composition and conformation of dynamic biological systems in real time at the single-molecule level. In these experiments, fluorescently labeled molecules are immobilized on the surface, and rapid introduction of additional fluorescent reagents or components initiates the reaction. We first characterized and calibrated the automated fluidics system on the custom RS to make it compatible with rapid fluid delivery (Fig. S6). Then, to show that the custom RS is capable of distinguishing subtle FRET transitions, we followed single Escherichia coli ribosomes as the two subunits (small 30S subunit and large 50S subunit) join during initiation and then rotate with respect to one another during translation, an assay that we have previously shown multiple times on TIRF (2, 24). We immobilized 10 nM Cy3B-labeled 30S preinitiation complexes with aminoacylated initiator fMet tRNA (fMet-tRNAfMet), initiation factor IF2, and a biotinylated mRNA [called 6(FK), which codes for an AUG start codon, a sequence of six alternating Phe and Lys codons, followed by a UAA stop codon], on the bottom of the ZMW. We then delivered 200 nM black hole quencher-2–labeled (a nonfluorescent FRET acceptor) (2) 50S subunit along with translation factors [80 nM aminoacylated tRNA-Phe and tRNA-Lys in ternary complex with elongation factor Tu (EF-Tu) and GTP (denoted Phe-tRNAPhe-EF-Tu-GTP and Lys-tRNALys-EF-Tu-GTP) and 80 nM elongation factor G (EF-G)] (Fig. 4A and SI Materials and Methods). The black hole quencher–50S subunit joins and forms the 70S initiation complex, resulting in a decrease in green (Cy3B) intensity because of intersubunit FRET followed by cycles of low–high intensities corresponding to the nonrotated and rotated states of the ribosome formed during polypeptide chain extension (Fig. 4B). Each low–high–low intensity cycle (nonrotated to rotated and back to nonrotated state) corresponds to the ribosome translating one codon of the mRNA (24). Both nonrotated and rotated state lifetimes are comparable with our previous reports (nonrotated lifetime = 5.5 ± 0.8 s and rotated lifetime = 3.9 ± 0.5 s in this study vs. nonrotated state lifetime = 2.6 ± 0.3 s and rotated-state lifetime = 2.0 ± 0.3 s on TIRF) (Fig. 4 C and D) (24). Decreased association rates are likely caused by steric and surface effects, but ribosomal function is clearly maintained (16). With an mRNA consisting of 12 codons, many of the ribosomes (44%) in this experiment are observed translating the entire 12 codons (Fig. 4E) (2, 24). This result is different from what was observed previously with TIRF, where the duration of observation was limited by photobleaching events and thus, most of the ribosomes were observed to translate fewer than 12 codons (only 7% of the ribosomes translate the entire 12 codons). Thus, the enhanced fluorophore photostability lifetimes on the custom RS allow observation of biological processes over long timescales (mean photostability lifetime of 250 s for Cy3B-labeled ribosomes in RS vs. 114 s on TIRF).
Fig. 4.
Conformational dynamics by FRET on the custom RS. (A) Schematic of experiment showing immobilized Cy3B-labeled 30S preinitiation complex in the ZMW through a biotinylated mRNA and delivery of components. (B) Schematic of the expected signal sequence and example trace of ribosome conformational dynamics during elongation. (C) Rotated state (high intensity and low FRET) lifetimes for each codon, comparable with what we have reported previously (2, 24). Number of molecules analyzed was 254. Only a portion (∼40%) of the entire SMRT Cell was analyzed. (D) Nonrotated (low intensity and high FRET) lifetimes for each codon. All error bars are SEMs. (E) Histogram of ribosomes translating the particular number of codons. Most of the ribosomes translate 12 codons, which was expected from the sequence of the mRNA. The small numbers of additional events beyond the 12th codon shown in the histogram are likely caused by readthrough or statistical errors in the identification of transitions by our analytical method.
It is also possible to measure intersubunit rotation, RNA–RNA interactions, and protein–RNA interactions with the Cy3/Cy5 FRET pair on the custom RS (Figs. S7 and S8), despite an ∼0.15 FRET value decrease compared with TIRF caused by the quenching of the Cy5 intensity by the ZMW aluminum walls (16). Thus, the custom RS is capable of discerning subtle FRET signals, and the favorable environment of the ZMWs permits observation of dynamic processes over longer periods of time without dye photobleaching.
Compositional Dynamics on the RS.
Another advantage of ZMWs is that single fluorescent ligand binding and dissociation can be observed at high concentrations (>50 nM) compared with other single-molecule methods because of the small excitation volume within the nanophotonic chambers. Direct detection of ligand binding and dissociation allows observation of the dynamics of multiple ligands simultaneously using dyes spread across the spectrum. Traditional methods for detecting ligand binding and dissociation on TIRF require an FRET pair between the ligand and the immobilized complex; however, these methods are still limited by concentration (<50 nM) as well as the number of components that can be observed simultaneously.
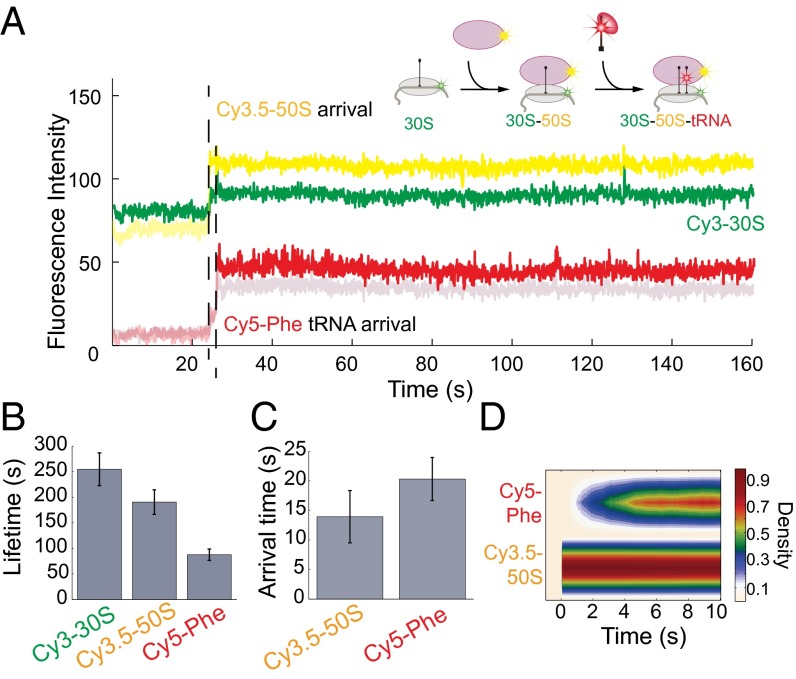
We delivered 200 nM Cy3.5-50S and 200 nM aminoacylated (Cy5)tRNA-Phe in ternary complex with EF-Tu and GTP [denoted as Phe-(Cy5)tRNAPhe-EF-Tu-GTP] to immobilized Cy3B-labeled 30S preinitiation complexes [with initiator fMet-tRNAfMet, IF2, and biotinylated mRNA 6(FK)] on the bottom of the ZMW, similar to the experiment performed in the work by Tsai et al. (25) (Fig. 5A). Binding of the fluorescent ligand to the immobilized preinitiation complex is manifested through a fluorescent pulse of that particular spectral color. Cy3.5-50S joining to an immobilized Cy3B-labeled 30S preinitiation complex is indicated by the appearance of the yellow pulse. Then, the appearance of the red pulse [Phe-(Cy5)tRNAPhe], which is specified by the mRNA sequence, signifies the transition from initiation to elongation (Fig. 5B). The individual arrival pulses can be even distinguished for dyes with significant spectral overlap. The arrival times for the 50S and tRNA as well as the time lag between the 50S arrival and tRNA arrival (∼4 s in this study vs. ∼2 s previously) are comparable with our previous reports (25) (Fig. 5 C and D). The difference may be because of the slightly different delivery kinetics of the two instruments. These results confirm the functionality of the custom RS in studying complex compositional dynamics. Because fluorescent signals from the individually labeled components last several minutes, both binding and departure of fluorescent ligands can be observed.
Fig. 5.
Compositional dynamics of fluorescent ligands on the custom RS. (A) Schematic of the expected signal sequence and example trace of ribosome compositional dynamics during late initiation showing that, although there is bleedthrough between Cy3 and Cy3.5 channels as well as Cy5 and Cy5.5 channels, the signal is sufficient to distinguish between the spectral channels. (B) Lifetimes for the Cy3-30S, Cy3.5-50S, and Cy5-Phe. Number of molecules analyzed was n = 307. Only a portion (∼5%) of the entire SMRT Cell was analyzed. (C) Arrival times for the Cy3.5-50S and Cy5-Phe tRNA. All error bars are SEMs. (D) Postsynchronization of the arrival of Cy5-Phe tRNA to the arrival of the Cy3.5-50S shown as a heatmap. The results were comparable to what was observed previously (25).
High-Throughput Multiplexed Detection on the RS.
Finally, to showcase the instrument’s ability to track composition and conformation through four channels simultaneously with high throughput, we built on the complexities of the previous two experiments. We delivered 200 nM Cy5.5-50S, 200 nM aminoacylated Cy3-tRNA Phe ternary complex, 200 nM aminoacylated Cy5-tRNA Lys ternary complex, and 200 nM EF-G to immobilized Cy3.5-labeled 30S preinitiation through a biotinylated mRNA 6(FK) on the bottom of the ZMW, showing the sequence of events during initiation and elongation as tRNA binds sequentially corresponding to the mRNA sequence, similar to the experiment performed in the work by Uemura et al. (16) (Fig. 6A). Because of the design of the experiment, not only is arrival manifested through the appearance of fluorescence of the particular spectral color, but there is also potential FRET between the 30S and 50S subunits and the two neighboring tRNAs during elongation (26). Under simultaneous green (532 nm) and red (642 nm) laser illumination, we observe the appearance of a purple pulse that corresponds to the binding of the Cy5.5-50S subunit to the immobilized Cy3.5-30S. Simultaneously, the yellow signal drops because of FRET between the two subunits (Cy3.5 to Cy5.5) (detailed explanations are given in Fig. S9). Then, alternating pulses of green [Phe-(Cy3)tRNAPhe] and red [Lys-(Cy5)tRNALys] can be observed as the ribosome decodes the underlying mRNA sequence. FRET between the two tRNAs can also be observed (explanation of trace is given in Fig. S9). With the mRNA consisting of 12 codons, many of the ribosomes (25%) are observed translating the entire 12 codons with 12 tRNA binding events (16) (Fig. 6B). The tRNA arrival times are consistent with what was observed before (Fig. 6C), confirming the functionality of the custom RS in studying complex compositional dynamics. The statistics have been done over n = 3,354 molecules from one experiment, which is more than 10-fold what can be achieved on TIRF for presteady-state experiments done with synchronized sample delivery. The high-throughput nature of the instrument is demonstrated in Fig. 6D, showing the molecules exhibiting all four fluorescent colors, with multiple red and green pulses on a chip. A gallery of additional traces can be found in Figs. S10 and S11. These results emphasize the throughput obtainable on the customized RS.
Fig. 6.
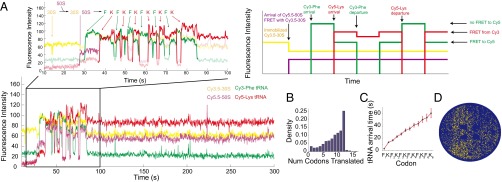
Multiplexed four-color dynamic experiment on the custom RS. (A) Sample trace and schematic showcasing the power of the custom RS to follow simultaneously the composition and conformation of four components. Cy3-tRNA Phe ternary complex, Cy5-tRNA Lys ternary complex, and Cy5.5-50S are delivered to immobilized Cy3.5-30S. Cy5.5-50S first joins with the Cy3.5-30S followed by alternating pulses of Cy3-tRNA Phe (F) and Cy5-tRNA Lys (K) as specified by the 6(FK) mRNA sequence. Despite overlapping bleedthrough signals, the signal is sufficient to distinguish between the spectral channels. (B) Histogram of ribosomes translating the particular number of codons. Most of the ribosomes translate 12 codons, which was expected from the sequence of the mRNA. (C) tRNA arrival times for 12 codons. All error bars are SEMs. Number of molecules analyzed was n = 3,354. (D) A chip view visualizing molecules (yellow spots) exhibiting all four fluorescent colors, with multiple red and green pulses within a given ZMW hole on the chip.
On reaching the stop codon, the last Lys-tRNA is stalled in the ribosome, with the Cy5 signal lasting several minutes. The immobilized Cy3.5-30S signal and the joined Cy5.5-50S signal also last several minutes (mean Cy3.5 lifetime = 232 s; mean Cy5.5 lifetime = 176 s). These results further corroborate the finding that the enhanced fluorophore lifetimes on the custom RS allow observation of biological processes over long timescales. Unlike previous experiments, where an additional 488-nm laser is used to excite Cy2 (16), the use of only 532- and 642-nm lasers to excite four spectral channels prevents additional unwanted photochemical reactions caused by the 488-nm laser.
Thus, ZMWs allow observation of dynamic binding under physiological concentrations of fluorescent ligands, and the signals last stably throughout the movie, with good spectral separation for multicomponent studies. The high-throughput nature of the instrument enables studies of heterogeneous pathways and populations and certain rare biological phenomenon, where a large sample size allows for better statistics of the individual subpopulations. By combining the ability to track composition at high concentrations with conformational information through FRET or other techniques, such as protein-induced fluorescence enhancement (27–29), it is possible to further increase the degrees of information obtained from an experiment through cross-correlations.
Conclusions
The custom RS presented here is a versatile and easy to use single-molecule fluorescence instrument with high temporal sensitivity, spectral resolution, signal sensitivity, and dye photostability. It is capable of performing transient binding and departure experiments as well as long-timescale observations of conformation with subtle FRET changes: mixing these experiments allows cross-correlation of conformational dynamics with the binding and dissociation of multiple interacting ligands (15). By simultaneously detecting ∼75,000 ZMWs, the custom RS provides unprecedented throughput of single-molecule data. With the automated liquid handling robotics on the custom RS, delivery only requires a volume of 25–30 μL, drastically reducing the amount of reagents used compared with traditional TIRF. Furthermore, the ability to perform experiments at physiological concentrations of fluorescent ligands makes it applicable to a broad range of biological systems, including at the single-cell level (30). Any experiment done traditionally with TIRF can now be performed on the custom RS with longer dye photostability lifetimes, higher ligand concentrations, and an increased number of labeled components. The custom RS is a step to the promise of real-time monitoring of biological mechanisms that is widely accessible to the general biophysical community.
Materials and Methods
Modification of PacBio RS Software to Support Our Custom SMFM Experiments.
The instrumentation and workflow of the PacBio RS were optimized for DNA sequencing with automated liquid handling and chip preparation. As such, users of the commercial instrument do not have access to parameters governing microscopy-related functions. To support the requirements of the single-molecule assays described here, we made custom changes to the PacBio RS instrument software. These changes were made in the instrument control software, the user interface, and the software protocol script, and they are generally not user-accessible. We made five key changes.
-
i)
Modified chip alignment algorithm. We introduced a modified procedure that aligns laser beamlets with the ZMW array to reduce dye photobleaching that occurs before data acquisition. This reduction was accomplished by modifying the standard RS SMRT Cell alignment algorithm and workflow to allow coarse and fine positioning of the SMRT Cell without exposing ZMWs to laser illumination (Fig. S3). We also modified the software workflow to tightly couple movie start, lasers open, and fluid dispense events reducing variability in the event timings and helps to further decrease the amount of photobleaching.
-
ii)
Modified inventory scan workflow. Before initiating a standard DNA sequencing run, the instrument scans the contents of the work deck to inventory the reagents and consumables. This process takes ∼7 min and must occur before runs can start. SMFM studies often use labile reagents; thus, the time required for inventory scan can significantly impact assay success. To improve the SMFM workflow, we introduced a modified rapid inventory scan that reduces the time from closing reagent drawers to data acquisition to 30 s (Fig. 1C); this reduced inventory scan time significantly reduces the wait interval prior from SMRT Cell placement on the work deck to the beginning of data acquisition, making it possible to work with reagents with very short half-lives.
-
iii)
Customized instrument software control interface. To control features supporting SMFM studies, we created a unique user interface (Fig. S4). This interface allows custom control over a variety of instrument parameters, including laser powers, acquisition times, camera frame rate, chip clamp temperature, and fluidics protocol. Key run-related experimental parameters are saved in metadata files.
-
iv)
Customized fluidics protocol. The PacBio RS DNA sequencing workflow involves a variety of fluidics steps to mix sequencing reagents and move SMRT Cells to various positions on the work deck. To accommodate custom SMFM assays, a simplified fluidics workflow was developed to support experiments where the SMRT Cell is loaded with reagents on the benchtop. The protocol includes an optional fluidics delivery at the detection stage to initiate reactions.
-
v)
Created a way to switch between modes. We created a way to easily switch between SMFM experimental mode and standard DNA sequencing mode, and therefore, the instrument could be used in either mode.
Single-Molecule Experiments on the Custom RS.
More details on reagent preparation can be found in SI Materials and Methods and previous literature (26, 31–33). The SMRT Cell surface was derivatized with 16.6 μM Neutravidin reagent for 5 min at room temperature and rinsed with Tris-based polymix buffer to remove unbound Neutravidin; 30S preinitiation complexes or DNA oligonucleotides (diluted to 10 or 1 nM, respectively, with Tris-based polymix buffer with oxygen scavenging) (34) were immobilized on surface by incubating the mixture at room temperature for 3 min, after which time the surface was rinsed with the same buffer to remove unbound complexes. Immobilized complexes were distributed in ZMW holes according to Poisson statistics. According to Poisson statistics, the maximum loading percentage to still give probabilistically single complex loading per ZMW hole is ∼30%. Complexes were immobilized such that ∼15% of the ZMWs holes (∼10,000 ZMW holes) are occupied to further disfavor doubly loaded ZMWs. Five-minute movies were acquired at 10 or 30 frames per second.
Supplementary Material
Acknowledgments
We thank Elena LaManna, Marty Badgett, and Kitland Louie for creating custom reagent kits to support use of the proprietary reagents of Pacific Biosciences Inc.. This work was supported by US National Institutes of Health Grants GM51266 (to J. Chen, A.T., and J.D.P.) and GM099687 (to A.N.P., S.E.O., and J.D.P.) and a Stanford Interdisciplinary Graduate Fellowship (to J. Chen).
Footnotes
Conflict of interest statement: R.V.D., K.C., J. Cheng, M.E., P.-L.H., P.L., S.W.T., and D.R.H. are or were employees of Pacific Biosciences Inc., a company commercializing DNA sequencing technologies at the time that this work was completed.
This article is a PNAS Direct Submission. M.D. is a guest editor invited by the Editorial Board.
This article contains supporting information online at www.pnas.org/lookup/suppl/doi:10.1073/pnas.1315735111/-/DCSupplemental.
References
- 1.Moran-Mirabal JM, Craighead HG. Zero-mode waveguides: Sub-wavelength nanostructures for single molecule studies at high concentrations. Methods. 2008;46(1):11–17. doi: 10.1016/j.ymeth.2008.05.010. [DOI] [PubMed] [Google Scholar]
- 2.Chen J, Tsai A, Petrov A, Puglisi JD. Nonfluorescent quenchers to correlate single-molecule conformational and compositional dynamics. J Am Chem Soc. 2012;134(13):5734–5737. doi: 10.1021/ja2119964. [DOI] [PMC free article] [PubMed] [Google Scholar]
- 3.Lee J, et al. Single-molecule four-color FRET. Angew Chem Int Ed Engl. 2010;49(51):9922–9925. doi: 10.1002/anie.201005402. [DOI] [PMC free article] [PubMed] [Google Scholar]
- 4.Hohng S, Joo C, Ha T. Single-molecule three-color FRET. Biophys J. 2004;87(2):1328–1337. doi: 10.1529/biophysj.104.043935. [DOI] [PMC free article] [PubMed] [Google Scholar]
- 5.Lee S, Lee J, Hohng S. Single-molecule three-color FRET with both negligible spectral overlap and long observation time. PLoS One. 2010;5(8):e12270. doi: 10.1371/journal.pone.0012270. [DOI] [PMC free article] [PubMed] [Google Scholar]
- 6.Stein IH, Steinhauer C, Tinnefeld P. Single-molecule four-color FRET visualizes energy-transfer paths on DNA origami. J Am Chem Soc. 2011;133(12):4193–4195. doi: 10.1021/ja1105464. [DOI] [PubMed] [Google Scholar]
- 7.Roy R, Hohng S, Ha T. A practical guide to single-molecule FRET. Nat Methods. 2008;5(6):507–516. doi: 10.1038/nmeth.1208. [DOI] [PMC free article] [PubMed] [Google Scholar]
- 8.Levene MJ, et al. Zero-mode waveguides for single-molecule analysis at high concentrations. Science. 2003;299(5607):682–686. doi: 10.1126/science.1079700. [DOI] [PubMed] [Google Scholar]
- 9.Foquet M, et al. Improved fabrication of zero-mode waveguides for single-molecule detection. J Appl Phys. 2008;103(3):034301–034301-9. [Google Scholar]
- 10.Korlach J, et al. Selective aluminum passivation for targeted immobilization of single DNA polymerase molecules in zero-mode waveguide nanostructures. Proc Natl Acad Sci USA. 2008;105(4):1176–1181. doi: 10.1073/pnas.0710982105. [DOI] [PMC free article] [PubMed] [Google Scholar]
- 11.Lundquist PM, et al. Parallel confocal detection of single molecules in real time. Opt Lett. 2008;33(9):1026–1028. doi: 10.1364/ol.33.001026. [DOI] [PubMed] [Google Scholar]
- 12.Eid J, et al. Real-time DNA sequencing from single polymerase molecules. Science. 2009;323(5910):133–138. doi: 10.1126/science.1162986. [DOI] [PubMed] [Google Scholar]
- 13.Vilfan ID, et al. Analysis of RNA base modification and structural rearrangement by single-molecule real-time detection of reverse transcription. J Nanobiotechnology. 2013;11:8. doi: 10.1186/1477-3155-11-8. [DOI] [PMC free article] [PubMed] [Google Scholar]
- 14.Elting MW, et al. Single-molecule fluorescence imaging of processive myosin with enhanced background suppression using linear zero-mode waveguides (ZMWs) and convex lens induced confinement (CLIC) Opt Express. 2013;21(1):1189–1202. doi: 10.1364/OE.21.001189. [DOI] [PMC free article] [PubMed] [Google Scholar]
- 15.Chen J, Petrov A, Tsai A, O’Leary SE, Puglisi JD. Coordinated conformational and compositional dynamics drive ribosome translocation. Nat Struct Mol Biol. 2013;20(6):718–727. doi: 10.1038/nsmb.2567. [DOI] [PMC free article] [PubMed] [Google Scholar]
- 16.Uemura S, et al. Real-time tRNA transit on single translating ribosomes at codon resolution. Nature. 2010;464(7291):1012–1017. doi: 10.1038/nature08925. [DOI] [PMC free article] [PubMed] [Google Scholar]
- 17.Teng CH, Lionberger TA, Zhang J, Meyhöfer E, Ku PC. Fabrication of nanoscale zero-mode waveguides using microlithography for single molecule sensing. Nanotechnology. 2012;23(45):455301. doi: 10.1088/0957-4484/23/45/455301. [DOI] [PubMed] [Google Scholar]
- 18.Sameshima T, et al. Single-molecule study on the decay process of the football-shaped GroEL-GroES complex using zero-mode waveguides. J Biol Chem. 2010;285(30):23159–23164. doi: 10.1074/jbc.M110.122101. [DOI] [PMC free article] [PubMed] [Google Scholar]
- 19.Zhao J, Branagan SP, Bohn PW. Single-molecule enzyme dynamics of monomeric sarcosine oxidase in a gold-based zero-mode waveguide. Appl Spectrosc. 2012;66(2):163–169. doi: 10.1366/11-06464. [DOI] [PubMed] [Google Scholar]
- 20.Miyake T, et al. Real-time imaging of single-molecule fluorescence with a zero-mode waveguide for the analysis of protein-protein interaction. Anal Chem. 2008;80(15):6018–6022. doi: 10.1021/ac800726g. [DOI] [PubMed] [Google Scholar]
- 21.Samiee KT, Moran-Mirabal JM, Cheung YK, Craighead HG. Zero mode waveguides for single-molecule spectroscopy on lipid membranes. Biophys J. 2006;90(9):3288–3299. doi: 10.1529/biophysj.105.072819. [DOI] [PMC free article] [PubMed] [Google Scholar]
- 22.Altman RB, et al. Enhanced photostability of cyanine fluorophores across the visible spectrum. Nat Methods. 2012;9(5):428–429. doi: 10.1038/nmeth.1988. [DOI] [PMC free article] [PubMed] [Google Scholar]
- 23.Altman RB, et al. Cyanine fluorophore derivatives with enhanced photostability. Nat Methods. 2012;9(1):68–71. doi: 10.1038/nmeth.1774. [DOI] [PMC free article] [PubMed] [Google Scholar]
- 24.Aitken CE, Puglisi JD. Following the intersubunit conformation of the ribosome during translation in real time. Nat Struct Mol Biol. 2010;17(7):793–800. doi: 10.1038/nsmb.1828. [DOI] [PMC free article] [PubMed] [Google Scholar]
- 25.Tsai A, et al. Heterogeneous pathways and timing of factor departure during translation initiation. Nature. 2012;487(7407):390–393. doi: 10.1038/nature11172. [DOI] [PMC free article] [PubMed] [Google Scholar]
- 26.Blanchard SC, Gonzalez RL, Kim HD, Chu S, Puglisi JD. tRNA selection and kinetic proofreading in translation. Nat Struct Mol Biol. 2004;11(10):1008–1014. doi: 10.1038/nsmb831. [DOI] [PubMed] [Google Scholar]
- 27.Hwang H, Kim H, Myong S. Protein induced fluorescence enhancement as a single molecule assay with short distance sensitivity. Proc Natl Acad Sci USA. 2011;108(18):7414–7418. doi: 10.1073/pnas.1017672108. [DOI] [PMC free article] [PubMed] [Google Scholar]
- 28.Munro JB, Wasserman MR, Altman RB, Wang L, Blanchard SC. Correlated conformational events in EF-G and the ribosome regulate translocation. Nat Struct Mol Biol. 2010;17(12):1470–1477. doi: 10.1038/nsmb.1925. [DOI] [PMC free article] [PubMed] [Google Scholar]
- 29.Myong S, et al. Cytosolic viral sensor RIG-I is a 5′-triphosphate-dependent translocase on double-stranded RNA. Science. 2009;323(5917):1070–1074. doi: 10.1126/science.1168352. [DOI] [PMC free article] [PubMed] [Google Scholar]
- 30.Richards CI, et al. Live-cell imaging of single receptor composition using zero-mode waveguide nanostructures. Nano Lett. 2012;12(7):3690–3694. doi: 10.1021/nl301480h. [DOI] [PMC free article] [PubMed] [Google Scholar]
- 31.Blanchard SC, Kim HD, Gonzalez RL, Jr, Puglisi JD, Chu S. tRNA dynamics on the ribosome during translation. Proc Natl Acad Sci USA. 2004;101(35):12893–12898. doi: 10.1073/pnas.0403884101. [DOI] [PMC free article] [PubMed] [Google Scholar]
- 32.Marshall RA, Dorywalska M, Puglisi JD. Irreversible chemical steps control intersubunit dynamics during translation. Proc Natl Acad Sci USA. 2008;105(40):15364–15369. doi: 10.1073/pnas.0805299105. [DOI] [PMC free article] [PubMed] [Google Scholar]
- 33.Dorywalska M, et al. Site-specific labeling of the ribosome for single-molecule spectroscopy. Nucleic Acids Res. 2005;33(1):182–189. doi: 10.1093/nar/gki151. [DOI] [PMC free article] [PubMed] [Google Scholar]
- 34.Aitken CE, Marshall RA, Puglisi JD. An oxygen scavenging system for improvement of dye stability in single-molecule fluorescence experiments. Biophys J. 2008;94(5):1826–1835. doi: 10.1529/biophysj.107.117689. [DOI] [PMC free article] [PubMed] [Google Scholar]
Associated Data
This section collects any data citations, data availability statements, or supplementary materials included in this article.


