

Significance
Certain bacteria use complex assemblies of multiheme proteins to shuttle electrons from the inside of the cell over distances exceeding 100 Å to extracellular substrates. Recently, the first crystal structure of a representative deca-heme protein was solved, but the mechanism of electron conduction remains difficult to probe experimentally. Here we provide detailed molecular-level insight into the kinetics and thermodynamics of charge conduction in this biological wire using high-performance computational tools. Our study reveals an evolutionary design principle of significance to an entire class of heme proteins involved in mediating electron flow between bacterial cells and their environment, a phenomenon both bearing great geochemical importance and opening up a multitude of potential biotechnological applications.
Keywords: respiration, density functional theory
Abstract
The naturally widespread process of electron transfer from metal reducing bacteria to extracellular solid metal oxides entails unique biomolecular machinery optimized for long-range electron transport. To perform this function efficiently, microorganisms have adapted multiheme c-type cytochromes to arrange heme cofactors into wires that cooperatively span the cellular envelope, transmitting electrons along distances greater than 100 Å. Implications and opportunities for bionanotechnological device design are self-evident. However, at the molecular level, how these proteins shuttle electrons along their heme wires, navigating intraprotein intersections and interprotein interfaces efficiently, remains a mystery thus far inaccessible to experiment. To shed light on this critical topic, we carried out extensive quantum mechanics/molecular mechanics simulations to calculate stepwise heme-to-heme electron transfer rates in the recently crystallized outer membrane deca-heme cytochrome MtrF. By solving a master equation for electron hopping, we estimate an intrinsic, maximum possible electron flux through solvated MtrF of 104–105 s−1, consistent with recently measured rates for the related multiheme protein complex MtrCAB. Intriguingly, our calculations show that the rapid electron transport through MtrF is the result of a clear correlation between heme redox potential and the strength of electronic coupling along the wire: thermodynamically uphill steps occur only between electronically well-connected stacked heme pairs. This observation suggests that the protein evolved to harbor low-potential hemes without slowing down electron flow. These findings are particularly profound in light of the apparently well-conserved staggered cross-heme wire structural motif in functionally related outer membrane proteins.
Respiratory electron transfer (ET) is not restricted to the aqueous subunits and membranes inside cells but in specialized cases can also occur across the outer membrane to extracellular space. This possibility is heavily used by dissimilatory metal reducing bacteria (DMRB), which are capable of using extracellular solid metal oxides as terminal respiratory electron sinks, a process that has been suggested to proceed via direct cell-mineral contact (1), extracellular redox shuttles (2), and/or pilus-like appendages (3, 4). Although essential to the survival of the bacterium, extracellular ET also plays an important role in the biogeochemical cycling of transition metals (5–7). It is or could be exploited in a multitude of biotechnological applications ranging from mediator-less biofuel cells (8) to biological waste-to-electricity conversion (1), photocatalytic bioenergy generation (9), and even bioelectronic systems using directional electronic communication between living and nonliving systems (9).
The transport of electrons from the inner membrane, where they accumulate as a result of metabolic activity, across the periplasm and outer membrane to the extracellular space relies on an efficient network of ET proteins (10). It has been known for some time that multiheme c-type cytochromes play a central role in this process. Examples of such systems include the MtrCAB and MtrFDE transmembrane complexes of the bacterial strain Shewanella oneidensis MR-1 that form a biological nanowire of 20 c-type hemes, 10 from MtrC(F) and 10 from MtrA(D), wrapped in a β barrel porin MtrB(E) (10) (Fig. 1A). MtrB(E) does not contain any hemes but is supposed to enable contact for ET between the periplasmic MtrA(D) and the outer membrane cytochrome MtrC(F). The latter is assumed to pass electrons on to extracellular substrates either directly or via redox mediators such as flavins (11).
Fig. 1.

(A) Model of the protein complex MtrFDE. The outer membrane deca-heme cytochrome MtrF [PDB code 3PMQ (12)] is connected to a model of a periplasmic/membrane cytochrome MtrD via a porin MtrE enabling close contact between the two cytochromes across the outer membrane. (B) Heme cofactor arrangement in MtrF. Arrows denote single ET steps from heme i to heme j with rate constant kji (denoted exemplary for pair 1–6), as well as ET steps to/from an external electron acceptor/donor, ki,out and ki,in, shown exemplarily for hemes i = 10 and 5. (C) Three different heme pair motifs found in MtrF. From top to bottom: T-shaped, coplanar, and stacked. dπ orbitals involved in the coupling are also depicted.
The recently published crystal structure for MtrF (12) (and indeed the first one for any deca-heme cytochrome) reveals hemes arranged side by side in a sequence clearly intended for directional electron flow. However, the arrangement is not simply a linear chain of 10 cofactors; rather, it features a peculiar “staggered-cross” formation of the 10 hemes as shown in Fig. 1B, with a central tetra-heme chain between hemes 2 and 7 and two heme-triples branching off in orthogonal directions to yield an octaheme chain between hemes 5 and 10. The relative orientation of adjacent hemes also varies in three apparent types (see depictions in Fig. 1C), with coplanar pairs within the tetra-heme chain, stacked pairs within the two heme-triples, and T-shaped connections between tetra-heme chain and heme-triples. These motifs as such are not uncommon in biological ET: the stacked heme arrangement bears some similarity with the tightly packed chlorophylls in reaction center proteins (13), and a similar T-shaped connection is found for the heme a-a3 pair in cytochrome c oxidase (14) (Fig. S1). However, it is thus far an open question why all three heme-heme motifs are present in MtrF, and why the 10 hemes are arranged in a nonlinear cross-wired fashion.
Given the central role of multiheme cytochromes like MtrF in the extracellular ET processes of DMRB, elucidating their function on a molecular level is therefore at the heart of coming to understand and possibly adapt these astonishing capabilities. However, elementary aspects of electron transport through these proteins are difficult to assess in experiment. For example, although overall potential windows of operation for the whole protein can be established (12, 15), the cofactors’ almost identical chemical environment impedes deconvolution into redox potentials of single structurally assignable hemes (12). Similarly, although the analysis of tunneling spectroscopy-derived current-voltage curves for MtrC single molecules yielded two individual redox potentials consistent with the whole protein window (16), tunneling experiments do not necessarily involve the same heme-to-heme hopping mechanism of electron transmission as expected in the native protein function.
Computational methods fill this accessibility gap to provide molecular-level insight. They are not only able to elucidate properties of individual cofactors in these multiheme cytochromes but also allow for the analysis of structure-function relationships: Our recent previous study of the thermodynamics of electron transfer along hemes in MtrF (17) revealed a roughly symmetric free energy profile featuring two thermodynamic barriers of 0.2 eV, where heme redox potentials were lowered by the close proximity of negatively charged propionate side chains of adjacent hemes. Although this provides the protein with two solvent-exposed heme sites capable of spontaneously reducing the key redox shuttle flavin mononucleotide (FMN), it also raises the puzzling question of how these barriers are incorporated into the chain without affecting through-protein electron transport.
To answer this question, we now present extensive simulation work on the kinetics of stepwise and overall ET in MtrF. Specifically, we carry out classical molecular dynamics (MD) and quantum mechanics/molecular mechanics (QM/MM) calculations to obtain electronic couplings for sequential ET between each of the nine adjacent heme pairs in MtrF. Combined with our previous work, this completes the set of quantities necessary to describe ET rates in the framework of nonadiabatic Marcus theory, an approach found to be appropriate to describe ET through MtrF. The simulations reveal that the rapid transport rate through MtrF is a consequence of a subtle balancing act: energetically uphill steps occur only between the tightest packed, electronically best-connected hemes. The potential slowing of ET rates by low potential hemes is thus compensated by high electronic coupling. In fact, the rates for the thermodynamically unfavorable ET steps do not fall below those for the thermodynamically reversible steps. As a result, the maximum intrinsic electron flux through the heme wire is maintained at 104−105 s−1, just slightly higher than recently measured acceptor-limited transport rates through the multiheme protein complex MtrCAB (18). The structural similarity of MtrF with homologs UndA (19) and MtrC (20) allows us to generalize our findings to these cytochromes also, suggesting an important electron transfer strategy in nature well conserved because of its efficiency for long-range electron transport.
Results
Heme-to-Heme Electronic Coupling.
As the separation distances between heme cofactors are short in MtrF (from van der Waals distance, 3.6 Å, to 8.3 Å), we assume that ET occurs via sequential through-space electron tunneling (hopping) between adjacent heme pairs (i, j = 1−10)
 |
Pathway calculations (21) were carried out to confirm this assertion. Similar results were obtained previously for heme a to a3 ET in cytochrome c oxidase suggesting that through-space tunneling is indeed the main mechanism for such short heme-heme distances (22). In accord with nonadiabatic Marcus theory (23), the electronic coupling matrix element is calculated for the transition state where initial and final state are degenerate. This ensemble was sampled for each of the nine ET reactions in solvated MtrF using molecular dynamics simulation. Configurations from the respective MD trajectories were taken to calculate heme-heme electronic coupling matrix elements (Hab) using a previously introduced fragment-orbital density functional theory (FODFT) method within a QM/MM scheme (see Materials and Methods for details). The combined set of coupling values obtained are plotted in Fig. 2 against the heme edge-to-edge distance (r). The data are color-coded according to the type of heme-heme mutual orientation: the stacked pairs at the entrance and exit of the octaheme chain are shown in blue (10–9, 9–8, 3–4, and 4–5), the T-shaped pairs connecting the octa- and tetra-heme chains in red (8–6 and 1–3), and the coplanar pairs of the tetra-heme chain in green (6–7, 6–1, and 1–2).
Fig. 2.

Modulus of electronic coupling matrix elements (|Hab|) for ET between ferrous and ferric heme cofactors in MtrF as a function of the heme edge-to-edge distance. The scattered data points are obtained from configurations sampled with molecular dynamics simulation at room temperature. They are colored according to the heme-heme orientation: stacked in blue, T-shaped in hollow red, and coplanar in green. |Hab| values obtained for the crystal structure configuration are indicated by triangles (four for stacked, two for T-shaped, three for coplanar). Root-mean-square averages of the scattered data points,  , were calculated for bins (denoted by black circles) of width 0.4 (Left) and 0.6 Å (Right) and fit to two separate exponentials, one for the stacked heme pairs and one for the T-shaped/coplanar heme pairs (solid black lines). Corresponding free energy-optimized ET-rates
  (λ = −ΔA) are indicated on the axis to the right. The Moser-Dutton ruler is shown for the default packing density (ρ = 0.76, dotted lines) and for a reduced packing density accounting for through space tunneling [ρ = 0.48 (39), dashed lines]. For comparison, the electron fluxes from heme 10 to the three exit sites 2, 5, and 7 are 0.9 × 10⁴, 1.5 × 10⁴, and 2.6 × 10⁵ s−1, respectively.
The stacked pairs exhibit the smallest distances (3.6–5.0 Å), followed by the T-shaped (5.2–6.5 Å) and coplanar motif (5.3–8.3 Å). For a given donor-acceptor distance, the coupling matrix elements fluctuate strongly in particular for the T-shaped and coplanar motifs as a consequence of the orientational thermal motion of the donor and acceptor hemes. The distance dependence of the resultant thermal root-mean-square averages,  (denoted by circles), is best described by two exponential decay constants: one for the stacked motif, β = 2.25 Å−1 and A = 5.55 meV (R2 = 0.9997), and one for the T-shaped/coplanar motifs, β = 0.8 Å−1 and A = 0.8 meV (R2 = 0.85), where we used the fit function
  , r0 = 3.6 Å. Although a fit of all data to a single exponential with parameters β = 1.65 Å−1 and A = 3.77 meV yields a reasonable correlation of R2 = 0.91, two separate fits clearly give a better description of the data. A somewhat smaller decay constant is obtained from a single exponential fit when the Fe-Fe distance metric is used (β = 1.30 Å−1, R2 = 0.90; see Fig. S2 and SI Text for discussion).
The decay constants obtained for the different motifs are within the range of previously reported values for idealized model heme-heme motifs in the gas phase (24). The β values obtained from a single exponential fit to all data are a little larger than experimental estimates for tunneling through proteins: β = 1.4 Å−1 using the edge-to-edge metric (25) and β = 1.1 Å−1 using the Fe-Fe distance (26, 27). The small deviation can be rationalized by the fact that our couplings are based on through-space tunneling between closely spaced cofactors (as justified above), whereas the experimental data are predominantly based on protein-mediated electron tunneling reactions over significantly longer distances. Interestingly, the free-energy optimized tunneling rates corresponding to the calculated couplings ( , ΔA = −λ) are one to two orders of magnitude below the empirical Moser-Dutton ruler (dashed and dotted black lines in Fig. 2) (25). It is very unlikely that this is due to inaccuracies of our calculations, as the same computational methodology was shown to give chemically accurate predictions for ET reaction rates in aqueous solution (28) and for coupling matrix elements in small π-conjugated molecules (29). For small distances, the Moser-Dutton ruler relies on a few known rates for bacterial reaction center and photosystem proteins. Visual inspection of crystal structures reveals that despite similar edge-to-edge distances, the porphyrin overlap in the special pair of the reaction center protein is much larger than in MtrF (Fig. S1), which may explain why the computed optimized tunneling rates are not well described by the empirical distance relationship. Our findings reinforce the importance of specific local molecular structure and charge distribution effects on understanding multiheme ET kinetics beyond empirical rules.
Correlation Between Electronic Coupling and Driving Force.
The free energy landscape for single-electron flow through MtrF, as we recently reported (17), is shown in Fig. 3A and juxtaposed to the average electronic coupling  for each individual heme-heme pair, depicted by circles using the same color code as in Fig. 2. Hemes are arranged following the octa-heme chain from heme 10 to heme 5, with hemes 7 and 2 branching off from heme 6 and 1, respectively. In this presentation, it becomes apparent that the couplings are virtually symmetric with respect to the center of the protein, correlating with the quasi-symmetry of the cofactor arrangement in MtrF (although the surrounding protein is not symmetric). Comparing this “coupling landscape” with the free energy landscape, a correlation between the two emerges: electronic couplings are particularly high for ET with large free energy changes (peaked topology) and significantly smaller for ET with small free energy changes (flat topology). Evidently, electronic coupling is greatest where it matters most: at the energetic up-hill steps 10 → 9 and 3 → 4 in the forward direction for conduction (10 → 5) and at hemes 5 → 4 and 8 → 9 in the reverse direction (5 → 10).
Fig. 3.

(A) Computed redox potentials of the heme cofactors in MtrF vs. standard hydrogen electrode, taken from ref. 17, and root-mean-square average couplings for each pair as indicated by circles with area proportional to  . The x axis refers to the heme labels defined in Fig. 1B. Numerical values for
  are indicated in units of meV, and the same color code as in Fig. 2 is used. (B) Rate constants kET for ET between heme pairs in MtrF for the forward direction (heme 10 → 5, full colors) and for the backward direction (heme 5 → 10, shaded colors). Each bar indicates the rate constant between the two hemes denoted at the base to the left and to the right of the bar unless indicated otherwise. Note the symmetry between forward and backward rates for electron flow along the 10 → 5 and 5 → 10 directions.
Heme-to-Heme ET Rates.
Considering the previously reported values for reorganization free energy in solvated MtrF [λ = 0.7 − 1.1 eV, obtained from electronically polarizable force field and solvent models (30–32)], we find that  . That is, the ET is well within the nonadiabatic regime, justifying the picture of a localized electron hopping along the heme wire. Therefore, the computed electronic couplings and previously determined values for λ and driving force (ΔA = −0.2 to +0.1 eV) (17) can be used to calculate microscopic heme-to-heme ET rate constants according to Eq. 3. The stepwise rate constants obtained for electron conduction along the forward (heme 10 → heme 5) and reverse (heme 5 → heme 10) directions are shown in Fig. 3B and summarized in Table S1. The rates span six orders of magnitude, ranging from 2.4 × 10³ s−1 for the slowest ET 7 → 6, to 3.1 × 10⁹ s−1 for the fastest ET 4 → 5. Interestingly, the rates decrease by a factor of at most three if the thermally averaged electronic couplings are replaced by the values obtained for the single crystal structure configuration in Eq. 3, indicating that thermal averaging, although important for a quantitative description, has only a moderate effect for this protein. The small influence of finite temperature might be a consequence of the tight binding of the cofactors to the protein via two covalent cysteine linkages in addition to the coordinative ligand bonds. The average heme edge-to-edge distances obtained from MD simulation are indeed very similar to the distances in the crystal structure (Table S2). Notably, the rate constants are almost symmetric in forward and reverse directions, due to the symmetry in electronic couplings and driving force along the chain (effects due to the nonsymmetric variations in λ are minor). The only asymmetry is caused by pairs 6–7 and 1–2, as discussed elsewhere (17).
Electron Flux Through MtrF.
In the following, we use the computed heme-to-heme ET rates to estimate the overall steady-state electron flux (J) through MtrF using a master equation formalism as detailed in Materials and Methods. We consider the case where the rate for ET from the electron donor to the electron entrance site (heme 10) is much larger than the smallest heme-to-heme ET rate in the protein and vary the rate for ET from the electron exit site (heme 2, 5, or 7) to the electron accepting substrate (kout). The results are shown in Fig. 4. We find that for small output rates J increases linearly with kout to asymptotically reach a maximum flux (Jmax) for large values of kout. The relation is well described by the functional form  as shown in SI Text and Fig. S3. The values obtained are Jmax = 0.9 × 10⁴, 1.5 × 10⁴, and 2.6 × 10⁵ s−1 for electron exit from hemes 2, 5, and 7, respectively. The corresponding rate-limiting single steps for these routes are 1.2 × 10⁴ (at 1 → 2), 2.9 × 10⁴ (at 1 → 3), and 3.0 × 10⁵ (at 6 → 7). Hence, the order of magnitude difference in the respective rate-limiting steps translates into a corresponding difference in Jmax. The flow out of heme 7 is particularly large as it avoids the slow ET steps between coplanar hemes, 6 → 1 (k16 = 4.0 × 10⁴).
Fig. 4.

Dependence of the electron flux through MtrF, J, on the rate constant for ET from the protein exit site to an external electron acceptor, kout. The electron entrance site is heme 10 and the electron exit site is heme 5 (black solid line), heme 2 (black dashed line), and heme 7 (black dotted line); the maximal electron fluxes are 1.5 × 10⁴, 0.9 × 10⁴, and 2.6 × 10⁵ s−1, respectively. Experimentally measured electron fluxes through MtrCAB to solid Fe(III)-oxide particles are shown in red for Lepidocrocite (dash dotted), hematite (dotted), and goethite (dashed) (18).
Discussion
Our calculations have revealed a remarkable evolutionary design principle for long-range biological ET. The electronic coupling and driving force are correlated along the heme wires in MtrF; free energy uphill steps occur precisely for those heme pairs that have the largest electronic couplings. Hence, the low potential hemes are incorporated into the protein in a way that does not adversely affect through-protein transport. They may allow for a more efficient reduction of low potential substrates such as flavins. This explanation remains a hypothesis, however, because intermolecular reduction depends on other factors as well, such as the lifetime of the protein-flavin complex, which is unknown, and the residence time of the electron on the high potential hemes, the latter depending on the overall charge state of the protein. The master equation approach enables us to investigate possible scenarios where the subtle balance between electronic couplings and free energies is lost. For example, if we assume that the stacked hemes (high couplings) are replaced by coplanar hemes (low couplings) and that the free energy landscape remains the same, the maximum electron flux would decrease 17-fold from 1.5 × 10⁴ to 9 × 10² s−1. At the same time, the distance traveled by the electron would increase by only a fraction of the one for the original system. Alternatively, considering the couplings as fixed and changing the redox landscape such that the first 0.2-eV uphill step moves from 10 → 9 (stacked) to 6 → 1 (coplanar) would yield a 25-fold decrease to 6 × 10² s−1. These estimates clearly demonstrate that a suitable match of cofactor alignment and redox potentials is key to sustain the inherent maximum possible electron flow to important environmental electron acceptors.
The flux calculations shown in Fig. 4 can be used to interpret recent experiments where MtrCAB was assembled into a proteoliposome and the rates for ET from an internal chemical electron donor (methyl viologen) across the lipid membrane via MtrCAB to solid phase Fe(III) oxides were measured (18). The overall rate constant reported was dependent on the type of Fe(III) mineral used, ranging from 1,133 to 8,500 s−1. This observation indicates that transport kinetics was limited by ET from the terminal heme to the mineral. Hence, the highest value reported (8,500 s−1) should be considered as a lower limit to the intrinsic flux calculated here for MtrF, a functional homolog of MtrC. Interestingly, this highest experimental rate is not much smaller than our calculated maximum flux through MtrF, ranging from 104 to 105 s−1 depending on the heme exit site. A similar intrinsic flux seems feasible for MtrCAB: modeling MtrA as a dimer of two NrfB (33) proteins, half-inserted into the membrane porin MtrB and docked to MtrF (in place of MtrC) (10), we obtain a steady-state current similar to the one for MtrF alone, provided the free energy landscape for ET through MtrA is not unfavorably shaped (see SI Text for details and Fig. S4). This prediction is based on the reasonable assumptions that heme edge-to-edge distances are not larger in MtrA than in MtrF (which is true for NrfB, used here as a model) and that reorganization free energies in the solvent exposed part of MtrA are also comparable to MtrF. As an aside, a similar flux calculation for electron transport through solvated MtrF in contact with two electrodes (or an approximate adaption to a dry environment) cannot reproduce the nA currents observed in recent current-voltage measurements on conductive bacterial pili (3) (Fig. S5). Although possible explanations are speculative at this point, we think that the high currents observed in experiments are due to the involvement of redox states inaccessible under solution conditions without external bias, as discussed earlier in Wigginton et al. (16, 34).
Our findings open up questions regarding the functionality of MtrF: given that stacked heme pairs exhibit the highest ET rates, why does the protein feature nonstacked heme pairs at all? Three issues seem relevant here. First, a higher total flux may not yield any metabolic benefit if the preceding metabolic reactions or the electron output to external substrates is rate limiting. In this case, there is no evolutionary pressure to increase the flux by further optimizing the mutual orientations of all heme pairs. Second, the coplanar pairs may serve a distinct function in addition to electron transport along the heme network. The coplanar tetra-heme chain 2–1-6–7 exhibits a large contiguous surface area, which could possibly form an effective multipoint contact site for solid substrates that would still be accessible if hemes 10 and 5 were already docking to substrates or partner cytochromes. Structural modeling indicates that it would be difficult to obtain the same contiguous area if hemes 1 and 6 were part of a continuous stacked octa-heme chain. Third, nonstacked hemes are necessary for the formation of the staggered cross protein motif. The latter could serve as a building block for a supramolecular 2D network as previously assumed in a modeling study of a conducting bacterial pilus (35).
Further conclusions can be drawn in regard to protein design. According to our calculations, the electronic couplings for through-space tunneling are solely determined by the heme-heme packing motif and interheme distances. The effect of the protein surrounding the two closely spaced heme groups can be neglected to a good approximation. The values of  calculated in the QM/MM setting differ by at most 10% from those calculated in the gas phase in the absence of the protein environment, implying that the influence of protein electrostatics on Hab is indeed negligible. The remarkable implication is that as long as ET takes place via through-space tunneling without protein mediation, electronic couplings and driving forces could be modulated independently from each other.
It is intriguing to note that the same staggered cross heme arrangement found for MtrF has also been established for its homolog UndA (19) and has been inferred from homology modeling for MtrC (20). Hence, this motif appears to have a much wider significance. The negligible influence of the environment on the electronic couplings implies that our results for the nine heme pair couplings in MtrF most likely can be transferred to these cytochromes. UndA also features the same proximity between propionate side chains of the outermost hemes of the octa-heme chain and the histidines of the adjacent hemes, which we previously found to be a major factor in decreasing the redox potential of hemes 4 and 9 in MtrF, respectively (17). Thus, they might feature the same barriers in their free energy profiles as MtrF, with the overall profile and rates potentially being modulated with respect to MtrF through a different protein environment.
Conclusions
Our work unveils some evolutionary design principles for long-range biological electron transport. We show that long-range electron transport through the multiheme protein MtrF, and likely its complexes, is not a steady downhill process but one with (potentially many) ups and downs on the free energy landscape. The calculations uncover nature’s method of implementing a dual-purpose electron transport system: uphill processes, possibly necessary for reduction of soluble electron shuttles, are coupled to high electronic coupling matrix elements between closely spaced hemes to achieve metabolically required rates. Heme distance and orientation are suitably selected for this purpose. This picture is consistent with the tight coupling between ET and molecular redoxchemistry well known for oxidoreductases, whose primary function is the reduction/oxidation of soluble substrates within the cell, but expanding its significance in that the same principle carries over to the multiheme proteins that support extracellular respiration.
Materials and Methods
Classical MD.
For simulation of the transition state for ET, the charges of the two heme cofactors in question were morphed to the half-reduced state by setting them to the averages of the charges for the reduced and oxidized state. For each of the nine heme-heme pairs, simulations were initiated from previously equilibrated models of solvated MtrF [specifically, from thermodynamic integration runs with coupling parameter for heme oxidation = 0.5, initiated from the crystal structure of MtrF, Protein Databank (PDB) ID 3PMQ (12); see ref. 17]. The protein was equilibrated for 6 ns at constant pressure and temperature and the following 100 ns used for the calculation of electronic coupling matrix elements. The classical MD simulations were carried out with the the AMBER03 protein force field (36) together with the TIP3P water model (37). Force field parameters for the heme cofactors were taken from earlier work (32, 38, 39).
Hab from QM/MM.
Twenty-five snapshots per pair were then selected from the corresponding MD trajectories in 4-ns intervals, and the electronic coupling matrix elements were computed using the FODFT method as implemented in the CPMD program (29, 40) on heme QM models interacting with the environment as implemented in the CPMD/Gromos QM/MM coupling scheme (41), and without interaction for comparison. The QM system was comprised of the porphyrin ring with all substituents saturated by a dummy hydrogen atom and the axial histidines replaced by imidazole ligands saturated with a hydrogen at the β-C atom. The Perdew–Burke–Erzerhof (PBE) functional (42) was used for the QM part together with Goedecker–Hutter pseudopotentials (43) (in a semicore version for Fe). The plane-wave cutoff was 130 Ry. Experimental evidence gives the 3d electron configuration of low-spin ferric hemes as  , with dπ denoting a linear combination of the out-of-plane orbitals dxz and dyz (44), implying that the ET between two hemes is mediated by the two dπ states. We found that with PBE, the highest occupied molecular orbital for ferrous heme was consistently dxy, followed by the two closely spaced (quasi-degenerate) dπ orbitals, denoted here dπ,1 and dπ,2. Thus, we chose the latter two orbitals on the donor (D) and acceptor (A) for the coupling calculation
 |
where  is the Kohn–Sham Hamiltonian constructed from the fragment orbitals of the reduced donor and acceptor hemes (29, 40) as obtained from QM/MM calculations. The final coupling matrix element is taken as the root mean square over all four possible couplings according to Eq. 2 (23). The additional correction factor ccorr (estimated as 1.75) accounts for the lack of polarization due to the classical treatment of the partner heme and is derived as explained in Table S3. FODFT couplings did not change significantly if a hybrid functional (PBE0) was used (Table S4). The thermal averages of the squared coupling matrix elements and the previously calculated values for driving forces ΔA17 and reorganization free energies λ30 are then inserted in Eq. 3 (45) to obtain heme-to-heme ET rates
 |
The rates kET for all heme-to-heme ET steps, together with the corresponding values for  , λ and ΔA are summarized in Table S1.
Electron Flux from the Master Equation.
We assume that the electron flux from heme i to heme j,  , can be described by a master equation
  , with kji being the ET rate constant according to Eq. 3 and Pi being the electron population of heme i (0 for oxidized heme, 1 for reduced) (46, 47). The terms (1 − Pi) account for the fact that each heme can be occupied by only one excess electron. The external electron donor and acceptor are assumed to be in excess concentration. Thus, the fluxes into the protein entrance site (heme 10) and out of the protein exit site (e.g., heme 5) are given by
  and
and  , respectively. Requiring steady state, i.e.,
  gives the following recursive relationship for the steady-state populations:
  , which can be solved for all Pi. Insertion of Pi and Pj in the above expression for Jji gives the steady-state flux J = Jji. For the modeling of electron flux through MtrF (Fig. 4), we assumed that ET in and out of the protein is irreversible
 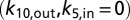 . This assertion should give a good description of the experimental conditions, where the redox potential of the external donor (MV) is much lower than the ones for the hemes, and the external acceptor (reduced iron oxide) is removed from equilibrium through dissolution (18). Similar calculations are carried out for the exit sites of hemes 2 and 7.
Supplementary Material
Acknowledgments
We thank Cortland Johnson [Pacific Northwest National Laboratory (PNNL)] and Julian Breuer for helping with the preparation of Figs. 1 and 3. This work was carried out at the UK High Performance Computing Facility, to which access was granted via the Materials Chemistry Consortium (Grant EP/F067496 from the Engineering and Physical Sciences Research Council), and on Chinook at Environmental Molecular Sciences Laboratory, a national scientific user facility sponsored by the Department of Energy Office of Biological and Environmental Research and located at PNNL. M.B. gratefully acknowledges an IMPACT studentship cosponsored by University College London and PNNL through the US Department of Energy Office of Biological and Environmental Research Subsurface Biogeochemistry Research Science Focus Area program at PNNL (which provided support for K.M.R.). J.B. thanks the Royal Society for a University Research fellowship.
Footnotes
The authors declare no conflict of interest.
This article is a PNAS Direct Submission.
This article contains supporting information online at www.pnas.org/lookup/suppl/doi:10.1073/pnas.1316156111/-/DCSupplemental.
References
- 1.Xiong YJ, et al. High-affinity binding and direct electron transfer to solid metals by the Shewanella oneidensis MR-1 outer membrane c-type cytochrome OmcA. J Am Chem Soc. 2006;128(43):13978–13979. doi: 10.1021/ja063526d. [DOI] [PubMed] [Google Scholar]
- 2.Coursolle D, Gralnick JA. Modularity of the Mtr respiratory pathway of Shewanella oneidensis strain MR-1. Mol Microbiol. 2010;77:995. doi: 10.1111/j.1365-2958.2010.07266.x. [DOI] [PubMed] [Google Scholar]
- 3.El-Naggar MY, et al. Electrical transport along bacterial nanowires from Shewanella oneidensis MR-1. Proc Natl Acad Sci USA. 2010;107(42):18127–18131. doi: 10.1073/pnas.1004880107. [DOI] [PMC free article] [PubMed] [Google Scholar]
- 4.Gorby YA, et al. Electrically conductive bacterial nanowires produced by Shewanella oneidensis strain MR-1 and other microorganisms. Proc Natl Acad Sci USA. 2006;103(30):11358–11363. doi: 10.1073/pnas.0604517103. [DOI] [PMC free article] [PubMed] [Google Scholar]
- 5.Myers CR, Nealson KH. Bacterial manganese reduction and growth with manganese oxide as the sole electron acceptor. Science. 1988;240(4857):1319–1321. doi: 10.1126/science.240.4857.1319. [DOI] [PubMed] [Google Scholar]
- 6.Straub KL, Benz M, Schink B. Iron metabolism in anoxic environments at near neutral pH. FEMS Microbiol Ecol. 2001;34(3):181–186. doi: 10.1111/j.1574-6941.2001.tb00768.x. [DOI] [PubMed] [Google Scholar]
- 7.Richardson DJ, Fredrickson JK, Zachara JM. Electron transport at the microbe-mineral interface: A synthesis of current research challenges. Biochem Soc Trans. 2012;40(6):1163–1166. doi: 10.1042/BST20120242. [DOI] [PubMed] [Google Scholar]
- 8.Yi H, et al. Selection of a variant of Geobacter sulfurreducens with enhanced capacity for current production in microbial fuel cells. Biosens Bioelectron. 2009;24(12):3498–3503. doi: 10.1016/j.bios.2009.05.004. [DOI] [PubMed] [Google Scholar]
- 9.Jensen HM, et al. Engineering of a synthetic electron conduit in living cells. Proc Natl Acad Sci USA. 2010;107(45):19213–19218. doi: 10.1073/pnas.1009645107. [DOI] [PMC free article] [PubMed] [Google Scholar]
- 10.Hartshorne RS, et al. Characterization of an electron conduit between bacteria and the extracellular environment. Proc Natl Acad Sci USA. 2009;106(52):22169–22174. doi: 10.1073/pnas.0900086106. [DOI] [PMC free article] [PubMed] [Google Scholar]
- 11.Okamoto A, Hashimoto K, Nealson KH, Nakamura R. Rate enhancement of bacterial extracellular electron transport involves bound flavin semiquinones. Proc Natl Acad Sci USA. 2013;110(19):7856–7861. doi: 10.1073/pnas.1220823110. [DOI] [PMC free article] [PubMed] [Google Scholar]
- 12.Clarke TA, et al. Structure of a bacterial cell surface decaheme electron conduit. Proc Natl Acad Sci USA. 2011;108(23):9384–9389. doi: 10.1073/pnas.1017200108. [DOI] [PMC free article] [PubMed] [Google Scholar]
- 13.Camara-Artigas A, Brune D, Allen JP. Interactions between lipids and bacterial reaction centers determined by protein crystallography. Proc Natl Acad Sci USA. 2002;99(17):11055–11060. doi: 10.1073/pnas.162368399. [DOI] [PMC free article] [PubMed] [Google Scholar]
- 14.Tsukihara T, et al. The low-spin heme of cytochrome c oxidase as the driving element of the proton-pumping process. Proc Natl Acad Sci USA. 2003;100(26):15304–15309. doi: 10.1073/pnas.2635097100. [DOI] [PMC free article] [PubMed] [Google Scholar]
- 15.Hartshorne RS, et al. Characterization of Shewanella oneidensis MtrC: A cell-surface decaheme cytochrome involved in respiratory electron transport to extracellular electron acceptors. J Biol Inorg Chem. 2007;12(7):1083–1094. doi: 10.1007/s00775-007-0278-y. [DOI] [PubMed] [Google Scholar]
- 16. Wigginton NS, Rosso KM, Jr MF (2007) Mechanisms of electron transfer in two decaheme cytochromes from a metal-reducing bacterium. J Phys Chem B 111(44):12857–12864. [DOI] [PubMed]
- 17.Breuer M, Zarzycki P, Blumberger J, Rosso KM. Thermodynamics of electron flow in the bacterial deca-heme cytochrome MtrF. J Am Chem Soc. 2012;134(24):9868–9871. doi: 10.1021/ja3027696. [DOI] [PubMed] [Google Scholar]
- 18.White GF, et al. Rapid electron exchange between surface-exposed bacterial cytochromes and Fe(III) minerals. Proc Natl Acad Sci USA. 2013;110(16):6346–6351. doi: 10.1073/pnas.1220074110. [DOI] [PMC free article] [PubMed] [Google Scholar]
- 19.Edwards MJ, et al. The crystal structure of the extracellular 11-heme cytochrome UndA reveals a conserved 10-heme motif and defined binding site for soluble iron chelates. Structure. 2012;20(7):1275–1284. doi: 10.1016/j.str.2012.04.016. [DOI] [PubMed] [Google Scholar]
- 20.Edwards MJ, Fredrickson JK, Zachara JM, Richardson DJ, Clarke TA. Analysis of structural MtrC models based on homology with the crystal structure of MtrF. Biochem Soc Trans. 2012;40(6):1181–1185. doi: 10.1042/BST20120132. [DOI] [PubMed] [Google Scholar]
- 21.Beratan DN, Betts JN, Onuchic JN. Protein electron transfer rates set by the bridging secondary and tertiary structure. Science. 1991;252(5010):1285–1288. doi: 10.1126/science.1656523. [DOI] [PubMed] [Google Scholar]
- 22.Tan ML, Balabin I, Onuchic JN. Dynamics of electron transfer pathways in cytochrome C oxidase. Biophys J. 2004;86(3):1813–1819. doi: 10.1016/S0006-3495(04)74248-4. [DOI] [PMC free article] [PubMed] [Google Scholar]
- 23.Newton MD. Quantum chemical probes of electron-transfer kinetics: The nature of donor-acceptor interactions. Chem Rev. 1991;91:767–792. [Google Scholar]
- 24.Smith DMA, Rosso KM, Dupuis M, Valiev M, Straatsma TP. Electronic coupling between heme electron-transfer centers and its decay with distance depends strongly on relative orientation. J Phys Chem B. 2006;110(31):15582–15588. doi: 10.1021/jp057068r. [DOI] [PubMed] [Google Scholar]
- 25.Moser CC, Chobot SE, Page CC, Dutton PL. Distance metrics for heme protein electron tunneling. Biochim Biophys Acta. 2008;1777(7-8):1032–1037. doi: 10.1016/j.bbabio.2008.04.021. [DOI] [PMC free article] [PubMed] [Google Scholar]
- 26.Gray HB, Winkler JR. Electron tunneling through proteins. Q Rev Biophys. 2003;36(3):341–372. doi: 10.1017/s0033583503003913. [DOI] [PubMed] [Google Scholar]
- 27.Gray HB, Winkler JR. Electron flow through metalloproteins. Biochim Biophys Acta. 2010;1797(9):1563–1572. doi: 10.1016/j.bbabio.2010.05.001. [DOI] [PubMed] [Google Scholar]
- 28.Oberhofer H, Blumberger J. Insight into the mechanism of the Ru2+-Ru3+ electron self-exchange reaction from quantitative rate calculations. Angew Chem Int Ed Engl. 2010;49(21):3631–3634. doi: 10.1002/anie.200906455. [DOI] [PubMed] [Google Scholar]
- 29.Oberhofer H, Blumberger J. Electronic coupling matrix elements from charge constrained density functional theory calculations using a plane wave basis set. J Chem Phys. 2010;133(24):244105. doi: 10.1063/1.3507878. [DOI] [PubMed] [Google Scholar]
- 30.Breuer M, et al. Molecular structure and free energy landscape for electron transport in the decahaem cytochrome MtrF. Biochem Soc Trans. 2012;40(6):1198–1203. doi: 10.1042/BST20120139. [DOI] [PubMed] [Google Scholar]
- 31.Blumberger J, Lamoureux G. Reorganization free energies and quantum corrections for a model electron self-exchange reaction: Comparison of polarizable and non-polarizable solvent models. Mol Phys. 2008;106(12-13):1597–1611. [Google Scholar]
- 32.Blumberger J. Free energies for biological electron transfer from QM/MM calculation: Method, application and critical assessment. Phys Chem Chem Phys. 2008;10(37):5651–5667. doi: 10.1039/b807444e. [DOI] [PubMed] [Google Scholar]
- 33.Clarke TA, Cole JA, Richardson DJ, Hemmings AM. The crystal structure of the pentahaem c-type cytochrome NrfB and characterization of its solution-state interaction with the pentahaem nitrite reductase NrfA. Biochem J. 2007;406(1):19–30. doi: 10.1042/BJ20070321. [DOI] [PMC free article] [PubMed] [Google Scholar]
- 34.Wigginton NS, Rosso KM, Lower BH, Shi L, Hochella MFJ. Electron tunneling properties of outer-membrane decaheme cytochromes from shewanella oneidensis. Geochim Cosmochim Acta. 2007;71(3):543–555. [Google Scholar]
- 35.Polizzi NF, Skourtis SS, Beratan DN. Physical constraints on charge transport through bacterial nanowires. Faraday Discuss. 2012;155:43–62. doi: 10.1039/c1fd00098e. [DOI] [PMC free article] [PubMed] [Google Scholar]
- 36.Duan Y, et al. A point-charge force field for molecular mechanics simulations of proteins based on condensed-phase quantum mechanical calculations. J Comput Chem. 2003;24(16):1999–2012. doi: 10.1002/jcc.10349. [DOI] [PubMed] [Google Scholar]
- 37.Jorgensen WL, Chandrasekhar J, Madura JD, Impey RW, Klein ML. Comparison of simple potential functions for simulating liquid water. J Chem Phys. 1983;79(2):926–935. [Google Scholar]
- 38.Tipmanee V, Oberhofer H, Park M, Kim KS, Blumberger J. Prediction of reorganization free energies for biological electron transfer: A comparative study of Ru-modified cytochromes and a 4-helix bundle protein. J Am Chem Soc. 2010;132(47):17032–17040. doi: 10.1021/ja107876p. [DOI] [PubMed] [Google Scholar]
- 39.Tipmanee V, Blumberger J. Kinetics of the terminal electron transfer step in cytochrome c oxidase. J Phys Chem B. 2012;116(6):1876–1883. doi: 10.1021/jp209175j. [DOI] [PubMed] [Google Scholar]
- 40.Oberhofer H, Blumberger J. Revisiting electronic couplings and incoherent hopping models for electron transport in crystalline C60 at ambient temperatures. Phys Chem Chem Phys. 2012;14(40):13846–13852. doi: 10.1039/c2cp41348e. [DOI] [PubMed] [Google Scholar]
- 41.Laio A, VandeVondele J, Röthlisberger U. A hamiltonian electrostatic coupling scheme for hybrid Car-Parrinello molecular dynamics simulations. J Chem Phys. 2002;116(16):6941–6947. [Google Scholar]
- 42.Perdew JP, Burke K, Ernzerhof M. Generalized gradient approximation made simple. Phys Rev Lett. 1996;77(18):3865–3868. doi: 10.1103/PhysRevLett.77.3865. [DOI] [PubMed] [Google Scholar]
- 43.Hartwigsen C, Goedecker S, Hutter J. Relativistic separable dual-space Gaussian pseudopotentials from H to Rn. Phys Rev B. 1998;58(7):3641–3662. doi: 10.1103/physrevb.54.1703. [DOI] [PubMed] [Google Scholar]
- 44.Walker FA. Magnetic spectroscopic (epr, eseem, mossbauer, mcd and nmr) studies of low-spin ferriheme centers and their corresponding heme proteins. Coord Chem Rev. 1999;185–186(0):471–534. [Google Scholar]
- 45.Marcus RA, Sutin N. Electron transfers in chemistry and biology. Biochim Biophys Acta. 1985;811(3):265–322. [Google Scholar]
- 46.Strycharz-Glaven SM, Snider RM, Guiseppi-Elie A, Tender LM. On the electrical conductivity of microbial nanowires and biofilms. Energy Environ Sci. 2011;4(11):4366–4379. [Google Scholar]
- 47.Pirbadian S, El-Naggar MY. Multistep hopping and extracellular charge transfer in microbial redox chains. Phys Chem Chem Phys. 2012;14(40):13802–13808. doi: 10.1039/c2cp41185g. [DOI] [PubMed] [Google Scholar]
Associated Data
This section collects any data citations, data availability statements, or supplementary materials included in this article.