

Significance
We developed an optical imaging technique that combines reflected light-sheet illumination with superresolution microscopy, allowing us to image inside mammalian nuclei at subdiffraction-limit resolution and to count biomolecules with single-copy accuracy. Applying this technique to probe the spatial organization of RNA polymerase II-mediated transcription, we found that the majority of the transcription foci consist of only one RNAP II molecule, contrary to previous proposals. By quantifying the global extent of clustering across RNAP II molecules in the nucleus, we provide clear and convincing answers to the controversy surrounding the prevalent existence of “transcription factories.” Moreover, our work presents imaging and analysis tools for the quantitative characterization of nuclear structures, which could be generally applied to probe many other mammalian systems.
Keywords: mammalian gene transcription, nuclear organization, quantitative fluorescence microscopy, intracellular molecular counting
Abstract
Superresolution microscopy based on single-molecule centroid determination has been widely applied to cellular imaging in recent years. However, quantitative imaging of the mammalian nucleus has been challenging due to the lack of 3D optical sectioning methods for normal-sized cells, as well as the inability to accurately count the absolute copy numbers of biomolecules in highly dense structures. Here we report a reflected light-sheet superresolution microscopy method capable of imaging inside the mammalian nucleus with superior signal-to-background ratio as well as molecular counting with single-copy accuracy. Using reflected light-sheet superresolution microscopy, we probed the spatial organization of transcription by RNA polymerase II (RNAP II) molecules and quantified their global extent of clustering inside the mammalian nucleus. Spatiotemporal clustering analysis that leverages on the blinking photophysics of specific organic dyes showed that the majority (>70%) of the transcription foci originate from single RNAP II molecules, and no significant clustering between RNAP II molecules was detected within the length scale of the reported diameter of “transcription factories.” Colocalization measurements of RNAP II molecules equally labeled by two spectrally distinct dyes confirmed the primarily unclustered distribution, arguing against a prevalent existence of transcription factories in the mammalian nucleus as previously proposed. The methods developed in our study pave the way for quantitative mapping and stoichiometric characterization of key biomolecular species deep inside mammalian cells.
The spatial organization of eukaryotic transcription by RNA polymerase II (RNAP II) has long been proposed to be heterogeneous (1–6). Such spatial heterogeneity was first suggested based on the observation that nascent mRNA transcripts are not uniformly distributed in the nucleus, but rather occur in discrete foci termed “transcription factories” (7, 8) (Fig. 1A). However, estimates of the number of such factories, their sizes, as well as the stoichiometry of their constituents have been subject to a great deal of variability. A variety of immunofluorescence and electron microscopy studies, performed on a variety of human and mouse cell types, have found ∼500–8,000 of such factories in the nucleus, each proposed to be consisting of 4–30 RNAP II molecules with a mean diameter ranging from 40 to 130 nm (9–15). To ascertain if these foci indeed consist of multiple clustered RNAP II molecules, an imaging method with higher spatial resolution, molecular specificity, and the ability to accurately count the copy numbers of biomolecules in highly dense structures is needed.
Fig. 1.
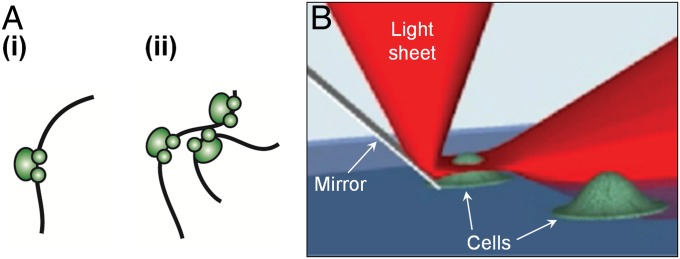
“Transcription factories” hypothesis and RLS-SRM imaging. (A) Models of spatial distribution of RNAP II in the mammalian nucleus, in which transcription is carried out by either (i) individual RNAP II molecules or (ii) multiple molecules clustered into spatially discrete “factories” that pull together genes to be transcribed. (B) The principle of RLS-SRM, which uses a miniature mirror placed next to the cell to reflect a light sheet by 90° to achieve 3D optical sectioning.
The recent advent of optical superresolution microscopy (SRM) has allowed imaging of subcellular structures with unprecedented resolution (16). Among the various approaches, stochastic optical reconstruction microscopy (STORM) and photoactivated localization microscopy (PALM) take advantage of the ability to detect single fluorescent probes attached to biomolecules while they transiently reside in their fluorescent “on” state and subsequently reconstruct a location map of their centroid positions (17–19). Although STORM/PALM is easier to implement with total internal reflection or highly inclined illumination schemes (20), the former has limited penetration depth whereas the latter has limited signal-to-background ratio due to auto-fluorescence background and out-of-focus fluorescent molecules, especially in highly dense structures (21).
To probe mammalian cell nuclei, however, optical sectioning with a few microns of penetration depth of the excitation light above the coverslip is needed. Similarly, the high-fluorescence background in a mammalian nucleus often hampers the localization of dye molecules with sufficient precision to reconstruct the superresolution image. Using sheet illumination microscopy, which allows selective illumination of a thin optical section and significant reduction in background, single-molecule imaging in the nucleus of giant salivary gland cells (a few hundred microns in size) (22) and superresolution imaging of histones in cellular spheroids (23) have been achieved. However, due to the steric hindrance that arises from placing high numerical aperture objectives in close proximity for narrow optical sectioning, these studies were limited to only very large cells or cell clusters. We recently circumvented this constraint by reflecting the light sheet off a miniature mirror placed next to the cell to be imaged (21). This reflected light-sheet (RLS) microscopy technique allows single-molecule imaging with superior signal-to-background ratio in the nucleus of a live, normal-sized mammalian cell at faster than video rate.
Furthermore, although some previous superresolution studies have been able to probe subnuclear structures in mammalian cells (24, 25), they have not provided absolute quantification in molecular copy numbers. Aside from less-than-complete labeling of molecular species, the difficulty stems primarily from the fact that the blinking photophysics of a dye results in multiple detection events for the same molecule over the course of image acquisition. Assignment of these blinking events to a specific molecule is often difficult, especially in dense structures where intermolecular distances are comparable to localization accuracy. Spatial pairwise correlation analysis can predict protein densities at length scales larger than the localization accuracy (26, 27), but the absolute copy number of probes within the length scale of localization accuracy (∼25 nm laterally and ∼50 nm axially) is difficult to ascertain.
Here, we develop an SRM technique combining reflected light-sheet illumination (21) and superresolution microscopy (RLS-SRM) to probe the spatial organization of RNAP II in mammalian cell nuclei. Leveraging on the blinking photophysics of rhodamine-based dyes, we also develop a density-based clustering algorithm that pools multiple localizations in superresolution images based on their spatial and temporal proximity in order to accurately count the copy number of RNAP II molecules in transcription foci. Contrary to previous belief, we found that the majority of the RNAP II molecules do not form clusters inside the nucleus, suggesting that the model for coordinated transcription of mammalian genes in prevalently existing transcription factories needs to be revisited (1–6, 28).
Results
Three-Dimensional Optical Sectioning by RLS-SRM Enables Resolution of Single RNAP II Molecules.
The RLS-SRM setup achieves 3D optical sectioning of the nucleus of a single adherent mammalian cell using a thin, horizontal light-sheet reflected off a gold-coated atomic force microscopy (AFM) cantilever placed next to the cell to be imaged (Fig. 1B and Fig. S1A). As a result, excitation and imaging of fluorescent probes are restricted to a 900- to 1,000-nm z-section of the nucleus (21), significantly increasing the signal-to-background ratio in the nucleus (Fig. S1B) and leading to improved resolution. To further enhance the impact of optical sectioning, cells are fixed immediately after attaching to the coverslip of the imaging dish and before their nuclei have flattened out (Materials and Methods), thereby allowing the thin light sheet to selectively image less than 10% of the nuclear volume and drastically reduce fluorescence background. Since RNAP II molecules are present at very high density inside the mammalian nucleus, such background suppression and consequent resolution improvement are critical for resolving their spatial organization with single copy accuracy.
Accurate Molecular Counting with Spatiotemporal Clustering Analysis.
To quantify the copy number of RNAP II within the transcription foci, we took advantage of the fact that the photoblinking events of many rhodamine-based dyes, such as tetramethylrhodamine (TMR), tend to be clustered temporally, i.e., characterized by large bursts of “on” events followed by long dark periods (corresponding to the “off” state) or photobleaching, in contrast to those of cyanine-based dyes such as Alexa 647, which tend to be more evenly distributed in time (Fig. 2A and Fig. S2A). Using the TMR dye, we developed a density-based clustering algorithm that pools multiple localizations based on their proximity not only in space but also in time, so as to accurately assign localizations to spatiotemporal clusters (st-clusters) (Fig. 2B and Materials and Methods). Each st-cluster arises from a “burst” event of a single dye, and the average number of such st-clusters per dye molecule is determined by the photophysics of the dye under our imaging conditions.
Fig. 2.

Molecular counting based on spatiotemporal clustering analysis. (A) Comparison of blinking kinetics between TMR (rhodamine-based, Bottom) and Alexa 647 (cyanine-based, Top) dyes. Representative time traces show that although both dyes remain “on” for similar periods of time, TMR tends to exhibit much longer “off” times, making its blinking trajectories appear clustered in time and allowing temporal clustering to be performed. (B) Flowchart of spatiotemporal clustering analysis based on spatial and temporal NND thresholding of TMR blinking events, which enables accurate counting of RNAP II molecules in transcription foci. (C) Calibration for temporal clustering of TMR localizations using hybridized DNA constructs mimicking transcription foci with one or multiple RNAP II molecules. A plot of the average number of st-clusters per spatial cluster (as determined from spatiotemporal clustering analysis) against the average number of dyes per construct molecule (as determined by counting photobleaching steps) allows us to establish an unambiguous correspondence between the average number of st-clusters observed and the average copy number of RNAP II molecules in the transcription foci. Error bar denotes SD (n = 3).
The temporal clustering of TMR localizations was calibrated using artificial clusters of dye molecules imaged under conditions identical to cellular imaging. We designed four short DNA constructs, each labeled with a TMR dye, as well as a long backbone construct complementary to the four constructs. The backbone was separately hybridized to either one or multiple (2–4) short constructs, mimicking transcription foci with one or multiple RNAP II molecules. The average number of dyes per construct molecule was determined by counting the number of photobleaching steps of hundreds of construct molecules (Fig. S2B); these values were compared with the average number of st-clusters per spatial cluster determined from spatiotemporal clustering analysis of the construct molecules. This calibration allowed us to establish an unambiguous correspondence between the average number of st-clusters observed in images of TMR-labeled RNAP II and the average copy number of RNAP II molecules in the transcription foci (Fig. 2C and Materials and Methods).
One-to-One Labeling and Superresolution Imaging of RNAP II Molecules.
Apart from insufficient resolution, another reason that previous microscopic studies were unable to accurately determine the copy number of RNAP II in transcription foci is the inability to perform quantitative labeling. Although immuno-tagging of the highly accessible C-terminal domain (CTD) or nascent mRNAs containing many degenerate sites for antibody binding ensures high efficiency of labeling, the high possibility of having multiple antibodies binding to each RNAP II molecule (which contains 52 heptad repeats in its CTD) or several dye molecules per secondary antibody makes accurate determination of RNAP II copy number difficult.
To circumvent these complications and ensure one-to-one labeling, we generated a U2OS cell line expressing an α–amanitin-resistant mutant of the major subunit of RNAP II, RPB1, fused to a SNAP tag (29, 30). When cells are maintained in the presence of α-amanitin, the endogenous RPB1 is degraded (30) and the cells thrive off the transcription by the exogenously produced mutant RPB1 molecules, all of which could be singly labeled with a cell-permeable substrate containing a TMR dye. Upon fixation and imaging (Materials and Methods), the distribution of TMR localizations in the nucleus displays a punctate pattern with discrete foci (Fig. 3A), consistent with previous findings using immunofluorescence labeling of RNAP II molecules (7, 8, 12, 15). As control, when wild-type U2OS cells not expressing SNAP-RPB1 were similarly labeled and imaged, the density of TMR molecules detected was <9% of that in SNAP-RPB1–expressing cells, suggesting minimal nonspecific labeling (Fig. S3).
Fig. 3.

Spatial organization of RNAP II molecules shows no significant clustering. (A) Distribution of SNAP-RPB1 molecules in a thin optical section of the nucleus of a fixed U2OS cell labeled with TMR. (Inset) Zoomed-in area where individual transcription foci are discernible; yellow crosses indicate the centroid position of the st-clusters identified. (Scale bar, 2 μm; Inset, 500 nm.) (B) Distribution of the number of st-clusters in transcription foci indicates that at least 70% of the foci consist of only one RNAP II molecule (n = 4,465). (C) Distribution of spatial NND for transcription foci shows that the majority of the RNAP II molecules do not associate with each other within the reported diameter of transcription factories (40–130 nm). Dotted line indicates the mean.
Applying the spatiotemporal clustering analysis to superresolution images of TMR-labeled RNAP II, we found that each of the observed foci contains on average 2.1 ± 0.4 st-clusters (n = 4,465) which, according to our calibration, corresponds to an average of 1.4 molecules of RNAP II per focus. Approximately 70% of the foci consist of only 1 st-cluster, which most likely originates from only one RNAP II molecule, whereas the fraction with 4 or more st-clusters is minimal (<10%, Fig. 3B). In contrast, RNA polymerase I molecules have been shown to form clusters in mammalian nucleoli (31–35). When the same analysis was applied to images of RNA polymerase I in wild-type U2OS cells that had been immunofluorescently labeled with TMR, a significant fraction of the foci (22%) with >20 st-clusters per focus was observed in the nucleolar regions (Fig. S4), suggesting that our analysis is capable of detecting molecular clusters when they exist. Moreover, the spatial nearest neighbor distance (NND) between the RNAP II foci was found to have a mean of 230 nm (Fig. 3C), exceeding the diameter range of transcription factories reported (40–130 nm) by a factor of 2–6 (10–13, 15). These results suggest that the majority of the RNAP II molecules exist in a solitary fashion inside the mammalian nucleus.
Ensuring Near-Complete Imaging of All RNAP II Molecules.
An obvious prerequisite for making any claim on the presence or absence of RNAP II clusters is that we can detect and image most, if not all, of the molecules illuminated by RLS-SRM. To exhaustively image all dye molecules in the optical section and thereby ensure accurate counting, we continuously acquired images until most of the dye molecules were bleached (usually after ∼50,000 frames for each optical section), as evidenced by the plateauing of the cumulative distribution of total localizations detected within the illumination volume (Fig. S5A). To estimate the labeling and detection efficiency of the SNAP-RPB1 molecules under our imaging conditions, we generated a cell line expressing a nuclear localized SNAP tag fused to a Halo tag. By labeling the two tags with two spectrally distinct dyes [SNAP tag with SiR (36) and Halo tag with TMR] and measuring the extent of colocalization between the signals, we found an overall labeling and detection efficiency of ∼72% (Fig. S6 and Materials and Methods). Moreover, the density of RNAP II molecules observed was found to be 37.2 ± 4.1 molecules per μm3 (n = 12,482 molecules in eight cells), which translates to a total of 80,200 ± 8,800 RNAP II molecules in the entire nucleus (Materials and Methods), in good agreement with values reported in previous studies (13, 15, 37). Therefore, we conclude that we indeed exhaustively imaged most of the labeled RNAP II molecules in the optical section illuminated.
Quantifying RNAP II Clustering with Two-Color Colocalization.
As an orthogonal approach to quantifying RNAP II clustering, we labeled the SNAP-RPB1 molecules simultaneously with SiR and TMR dyes; the labeling conditions were fine-tuned so that the population labeled with either dye was approximately equal (Materials and Methods). Thus, if there is clustering of two or more RNAP II molecules, at least half of them will be revealed as colocalized signals of the two dyes, whereas the rest (colocalization between two or more molecules labeled with the same color) will not. Two-color superresolution imaging and colocalization analysis detected 17.9 ± 1.0% (n = 8,929 in six cells) of the molecules that colocalize with each other (Fig. 4), thus yielding a maximum of 35.8 ± 2.0% of the clusters with more than one RNAP II molecule, in good agreement with our spatiotemporal clustering analysis results.
Fig. 4.

Quantification of RNAP II clustering by two-color colocalization. SNAP-RPB1 molecules are simultaneously labeled with either SiR (cyan) or TMR (green), so that approximately half of the molecules are labeled with each dye. Molecules that colocalize with each other are highlighted with white circles in the Inset. (Scale bar, 2 μm; Inset, 500 nm.)
Discussion
Despite the tremendous progress made in superresolution microscopy over the last decade, imaging inside the mammalian nucleus has, until recently, remained challenging (21). Moreover, most of these superresolution studies were limited in terms of quantitative characterization of molecular copy numbers due to difficulties stemming from nonstoichiometric labeling of biomolecules and inability to assign localization events to specific molecules. Although intracellular counting of fluorescent protein molecules based on similar principles used in this study have recently been achieved in bacteria (38) and yeast (39) systems, no such feat has yet been accomplished in the mammalian nucleus, primarily due to the difficulty of imaging single molecules inside the nucleus with sufficient signal-to-background ratio.
By integrating reflected light-sheet illumination with superresolution microscopy as well as implementing spatiotemporal clustering analysis on superresolution images, we demonstrated the capability of stoichiometric counting of nuclear biomolecular species with single-copy accuracy. RLS-SRM achieves single-molecule imaging in the nucleus by restricting the activation and imaging of the fluorescent probe molecules to a thin optical section of the nucleus, thereby suppressing fluorescence from out-of-focus molecules and enhancing the signal-to-background ratio significantly. This is particularly important in dense nuclear structures where fluorescent molecules in the entire sample volume contribute substantial background such that single-molecule localization can no longer be achieved with epi-illumination. Another advantage of using RLS, as opposed to epi- or highly inclined illumination in conventional SRM, lies in its ability to minimize photobleaching of probes from out-of-focus “on” events before they are imaged, thus preventing undercounting of molecules in cases where the entire axial range of the cell needs to be imaged.
With the capability provided by RLS-SRM, we resolved the spatial organization of RNAP II-mediated transcription down to the single-molecule level and quantified the global extent of clustering among RNAP II molecules in the mammalian nucleus. Although we found that at least 70% of transcription foci consist of only one RNAP II molecule, we should bear in mind that, given the molecular density observed, a fraction of the RNAP II molecules are expected to colocalize with each other by chance (Fig. S7). Therefore, the effective fraction of nonrandom transcription foci consisting of at least two RNAP II molecules is found to be only 12.9 ± 2.7%; that is, >85% of the RNAP II molecules exist in singular form, free of any nonrandom association with neighboring RNAP II molecules. The lack of significant clustering within the length scale of the reported diameter of transcription factories further corroborates our claim that the mammalian nuclear distribution of RNAP II is primarily unclustered.
The transcription factories model posits that active genes that are located spatially apart from each other might be pulled together into preassembled “factories,” each consisting of 4–30 molecules of RNAP II, and slide through the factories as they are transcribed (1–6). Such a model challenges the conventional view that considers genomic DNA as the central scaffold around which the transcriptional machinery is assembled. The observation that the majority of RNAP II molecules exist in a solitary fashion without significant clustering among them suggests that the model of prevalently existing transcription factories that transcribe mammalian genes in a concerted fashion needs to be reconsidered. The fact that these factories were observed in previous studies could possibly be due to the lack of molecular specificity in electron microscopy and spectroscopy studies (10–13, 15), or limited resolution in fluorescence microscopy studies (7–9, 14–15) since insufficient resolution could potentially create artificial transcription factories out of images of spatially separate RNAP II molecules (Fig. S8). In addition, it should be noted that, in most of these studies, the average number of RNAP II molecules in each factory was inferred (from the ratio between the total number of RNAP II molecules in the nucleus and the number of factories detected) rather than directly visualized (7, 12–13, 15).
Nevertheless, a small but nonnegligible fraction of the foci that we observed consisted of two or more RNAP II molecules. This observation could be due to several reasons. For example, more than one RNAP II molecule might be transcribing on the same gene or on two neighboring genes that are too close to be resolved by our method. Also, a considerable fraction of human genes are organized bidirectionally, with two promoters within a short distance from each other (40); in such cases, paused RNAP II molecules will be localized within our resolution limit. Despite these plausible scenarios, we cannot exclude the possibility that a small fraction of RNAP II molecules do form functional clusters. In fact, our observations are in line with the recent report in living cells of transient RNAP II assembly to short-lived clusters (41). The evanescent nature of this assembly might result in a small subset of molecules colocalizing with each other at a given moment, whereas on a global scale the majority of the RNAP II molecules remain unclustered. The general applicability of the methods introduced in this study should open doors to the quantitative characterization of important biomolecular species in other mammalian nuclear structures.
Materials and Methods
RLS-SRM Setup.
The RLS-SRM microscope was custom-built using the body frame of a Nikon TE300 inverted microscope. The microscope sample stage was replaced with a custom-made invar piece to increase the overall stability of the setup and reduce mechanical vibrations. The condenser was replaced with a Olympus water immersion objective (LUMPLFLN 40×, N.A. 0.8,) mounted vertically on a home-engineered reflected sheet illuminator (RSI) that acts as a micropositioning translational stage. Laser beams (647-nm line from Innova-300 or 532-nm line from Verdi-5W, both from Coherent) were expanded, collimated, combined, and delivered through an optical fiber onto a lens assembly that generates an elliptical beam. This beam was positioned at the back aperture of the vertical objective with one axis overfilling the back aperture and the orthogonal axis being focused. The resulting light sheet created by the objective was reflected by 90° by a gold-coated tipless-AFM cantilever (Applied NanoStructures) mounted on the RSI, projecting it horizontally onto the nucleus of an adjacent cell. Separate laser beams were also sent through the microscope back-port to allow alternative epi-illumination. The sample dish was placed on a 3D piezo-driven stage (Physik Instrumente) coupled to a manual XY stage, allowing positional control in all three axes with nanometer precision. Vertical drift of the sample stage was corrected for by controlling the z-position of the imaging objective with a piezo-driven mount subjected to a feedback signal coming from the reflection of an infrared laser diode off the coverslip of the sample dish (Autofocus Trac, MotionX). The fluorescence emission was collected by an oil objective (UPlanSApo 100×, N.A. 1.4, Olympus) placed coplanar to the light sheet and imaged onto an electron-multiplying charge-coupled device (EM-CCD) camera (iXon DU-897, Andor). Astigmatism introduced into the imaging path using a cylindrical lens was used to recover superresolved z-positions (42). The entire setup was encased in a home-built aluminum chamber, and room temperature was controlled to within ±0.1 °C to shield the setup from environmental influences.
DNA Constructs and Stable Cell-Line Generation and Culture.
The SNAP-RPB1 plasmid was generated from the YFP-aPolII plasmid (gift of X. Darzacq, Ecole Normale Supérieure, Paris) by replacing the coding sequence for YFP with the coding sequence for SNAPf from pSNAPf (New England Biolabs). Human osteosarcoma (U-2 OS) cells (ATCC HTB-96) stably expressing SNAP-RPB1 were generated by transfection with Polyplus reagent and selected with 25 μg/mL α-amanitin (Sigma-Aldrich) for 2–3 wk. The selected cells were subsequently cultured in high-glucose DMEM (Gibco) supplemented with 10% (vol/vol) FBS, 1% penicillin/streptomycin, and 2 mM GlutaMAX (Gibco) in the presence of 25 μg/mL α-amanitin. The SNAP-Halo construct was generated by removing the coding sequence for Oct4-GFP from the LVTetO-Oct4 plasmid (gift of K. Hochedlinger, Massachusetts General Hospital, Boston) and ligating it to the coding sequences of a SNAP tag, a nuclear localization signal, and a Halo tag in frame. A U2OS cell line stably expressing the SNAP-Halo fusion protein was generated by lentiviral transduction as previously described (21).
SNAP and Halo Labeling.
SNAP-RPB1 cells were passaged onto an imaging dish and allowed to settle for 3–4 h such that they just began to attach. The culture medium was then changed to one with 1 μM of SNAP-TMR substrate (SNAP-cell TMR-Star, New England Biolabs). After incubation for 30 min at 37 °C, the cells were washed twice and incubated with fresh medium for 30 min to remove the free substrate. To enhance the impact of optical sectioning, cells were immediately fixed with 3.2% paraformaldehyde in PBS before their nuclei had flattened out, thereby allowing the thin light sheet to selectively image less than 10% of the nuclear volume and drastically reduce fluorescence background. For two-color SNAP-RNAP II labeling, 1 μM of SNAP-SiR substrate (gift of K. Johnsson, Ecole Polytechnique Fédérale de Lausanne, Lausanne, Switzerland) and 0.5 μM of SNAP-TMR substrate were simultaneously added to the medium to achieve approximate 50:50 labeling of the SNAP molecules with either one of the two dyes. For SNAP-Halo labeling, 1 μM of SNAP-SiR substrate and 5 μM of Halo-TMR substrate (HaloTag TMR ligand, Promega) were simultaneously added to the medium.
Calibration Using Hybridized DNA Constructs.
To calibrate for the temporal clustering of TMR localizations, we designed four 20-nt DNA oligonucleotides as well as an 83-nt, biotinylated backbone DNA complementary to the four oligonucleotides (with a spacer of 1 nt between each). The backbone was separately hybridized to either one or multiple (2–4) short DNA oligonucleotides, each of which was labeled with a single TMR dye via NHS ester linkage. The hybridized DNA constructs were surface-immobilized to cleaned coverslips at low molecular densities that allow unambiguous identification of single construct molecules during imaging, and the average number of dyes per construct was determined by counting the number of photobleaching steps for each construct molecule over the period of imaging. By comparing this value with the average number of st-clusters per construct as determined from our spatiotemporal clustering analysis of superresolution images acquired under identical conditions such as cellular imaging, we established a conversion equation to deduce the average number of dye molecules, and therefore the average copy number of RNAP II molecules, in the transcription foci.
Image Acquisition.
Cells to be imaged were first identified and positioned under low laser intensities. The solution was then changed to an imaging buffer in 50 mM Tris (pH 8.0) with 10% glucose (mass/vol), 10 mM NaCl, 0.143 M β-mercaptoethanol, 56 mg/mL glucose oxidase, and 4 mg/mL catalase. Epi-illumination intensity was then increased to ∼5–10 kW⋅cm−2 to rapidly switch most of the dyes off before RLS-SRM imaging at a frame rate of 20 Hz and a power density of ∼5–10 kW⋅cm−2 along the cross-section of the light sheet. RLS illumination was transiently alternated with epi-illumination to suppress the out-of-focus molecules to dark states. Images were continuously acquired until most of the dye molecules in the optical section were bleached (usually after ∼50,000 frames), as evidenced by the plateauing of the cumulative distribution of total localizations detected within the illumination volume (Fig. S5A).
Image Analysis.
Image analysis was performed using custom-written software in Matlab. The image of each single molecule was fitted to a 2D elliptical Gaussian profile, the centroid position and ellipticity of which provided lateral and axial positions of each activated fluorescent molecule. Lateral drift between frames were corrected by tracking one or multiple fluorescent beads (TetraSpeck, Life Technologies) placed in the sample before imaging. Selection of localizations based on intensity and ellipticity allowed us to restrict the final set of localizations used to build the superresolution map to a thin section of the nucleus ∼300 nm in thickness (FWHM, Fig. S5B), in which our confidence of near-complete imaging of all molecules present is highest. Local density-based spatiotemporal clustering was then performed on these single localizations to assign them to individual molecules. The raw localizations were first thresholded based on their NND in space and grouped into spatial clusters (consisting of at least two localizations not more than three times the resolution apart from each other). The localizations in each spatial cluster were then thresholded again based on their NND in time and further grouped into st-clusters [consisting of localizations that are less than 1.5 s (upper limit of “on”-time for TMR) away from each other]. The final superresolution images were reconstructed by binning the localizations (bin size equal to the localization accuracy determined separately from single-dye molecules) and running a 2D Gaussian filter with a SD of unit bin size.
The cross-sectional area of the nucleus imaged was determined using a custom-written algorithm and multiplied by the thickness of the optical section to obtain the illuminated volume. The density of RNAP II molecules was calculated by dividing the total number of molecules detected by the illuminated volume in which they are contained. The volume of the nucleus was calculated assuming that a standard, unflattened U2OS cell nucleus can be modeled by a sphere with a diameter of 15 µm (average of measurements from eight cells), from which the fraction occupied by the nucleolar region [∼1/27 (12)] was excluded. The total number of RNAP II molecules in the nucleus was then estimated by multiplying the molecular density with the extranucleolar volume of the nucleus, adjusting for the small fraction of nonspecific binding (Fig. S3) and dividing by the estimated labeling and detection efficiency. Colocalization between two molecules was defined as their centroid positions being not more than 100 nm from each other.
Supplementary Material
Acknowledgments
We thank W. Min and G. W. Li for contribution to early stages of the project; L. Song for reagents procurement; X. Darzacq, K. Hochedlinger, and K. Johnsson for gifts of α-amanitin–resistant RPB1 plasmid, LVTetO-Oct4 plasmid, and SNAP-SiR substrate, respectively; and H. Babcock for technical advice. This work was supported by funding from a National Science Scholarship from the Agency for Science, Technology and Research of Singapore (to Z.W.Z.), a Jane Coffin Childs Postdoctoral Fellowship (to R.R.), the Human Frontier Science Program Organization (J.C.M.G.), the Swiss National Science Foundation (D.M.S.), Molecular Biophysics Training Grant Agency, National Institutes of Health (NIH)/National Institute of General Medical Sciences Grant T32 GM008313 (to A.R.C.), and NIH Grants GM 096450 and EB010244 (to X.S.X.).
Footnotes
The authors declare no conflict of interest.
This article is a PNAS Direct Submission.
This article contains supporting information online at www.pnas.org/lookup/suppl/doi:10.1073/pnas.1318496111/-/DCSupplemental.
References
- 1.Chakalova L, Fraser P. Organization of transcription. Cold Spring Harb Perspect Biol. 2010;2(9):a000729. doi: 10.1101/cshperspect.a000729. [DOI] [PMC free article] [PubMed] [Google Scholar]
- 2.Edelman LB, Fraser P. Transcription factories: Genetic programming in three dimensions. Curr Opin Genet Dev. 2012;22(2):110–114. doi: 10.1016/j.gde.2012.01.010. [DOI] [PubMed] [Google Scholar]
- 3.Papantonis A, Cook PR. Genome architecture and the role of transcription. Curr Opin Cell Biol. 2010;22(3):271–276. doi: 10.1016/j.ceb.2010.03.004. [DOI] [PMC free article] [PubMed] [Google Scholar]
- 4.Papantonis A, Cook PR. Transcription factories: Genome organization and gene regulation. Chem Rev. 2013;113(11):8683–8705. doi: 10.1021/cr300513p. [DOI] [PubMed] [Google Scholar]
- 5.Rieder D, Trajanoski Z, McNally J. Transcription factories. Front Genet. 2012;3:221. doi: 10.3389/fgene.2012.00221. [DOI] [PMC free article] [PubMed] [Google Scholar]
- 6.Sutherland H, Bickmore WA. Transcription factories: Gene expression in unions? Nat Rev Genet. 2009;10(7):457–466. doi: 10.1038/nrg2592. [DOI] [PubMed] [Google Scholar]
- 7.Jackson DA, Hassan AB, Errington RJ, Cook PR. Visualization of focal sites of transcription within human nuclei. EMBO J. 1993;12(3):1059–1065. doi: 10.1002/j.1460-2075.1993.tb05747.x. [DOI] [PMC free article] [PubMed] [Google Scholar]
- 8.Wansink DG, et al. Fluorescent labeling of nascent RNA reveals transcription by RNA polymerase II in domains scattered throughout the nucleus. J Cell Biol. 1993;122(2):283–293. doi: 10.1083/jcb.122.2.283. [DOI] [PMC free article] [PubMed] [Google Scholar]
- 9.Brown JM, et al. Association between active genes occurs at nuclear speckles and is modulated by chromatin environment. J Cell Biol. 2008;182(6):1083–1097. doi: 10.1083/jcb.200803174. [DOI] [PMC free article] [PubMed] [Google Scholar]
- 10.Eskiw CH, Fraser P. Ultrastructural study of transcription factories in mouse erythroblasts. J Cell Sci. 2011;124(21):3676–3683. doi: 10.1242/jcs.087981. [DOI] [PMC free article] [PubMed] [Google Scholar]
- 11.Eskiw CH, Rapp A, Carter DR, Cook PR. RNA polymerase II activity is located on the surface of protein-rich transcription factories. J Cell Sci. 2008;121(12):1999–2007. doi: 10.1242/jcs.027250. [DOI] [PubMed] [Google Scholar]
- 12.Iborra FJ, Pombo A, Jackson DA, Cook PR. Active RNA polymerases are localized within discrete transcription “factories’ in human nuclei. J Cell Sci. 1996;109(6):1427–1436. doi: 10.1242/jcs.109.6.1427. [DOI] [PubMed] [Google Scholar]
- 13.Jackson DA, Iborra FJ, Manders EMM, Cook PR. Numbers and organization of RNA polymerases, nascent transcripts, and transcription units in HeLa nuclei. Mol Biol Cell. 1998;9(6):1523–1536. doi: 10.1091/mbc.9.6.1523. [DOI] [PMC free article] [PubMed] [Google Scholar]
- 14.Osborne CS, et al. Active genes dynamically colocalize to shared sites of ongoing transcription. Nat Genet. 2004;36(10):1065–1071. doi: 10.1038/ng1423. [DOI] [PubMed] [Google Scholar]
- 15.Pombo A, et al. Regional specialization in human nuclei: Visualization of discrete sites of transcription by RNA polymerase III. EMBO J. 1999;18(8):2241–2253. doi: 10.1093/emboj/18.8.2241. [DOI] [PMC free article] [PubMed] [Google Scholar]
- 16.Hell SW. Far-field optical nanoscopy. Science. 2007;316(5828):1153–1158. doi: 10.1126/science.1137395. [DOI] [PubMed] [Google Scholar]
- 17.Betzig E, et al. Imaging intracellular fluorescent proteins at nanometer resolution. Science. 2006;313(5793):1642–1645. doi: 10.1126/science.1127344. [DOI] [PubMed] [Google Scholar]
- 18.Hess ST, Girirajan TP, Mason MD. Ultra-high resolution imaging by fluorescence photoactivation localization microscopy. Biophys J. 2006;91(11):4258–4272. doi: 10.1529/biophysj.106.091116. [DOI] [PMC free article] [PubMed] [Google Scholar]
- 19.Rust MJ, Bates M, Zhuang X. Sub-diffraction-limit imaging by stochastic optical reconstruction microscopy (STORM) Nat Methods. 2006;3(10):793–795. doi: 10.1038/nmeth929. [DOI] [PMC free article] [PubMed] [Google Scholar]
- 20.Jones SA, Shim S-H, He J, Zhuang X. Fast, three-dimensional super-resolution imaging of live cells. Nat Methods. 2011;8(6):499–508. doi: 10.1038/nmeth.1605. [DOI] [PMC free article] [PubMed] [Google Scholar]
- 21.Gebhardt JCM, et al. Single-molecule imaging of transcription factor binding to DNA in live mammalian cells. Nat Methods. 2013;10(5):421–426. doi: 10.1038/nmeth.2411. [DOI] [PMC free article] [PubMed] [Google Scholar]
- 22.Ritter JG, Veith R, Veenendaal A, Siebrasse JP, Kubitscheck U. Light sheet microscopy for single molecule tracking in living tissue. PLoS ONE. 2010;5(7):e11639. doi: 10.1371/journal.pone.0011639. [DOI] [PMC free article] [PubMed] [Google Scholar]
- 23.Cella Zanacchi F, et al. Live-cell 3D super-resolution imaging in thick biological samples. Nat Methods. 2011;8(12):1047–1049. doi: 10.1038/nmeth.1744. [DOI] [PubMed] [Google Scholar]
- 24.Baddeley D, et al. Measurement of replication structures at the nanometer scale using super-resolution light microscopy. Nucleic Acids Res. 2010;38(2):e8. doi: 10.1093/nar/gkp901. [DOI] [PMC free article] [PubMed] [Google Scholar]
- 25.Bohn M, et al. Localization microscopy reveals expression-dependent parameters of chromatin nanostructure. Biophys J. 2010;99(5):1358–1367. doi: 10.1016/j.bpj.2010.05.043. [DOI] [PMC free article] [PubMed] [Google Scholar]
- 26.Sengupta P, et al. Probing protein heterogeneity in the plasma membrane using PALM and pair correlation analysis. Nat Methods. 2011;8(11):969–975. doi: 10.1038/nmeth.1704. [DOI] [PMC free article] [PubMed] [Google Scholar]
- 27.Veatch SL, et al. Correlation functions quantify super-resolution images and estimate apparent clustering due to over-counting. PLoS ONE. 2012;7(2):e31457. doi: 10.1371/journal.pone.0031457. [DOI] [PMC free article] [PubMed] [Google Scholar]
- 28.Cook PR. Predicting three-dimensional genome structure from transcriptional activity. Nat Genet. 2002;32(3):347–352. doi: 10.1038/ng1102-347. [DOI] [PubMed] [Google Scholar]
- 29.Darzacq X, et al. In vivo dynamics of RNA polymerase II transcription. Nat Struct Mol Biol. 2007;14(9):796–806. doi: 10.1038/nsmb1280. [DOI] [PMC free article] [PubMed] [Google Scholar]
- 30.Nguyen VT, et al. In vivo degradation of RNA polymerase II largest subunit triggered by alpha-amanitin. Nucleic Acids Res. 1996;24(15):2924–2929. doi: 10.1093/nar/24.15.2924. [DOI] [PMC free article] [PubMed] [Google Scholar]
- 31.Boisvert F-M, van Koningsbruggen S, Navascués J, Lamond AI. The multifunctional nucleolus. Nat Rev Mol Cell Biol. 2007;8(7):574–585. doi: 10.1038/nrm2184. [DOI] [PubMed] [Google Scholar]
- 32.Garcia-Blanco MA, Miller DD, Sheetz MP. Nuclear spreads: I. Visualization of bipartite ribosomal RNA domains. J Cell Biol. 1995;128(1):15–27. doi: 10.1083/jcb.128.1.15. [DOI] [PMC free article] [PubMed] [Google Scholar]
- 33.Gilbert N, et al. Three-dimensional co-location of RNA polymerase I and DNA during interphase and mitosis by confocal microscopy. J Cell Sci. 1995;108(1):115–125. doi: 10.1242/jcs.108.1.115. [DOI] [PubMed] [Google Scholar]
- 34.Scheer U, Rose KM. Localization of RNA polymerase I in interphase cells and mitotic chromosomes by light and electron microscopic immunocytochemistry. Proc Natl Acad Sci USA. 1984;81(5):1431–1435. doi: 10.1073/pnas.81.5.1431. [DOI] [PMC free article] [PubMed] [Google Scholar]
- 35.Shaw PJ, Jordan EG. The nucleolus. Annu Rev Cell Dev Biol. 1995;11(1):93–121. doi: 10.1146/annurev.cb.11.110195.000521. [DOI] [PubMed] [Google Scholar]
- 36.Lukinavičius G, et al. A near-infrared fluorophore for live-cell super-resolution microscopy of cellular proteins. Nat Chem. 2013;5(2):132–139. doi: 10.1038/nchem.1546. [DOI] [PubMed] [Google Scholar]
- 37.Jackson DA, Pombo A, Iborra F. The balance sheet for transcription: An analysis of nuclear RNA metabolism in mammalian cells. FASEB J. 2000;14(2):242–254. [PubMed] [Google Scholar]
- 38.Lee S-H, Shin JY, Lee A, Bustamante C. Counting single photoactivatable fluorescent molecules by photoactivated localization microscopy (PALM) Proc Natl Acad Sci USA. 2012;109(43):17436–17441. doi: 10.1073/pnas.1215175109. [DOI] [PMC free article] [PubMed] [Google Scholar]
- 39.Puchner EM, Walter JM, Kasper R, Huang B, Lim WA. Counting molecules in single organelles with superresolution microscopy allows tracking of the endosome maturation trajectory. Proc Natl Acad Sci USA. 2013;110(40):16015–16020. doi: 10.1073/pnas.1309676110. [DOI] [PMC free article] [PubMed] [Google Scholar]
- 40.Adachi N, Lieber MR. Bidirectional gene organization: A common architectural feature of the human genome. Cell. 2002;109(7):807–809. doi: 10.1016/s0092-8674(02)00758-4. [DOI] [PubMed] [Google Scholar]
- 41.Cisse II, et al. Real-time dynamics of RNA polymerase II clustering in live human cells. Science. 2013;341(6146):664–667. doi: 10.1126/science.1239053. [DOI] [PubMed] [Google Scholar]
- 42.Huang B, Wang W, Bates M, Zhuang X. Three-dimensional super-resolution imaging by stochastic optical reconstruction microscopy. Science. 2008;319(5864):810–813. doi: 10.1126/science.1153529. [DOI] [PMC free article] [PubMed] [Google Scholar]
Associated Data
This section collects any data citations, data availability statements, or supplementary materials included in this article.