

Abstract
PURPOSE
We investigated 3 approaches for implementing the Chronic Care Model to improve diabetes care: (1) practice facilitation over 6 months using a reflective adaptive process (RAP) approach; (2) practice facilitation for up to 18 months using a continuous quality improvement (CQI) approach; and (3) providing self-directed (SD) practices with model information and resources, without facilitation.
METHODS
We conducted a cluster-randomized trial, called Enhancing Practice, Improving Care (EPIC), that compared these approaches among 40 small to midsized primary care practices. At baseline and 9 months and 18 months after enrollment, we assessed practice diabetes quality measures from chart audits and Practice Culture Assessment scores from clinician and staff surveys.
RESULTS
Although measures of the quality of diabetes care improved in all 3 groups (all P <.05), improvement was greater in CQI practices compared with both SD practices (P <.0001) and RAP practices (P <.0001); additionally, improvement was greater in SD practices compared with RAP practices (P <.05). In RAP practices, Change Culture scores showed a trend toward improvement at 9 months (P = .07) but decreased below baseline at 18 months (P <.05), while Work Culture scores decreased from 9 to 18 months (P <.05). Both scores were stable over time in SD and CQI practices.
CONCLUSIONS
Traditional CQI interventions are effective at improving measures of the quality of diabetes care, but may not improve practice change and work culture. Short-term practice facilitation based on RAP principles produced less improvement in quality measures than CQI or SD interventions and also did not produce sustained improvements in practice culture.
Keywords: primary health care, family medicine, patient-centered medical home, quality improvement, practice facilitation, diabetes mellitus, practice-based research
INTRODUCTION
To meet the challenges of a reformed health care system, primary care must adopt substantially new models such as the Patient-Centered Medical Home (PCMH) and integrate their work within accountable care organizations.1–4 The PCMH has emerged as a cornerstone of primary care redesign with its strong appeal of uniting 4 compelling areas of health care reform: (1) the well-demonstrated value of primary care based on 4 core attributes,5–6 (2) proactive, population-based approaches to chronic care, (3) consumerism and patient-centered care, and (4) new health information technology. Much of the redesign effort has focused on implementing the Chronic Care Model,6,7 which has been associated with better health outcomes for patients with chronic conditions and, specifically, type 2 diabetes8,9; however, data regarding adoption of this model’s principles into primary care practices have been disappointing.10,11 Primary care practices have few mechanisms for incorporating new programs, which can slow adoption of innovations and cause disruptions when innovations are finally implemented.12–16 With the central importance of primary care in health care redesign models such as the PCMH and accountable care organizations, effective strategies for enhancing primary care practice improvement and transformation are critically important.
Practice facilitation has emerged as a key method for assisting practices in implementing organizational changes.17–21 Facilitators can assist practices in implementing evidence-based programs, tailoring programs to individual practice situations, improving incorporation into operations, and increasing sustainability. Emerging evidence indicates that practice facilitation can be successful in improving preventive care18–20 and implementing aspects of the PCMH.21–23
Different approaches to practice facilitation have been described, but studies to determine optimal characteristics of facilitation are lacking. A recent meta-analysis found a relationship between the intensity of facilitation and effect size, but no relationship between the duration of facilitation and effect size.20 Aspects of facilitation are generally shared across approaches, including the formation of improvement teams consisting of diverse practice members who meet regularly to plan and implement changes24; however, the strategies and theoretical framework of the change process have been quite different across various facilitation programs. The model used most widely has been based on continuous quality improvement (CQI), using a series of incremental plan-do-study-act cycles focused on quality measures to implement practice improvements.25–27
Others have adopted more systemic approaches to change based on complexity science, including the reflective adaptive process (RAP).28–30 Organizational culture has been shown to be associated with successful innovation and quality of care in medical practices.31–33 RAP focuses on enhancing practice capacity to make change by improving a practice’s change culture, communication, problem solving, and organizational learning to lay the groundwork for an ongoing process of change and improvement.
We undertook a cluster-randomized controlled trial, Enhancing Practice, Improving Care (EPIC), to compare the effectiveness of 3 approaches for implementing and sustaining Chronic Care Model–based systems to improve diabetes care: (1) practice facilitation using a RAP approach to stimulate reflective conversations and improve the practice’s capacity to manage change, applying the change process to diabetes care; (2) practice facilitation using a CQI approach to implement quality improvement for diabetes to improve diabetes care; and (3) providing self-directed (SD) practices with information and resources about the Chronic Care Model and quality improvement to improve diabetes care, but without facilitation. Our hypotheses were that (1) the RAP approach would improve practice change culture to a greater and more sustained degree than the CQI or self-directed approaches; (2) the CQI approach would lead more quickly to improvement in diabetes performance measures than the RAP or SD approaches; and (3) the RAP approach would produce more sustained improvements in performance measures through positive impact on practice change and work cultures.
METHODS
Study Design and Recruitment
The setting for the study was small to midsized community health centers and independent mixed-payer primary care practices in Colorado. Practices were recruited through multiple contact methods targeting interested primary care clinicians, especially those in the State Networks of Colorado Ambulatory Practices and Partners (SNOCAP), a collaborative of several practice-based research networks. A total of 44 practices were recruited, and 40 were enrolled in the study in 3 waves. Practices were stratified by location (urban vs rural), practice size, and practice type (community health center vs other) and randomized so that the distribution of practice characteristics would be similar across groups. None of the practices were participating in any financial incentive programs or other diabetes improvement initiatives during the study period.
The methods used to collect outcomes data included patient chart audits and patient, clinician, and staff surveys at baseline and at 9 and 18 months after practice enrollment. The study was approved by the University of Colorado Institutional Review Board and registered with ClinicalTrials.gov (Protocol Registration Receipt NCT00414986). We report data from chart audits and clinician and staff surveys here; additional data from surveys will be reported elsewhere.
Practice Interventions
Practices in the RAP group received practice facilitation using the RAP change model based on complexity theory.28–30 The RAP approach focused on changing organizational functioning to improve diabetes care. This approach assumed that improving organizational capacity to make and sustain change is primary in achieving practice improvements and implementation of changes. Practice facilitators received specific training in the use of change management strategies and participated in regular debriefing sessions with an experienced facilitation supervisory team to ensure fidelity to the intervention process. Practice facilitators in this group performed a multimethod practice assessment, including assessment of practice communication, change and work culture, and level of implementation of the Chronic Care Model, and provided feedback to the practice. They then assisted the practices in developing improvement teams to implement the Chronic Care Model for diabetes, but without a specified change package. This approach allowed each practice to set its own priorities, pace, and targets of change. Theoretically, this form of facilitation should be necessary for only a relatively short period of time, with the practice improvement team progressively assuming responsibility for the ongoing improvement efforts after the initial facilitation. The facilitation intervention for this group lasted 6 months, with facilitators meeting with the improvement teams an average of 7.4 times (range, 4–11 times), although facilitators were available for consultation for up to 12 months after baseline. Additional details of the RAP intervention implemented in this study are published elsewhere.24
Practices in the CQI group received practice facilitation based on the Model for Improvement.25–27 Practice facilitators also performed an initial multimethod practice assessment, provided feedback to the practices, and helped form and initially facilitated practice improvement teams; however, the CQI facilitators provided a structure and process for quality improvement using CQI tools that particularly focused on sequential plan-do-study-act cycles guided by quality measurement data. A separate supervisory team met weekly with the facilitators to discuss practice progress and ensure fidelity to the intervention model. Implementation of a system for obtaining reliable quality measures was a time-consuming first step, and the length of the intervention was allowed to vary to accommodate this process. Facilitators worked with practices for up to 18 months (mean = 15 months) depending on practice needs. The facilitators met with improvement teams an average of 9.7 times (range, 4–18 times).
Practices in the SD group did not receive practice facilitation, but received limited feedback on their baseline practice culture and level of implementation of the Chronic Care Model based on practice surveys. SD practices were then given access to a website with information about quality improvement and the Chronic Care Model for diabetes, with follow-up surveys and chart audits at the same intervals as in the other groups.
Measures
Patient Outcomes
The process of diabetes care, the primary outcome, consisted of documentation, as ascertained by chart audits, that a patient had received 9 items from the American Diabetes Association Physician Recognition Program: hemoglobin A1c (HbA1c) level measurement, foot examination, blood pressure measurement, dilated eye examination, cholesterol level measurement, nephropathy screen (check for urinary protein), influenza vaccination, nutrition counseling, and provision of self-management support.34 Each practice generated a list of patients with diabetes who had at least 1 visit to the practice in the 18 months before practice enrollment and at least 1 visit in the 18 months after enrollment. We audited a random sample of charts, with a target of at least 20 to 25 patients per practice. Institutional review board–approved procedures for deidentifying the data were followed. Each item was considered up to date if it occurred within the 12 months before the end of each audit period (baseline, 9 months, 18 months). We derived a composite score for diabetes process of care consisting of the total number of up-to-date measures for each audit period according to guidelines. The possible range was 0 to 9, with higher scores indicating better and more guideline-concordant care. Additionally, patient blood pressure, HbA1c level, and low-density lipoprotein (LDL) cholesterol levels were abstracted.
Clinician and Staff Surveys
At baseline, 9 months, and 18 months, clinicians and staff members completed the Practice Culture Assessment, which was developed to measure perceptions of practice characteristics thought to be important to practice functioning and successful implementation of practice quality improvement. Item selection was based on a literature review, prior experience, and exploratory factor analysis combined with expert consensus and item analysis.12,35 Items selected for the Practice Culture Assessment were also separately used, along with related items, in the evaluation of the National Demonstration Project.36 Each practice also provided basic practice information, including patient demographics, patient volume, and implementation of health information technology.
Patient-Level Covariates
Patient characteristics collected in the chart audit included age, sex, and presence of chronic medical and psychiatric conditions. Race and ethnicity were generally not recorded in the medical record.
Statistical Analysis
We generated descriptive statistics (means, standard deviations, proportions, frequency distributions) for patient sociodemographics, diabetes process of care measures, and practice characteristics. General (or generalized for binary outcomes) linear mixed effects models, adjusting for patient-level covariates and clustering of patients within practices, were used to examine differences in outcomes over time by study group.
In addition to assessing overall differences in trajectories across study group, we assessed all 2-way comparisons and whether change occurred within each group. Covariates in patient outcome models included age, sex, and number of medical and psychiatric comorbidities. We used principal factor analysis with oblique rotation on Practice Culture Assessment items and retained 3 factors as determined by the proportion criterion. We computed the Cronbach α for each subscale to confirm internal consistency. Subscale scores were computed and used as outcome variables in the analysis of differential change over time by study group, with respondent position included as a covariate. For clinical outcomes, time was coded as days since baseline using date of service, with all measurements before baseline defined as preintervention (time = 0). As all statistical tests were specified a priori, we followed recommendations to report P values rather than adjust for multiple comparisons.37,38 Analyses were performed using SAS version 9.3 (SAS Institute Inc).39
RESULTS
The CONSORT (Consolidated Standards of Reporting Trials) diagram of practice, patient, clinician, and staff flow is shown in Figure 1. Before baseline data collection, 2 practices dropped out: 1 was disqualified for sharing personnel with another enrolled practice, and 1 was closed because of death of a physician. Between baseline and 9 months, 4 practices discontinued work with the facilitators. From practice-generated lists of patients with diabetes, we audited a random sample of 822 charts for diabetes process of care and outcomes. Clinician and staff response rates for the Practice Culture Assessment survey were 64% at baseline, 47% at 9 months, and 52% at 18 months.
Figure 1.
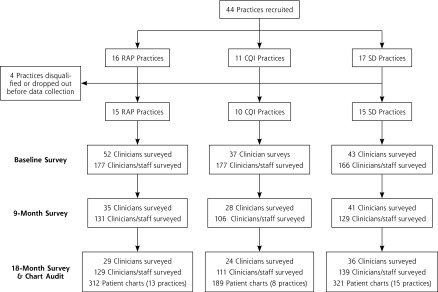
CONSORT diagram.
CONSORT = Consolidated Standards of Reporting Trials; CQI = continuous quality improvement; RAP = reflective adaptive process; SD = self-directed.
Notes: 2 RAP practices and 2 CQI practices had limited or no active participation after baseline. Clinicians surveyed using the Assessment of Clinician Diabetes Management included all physicians, nurse practitioners, and physician assistants. Clinicians and staff surveyed using the Practice Culture Assessment included everyone in any role in the practice.
Practice and Patient Characteristics
Baseline practice and patient characteristics are given in Table 1. Age and sex were similar across groups in the chart review sample, but baseline HbA1c level, systolic blood pressure, and total cholesterol level differed significantly across groups (all P <.05), with slightly better baseline control of each in RAP practices.
Table 1.
Baseline Practice and Patient Characteristics
| Characteristic | RAP | CQI | SD |
|---|---|---|---|
| Practices | (n = 15) | (n = 10) | (n = 15) |
| Rural, No. (%) | 4 (27) | 2 (20) | 4 (27) |
| Practice size (office visits per week), No. (%) | |||
| Large (>400) | 3 (20) | 1 (10) | 3 (33) |
| Medium (91–400) | 10 (67) | 4 (40) | 10 (47) |
| Small (1–90) | 2 (13) | 5 (50) | 2 (20) |
| Patients on Medicaid, % | |||
| <5% | 8 (53) | 4 (40) | 6 (40) |
| 5%–20% | 3 (20) | 4 (40) | 4 (27) |
| >20% | 4 (27) | 2 (20) | 5 (33) |
| Patientsa | (n = 312) | (n = 189) | (n = 321) |
| Sex, % male | 44.2 | 52.9 | 50.5 |
| Age, mean (SD), y | 60.5(12.6) | 61.9 (12.1) | 60.0 (13.2) |
| Medical comorbidities, mean (SD), No.b | 2.1 (1.2) | 2.0 (1.3) | 2.0 (1.1) |
| Have psychiatric comorbidity, %c | 20.5 | 14.3 | 13.1 |
| HbA1c level, mean (SD), %d | 7.18 (1.59) | 7.35 (1.76) | 7.69 (2.00) |
| Systolic blood pressure, mean (SD), mm Hgd | 128.3 (16.4) | 131.8 (17.7 | 132.9 (19.7) |
| Diastolic blood pressure, mean (SD), mm Hg | 76.9 (10.9) | 78.5 (12.2) | 78.0 (11.9) |
| Total cholesterol level, mean (SD), mg/dLe | 174.5 (42.6) | 185.8 (49.3) | 184.8 (50.4) |
CQI = continuous quality improvement; HbA1c = hemoglobin A1c; RAP = reflective adaptive process; SD = self-directed.
HbA1c levels were determined for 636 patients, systolic and diastolic blood pressure for 799 patients, and total cholesterol levels for 703 patients.
Arthritis, connective tissue disease, gastrointestinal problems, coronary disease, hyperlipidemia, hypertension, liver disease, pulmonary disease, neurologic disease, peripheral vascular disease, renal disease, stroke, dementia, cancer in past 3 years.
Depression, substance abuse, other psychiatric diagnosis.
P <.01.
P <.05.
Patient Chart Audit
Analysis of chart audit data for diabetes process of care over time (Table 2) indicated differential improvement across groups in the number of elements that were up to date at the end of each audit period by study group (P <.0001). Although total process of care scores improved in all 3 groups (all P <.05), improvement was greater in CQI practices compared with both SD practices (P <.0001) and RAP practices (P <.0001). Improvement in process of care scores was also greater in SD practices compared with RAP practices (P = .03).
Table 2.
Diabetes Quality Measures Over Time by Group
| Quality Measure | RAP | CQI | SD | Differential Change Over Time | P Value |
|---|---|---|---|---|---|
| Total process of care scorea | |||||
| Baseline | 4.54 | 3.58 | 3.63 | Overall: F4,2386 = 10.70 | <.0001 |
| 9 months | 4.69 | 4.91 | 4.04 | RAP × SD: F2,1838 = 3.65 | .03 |
| 18 months | 4.85 | 4.91 | 4.39 | CQI × SD: F2,1475 = 9.99 | <.0001 |
| …b | …c | …c | CQI × RAP: F2,1455 = 19.27 | <.0001 | |
| HbA1c level checked, % | |||||
| Baseline | 85.8 | 69.9 | 77.6 | Overall: F4,1568 = 0.49 | .09 |
| 9 months | 91.7 | 92.3 | 88.2 | RAP × SD: F2,1208 = 0.14 | .87 |
| 18 months | 93.7 | 91.0 | 89.3 | CQI × SD: F2,968 = 2.98 | .051 |
| …c | …c | …c | CQI × RAP: F2,957 = 3.35 | .04 | |
| Feet checked, % | |||||
| Baseline | 43.5 | 34.1 | 35.1 | Overall: F4,1568 = 2.98 | .02 |
| 9 months | 57.9 | 60.8 | 41.5 | RAP × SD: F2,1208 = 14.86 | .34 |
| 18 months | 60.2 | 68.7 | 52.2 | CQI × SD: F2,968 = 4.80 | .009 |
| …c | …c | …c | CQI × RAP: F2,957 = 3.57 | .03 | |
| Blood pressure checked, % | |||||
| Baseline | 92.1 | 84.2 | 86.5 | Overall: F4,1567 = 0.34 | .85 |
| 9 months | 99.5 | 99.6 | 98.8 | RAP × SD: F2,1207 = 0.03 | .97 |
| 18 months | 99.7 | 99.1 | 99.5 | CQI × SD: F2,967 = 0.66 | .51 |
| …c | …c | …c | CQI × RAP: F2,957 = 0.38 | .68 | |
| Dilated eye examination, % | |||||
| Baseline | 16.1 | 8.5 | 6.0 | Overall: F4,1567 = 2.35 | .052 |
| 9 months | 16.0 | 18.1 | 5.3 | RAP × SD: F2,1207 = 1.23 | .29 |
| 18 months | 22.4 | 18.1 | 12.6 | CQI × SD: F2,967 = 3.39 | .03 |
| …d | …c | …c | CQI × RAP: F2,957 = 2.66 | .07 | |
| Cholesterol checked, % | |||||
| Baseline | 81.7 | 61.8 | 71.4 | Overall: F4,1567 = 6.11 | <.0001 |
| 9 months | 78.8 | 86.4 | 79.5 | RAP × SD: F2,1207 = 3.64 | .03 |
| 18 months | 79.9 | 79.5 | 81.1 | CQI × SD: F2,967 = 4.21 | .02 |
| … | …c | …c | CQI × RAP: F2,957 = 11.78 | <.0001 | |
| Nephropathy screening, % | |||||
| Baseline | 38.1 | 18.7 | 24.4 | Overall: F4,1567 = 2.04 | .09 |
| 9 months | 33.1 | 27.7 | 20.2 | RAP × SD: F2,1207 = 0.30 | .74 |
| 18 months | 33.6 | 26.9 | 23.8 | CQI × SD: F2,967 = 2.90 | .056 |
| … | …d | … | CQI × RAP: F2,957 = 3.44 | .03 | |
| Influenza vaccination, % | |||||
| Baseline | 27.7 | 28.7 | 18.0 | Overall: F4,1567 = 3.01 | .02 |
| 9 months | 29.6 | 45.3 | 21.8 | RAP × SD: F2,1207 = 3.96 | .02 |
| 18 months | 25.9 | 44.3 | 30.0 | CQI × SD: F2,967 = 1.52 | .22 |
| … | …c | …c | CQI × RAP: F2,957 = 3.30 | .04 | |
| Nutrition counseling, % | |||||
| Baseline | 38.0 | 16.7 | 21.3 | Overall: F5,1567 = 2.61 | .03 |
| 9 months | 32.4 | 26.1 | 24.1 | RAP × SD: F2,1207 = 1.62 | .19 |
| 18 months | 38.1 | 29.6 | 20.8 | CQI × SD: F2,967 = 2.76 | .06 |
| … | …b | … | CQI × RAP: F2,957 = 3.86 | .02 | |
| Self-management support, % | |||||
| Baseline | 20.4 | 22.2 | 12.9 | Overall: F4,1567 = 1.09 | .36 |
| 9 months | 18.8 | 24.4 | 14.2 | RAP × SD: F2,1207 = 1.57 | .21 |
| 18 months | 21.4 | 24.2 | 21.0 | CQI × SD: F2,967 = 1.35 | .26 |
| … | … | …b | CQI × RAP: F2,957 = 0.23 | .79 | |
CQI = Continuous Quality Improvement; HbA1c = hemoglobin A1c; RAP = Reflective Adaptive Process; SD = self-directed.
Note: Data are from chart audits. All measures pertain to whether care was provided in past 12 months.
Possible scores ranged from 0 to 9, with higher scores indicating better quality of diabetes care.
P <.05 within-group change.
P <.01 within-group change.
P <.10 within-group change.
We examined individual trajectories for all study practices to determine whether patient outcomes were adversely affected in any practice. Most practices (72%) improved, and none had a significant worsening in diabetes process of care (all P >.05). Although not statistically significant, heterogeneity in practice-level change scores going from baseline to 18 months among the RAP practices (range, −0.51 to 2.12, SD 0.70) was less than that among CQI practices (range, −1.14 to 3.83, SD 1.47) and SD practices (range, −0.83 to 3.17, SD 1.09). We did not identify any factors (eg, practice type, location) clearly associated with improvement or worsening in process of care on closer inspection of individual trajectories.
The individual process of care elements are also shown in Table 2. There was overall differential change by group for several elements, including having feet checked (P = .02), having cholesterol levels checked (P <.0001), receiving the influenza vaccine (P = .02), and nutritional counseling (P = .03), with the greatest improvement in CQI practices. Additionally, there was greater improvement in CQI practices compared with RAP practices in having HbA1c levels checked and nephropathy screening (both P <.05). CQI practices had greater improvement than SD practices in eye examinations (P <.05).
Among the 803 patients with HbA1c levels checked during the study period (mean = 3.85 measures per person), the level remained stable over time in all groups. Among the 821 patients with blood pressure readings during the study period (mean = 6.0 measures per person), systolic blood pressure decreased slightly (1.04 mm Hg/year; P = .03), but trajectories did not differ by group. Diastolic blood pressure remained stable over time in all groups. Among the 782 patients with LDL cholesterol measures (mean = 2.87 measures per person), there was an overall decrease in level (5.27 units/year; P = .02), but trajectories were similar across groups. Results were much the same when analyses were restricted to patients above target at baseline.
Practice Culture Assessment
Factor analysis of Practice Culture Assessment items indicated that 3 factors should be retained. Factor loadings and individual items are shown in Table 3. Factor loadings can be interpreted as the correlations between the individual items and the rotated factors derived from the factor analysis, and indicate how strongly an item is associated with each factor. Factor scores on the 3 subscales were created as the sum of scores (reverse scored for negatively worded items) on the individual items with the highest loadings on that dimension, scaled to a 0 to 100 range with higher scores representing “more” of the concept. Internal consistency was high for all subscales: Change Culture (0.91), Work Culture (0.91), and Chaos (0.78). Results of analyses of Practice Culture Assessment subscales over time across study groups are shown in Table 4. Change Culture scores differed significantly over time in RAP practices compared with SD practices (P = .04), with a trend toward initial improvement (baseline to 9 months, P = .07) followed by a significant decline from 9 months to 18 months (P <.05), while these scores remained stable in SD practices over time. Work Culture scores over time also differed significantly in RAP practices compared with SD practices (P = .01), with a decrease from baseline levels at 18 months in RAP practices (P <.05) and stable scores over time in SD practices. CQI practices had stable scores for both Change Culture and Work Culture over time and did not differ significantly from SD practices. Chaos scores increased in both the RAP and CQI groups compared with the SD group (RAP vs SD: P = .03; CQI vs SD: P = .007).
Table 3.
Practice Culture Assessment Factor Loadings for Individual Items, by Subscale
| Item | Change Culture | Work Culture | Chaos |
|---|---|---|---|
| After making a change, we discuss what worked and what didn’t. | 0.66398 | … | … |
| This practice puts a great deal of effort into improving the quality of care. | 0.67917 | … | … |
| This practice encourages everybody’s input for making changes. | 0.81108 | … | … |
| We regularly take time to consider ways to improve how we do things. | 0.79724 | … | … |
| The practice leadership makes sure that we have the time and space necessary to discuss changes to improve care. | 0.78396 | … | … |
| This practice uses data and information to improve the work of the practice. | 0.62714 | … | … |
| Our practice encourages people to share their ideas about how to improve things. | 0.79928 | … | … |
| The leadership in this practice is available to discuss work related problems | 0.72885 | … | … |
| When we experience a problem in the practice we make a serious effort to figure out what’s really going on. | 0.72684 | … | … |
| The leadership of this practice is good at helping us to make sense of problems or difficult situations. | 0.74846 | … | … |
| My opinion is valued by others in this practice. | … | 0.69821 | … |
| People in this practice understand how their jobs fit into the rest of the practice. | … | 0.65733 | … |
| I can rely on the other people in this practice to do their jobs well. | … | 0.73350 | … |
| When there is conflict or tension in this practice, those involved are encouraged to talk about it. | … | 0.67104 | … |
| People in this practice are thoughtful about how they do their jobs | … | 0.77181 | … |
| People in this practice pay attention to how their actions affect others in the practice. | … | 0.74617 | … |
| Most of the people who work in our practice seem enjoy their work. | … | 0.76567 | … |
| The practice leadership promotes an environment that is an enjoyable place to work. | … | 0.76768 | … |
| This practice is almost always in chaos. | … | … | 0.71993 |
| This practice is very disorganized. | … | … | 0.73899 |
| Our practice has recently been very stable. | … | … | −0.67600 |
| Things have been changing so fast in our practice that it is hard to keep up with what is going on. | … | … | 0.58880 |
Table 4.
Practice Culture Assessment Scores Over Time by Group
| Subscale | RAP | CQI | SD | Differential Change Over Time | P Value |
|---|---|---|---|---|---|
| Change Culture | |||||
| Baseline | 66.2 | 69.5 | 67.1 | Overall: F4,66 = 1.91 | .12 |
| 9 months | 68.5 | 68.5 | 66.6 | RAP × SD: F2,52 = 3.33 | .04 |
| 18 months | 64.0 | 67.3 | 66.9 | CQI × SD: F2,42 = 0.51 | .60 |
| …a | … | … | CQI × RAP: F2,38 = 1.75 | .19 | |
| Chaos | |||||
| Baseline | 47.7 | 43.4 | 49.0 | Overall: F4,66 = 3.47 | .01 |
| 9 months | 50.2 | 46.8 | 50.0 | RAP × SD: F2,52 = 3.87 | .03 |
| 18 months | 50.8 | 48.2 | 47.3 | CQI × SD: F2,42 = 5.63 | .007 |
| …b | …b | … | CQI × RAP: F2,38 = 0.49 | .62 | |
| Work Culture | |||||
| Baseline | 69.8 | 68.7 | 66.5 | Overall: F4,66 = 2.34 | .06 |
| 9 months | 68.8 | 69.2 | 68.1 | RAP × SD: F2,52 = 4.59 | .01 |
| 18 months | 66.4 | 68.6 | 68.5 | CQI × SD: F2,42 = 0.49 | .62 |
| …b | … | … | CQI × RAP: F2,38 = 1. 59 | .22 |
CQI = continuous quality improvement; RAP = reflective adaptive process; SD = self-directed.
Note: Scores are means.
P <.01 within-group change.
P <.05 within-group change.
DISCUSSION
In this comparative trial of 3 strategies for implementing the Chronic Care Model to improve diabetes care, all 3 study groups had significant improvement in diabetes process of care. CQI practices, which followed a prescribed strategy of implementing registries to have diabetes quality measures to motivate practice action, identify needed changes, and monitor progress, had significantly greater improvement in diabetes process measures than practices in the other 2 groups, but little change in practice culture. RAP practices, which followed a more practice-determined approach particularly aimed at improving practice culture, had significantly less improvement in diabetes measures than CQI or SD practices. RAP practices showed marginal improvement in Change Culture at 9 months followedby a decline at 18 months, along with a decline in Work Culture at 18 months. The slight but significant increases in practice chaos levels in the 2 facilitated study arms is interesting but expected, as implementation of such a change process tends to cause some chaos and disruptions in practice routines.
Traditional quality improvement strategies can be successful in implementing specific tools to improve quality measures in a focused, disease-specific area (such as the CQI intervention in our study), but this approach has been criticized for failing to achieve sustained improvements or highly adaptable practice cultures capable of innovating effectively. In this study, most improvements in overall diabetes process of care occurred during the initial 9-month period, and this improvement was sustained at 18 months.
The RAP model attempts to facilitate an adaptive learning organization that can generate ongoing efforts to enhance overall practice functioning, including quality measures. Similarto EPIC, the ULTRA project (Using Learning Teams for Reflective Adaptation) hypothesized that a facilitated RAP intervention would produce effective communication and change strategies that would subsequently lead to improved quality measures.30 That study found that practices identified and addressed issues related to communication, access to care, and access to information, but none focused on improving adherence to chronic disease care guidelines, and patient outcomes were not affected.30 Other studies have demonstrated that certain aspects of practice culture are associated with successful implementation of quality improvement interventions and improved patient process of care31–33; thus, improvements in practice culture through facilitation may enhance the practice’s ability to successfully change. In this study, practice culture may have been adversely affected by facilitators leaving the practice before stable improvements were achieved.
Although significant improvements were made in diabetes measures in all 3 study groups, care was still suboptimal at the end of the study period. Implementation of major changes in practices to improve care is not a quick process, and a sustained effort by practices (and organizations supporting them) to achieve the long-term improvements is needed. Further testing of intervention models for achieving these long-term improvements is warranted. Incremental changes are helpful, but major, transformational changes are needed.
It is an interesting and fairly consistent finding in quality improvement projects that process of care measures are easier to improve and respond more quickly than patient outcome measures, a pattern seen again in our study. In Glasgow’s Diabetes Priority Program study, patients of physicians randomized to the intervention had greater improvement in diabetes process of care than patients of physicians in the control group.40 These changes did not translate into statistically greater improvement in clinical outcomes, however. In a subsequent analysis of data from that study, Nutting et al41 demonstrated that greater clinician-reported use of elements of the Chronic Care Model was associated with improved patient clinical outcomes. This association certainly needs continued attention in our quality improvement and practice redesign efforts, as improvement in clinical outcomes are, in the long term, much more important than improved process measures.
Limitations of our study included differences in some baseline practice characteristics across groups, despite attempts to balance the groups by stratification. This imbalance could have resulted in greater room for improvement in some quality measures in CQI and SD practices. Also, the self-report Practice Culture Assessment data were potentially subject to bias, although such bias would likely be similar across groups.
The EPIC trial, framed in the context of related efforts, suggests several things: (1) traditional CQI interventions are effective at improving chronic disease quality metrics but may not improve practice culture; (2) motivated primary care practices can make some improvements with minimal assistance; (3) a short-term RAP-based intervention to improve practice culture may not be effective in primary care practices; (4) not all primary care practices may need the same type, intensity, or duration of assistance, and tailoring the approach to the practice is desirable; however, more information is necessary to guide the tailoring process; and (5) new models are needed to produce the long-term improvements in both quality measures and practice culture necessary for sustained enhancement of primary care practices. Additionally, heterogeneity in practices’ response to interventions suggests potential avenuesfor further exploration regarding which practices may respond best to which approaches, as well as identifying potential practice-level mediators of improvement.
The insights gained from the EPIC trial have ramifications for the further development and deployment of advanced primary care models that will be central in the redesigned health care system. Transforming the nation’s primary care practices will require a serious investment, and practice facilitation has been proposed as a foundation for change through a health extension service.42 Transformation to a PCMH requires more extensive change than improving diabetes care. The National Demonstration Project showed that even with 2 years of intense facilitation, implementing all PCMH components was very difficult.21,22 Although we can learna great deal from disease-specific studies, the policy issues they inform must consider more complex, interdependent changes to achieve comprehensive primary care and health system redesign. Practice facilitators attempting to promote sustained change in practices will need a broad range of skills in assessing practice culture, managing group process over time, and providing instrumental assistance to strengthen the 4 pillars of primary care, develop proactive population-based chronic and preventive care, and enhance patient centeredness and self-management support. Those who deploy practice facilitators must be prepared to assist practices over time, as a quick-in, quick-out approach will be ineffective in producing sustained comprehensive change. Further study is needed to compare different approaches, to identify salient characteristics of successful practice facilitation models, to determine the optimum “dosing” of practice facilitation for various targeted outcomes, to determine the characteristics of practices that respond to various change strategies, and to refine current approaches to achieve the dual goals of implementing innovations and enhancing practice change culture.
Footnotes
Conflicts of interest: authors report none.
Clinicaltrials.gov Protocol Registration Receipt NCT00414986.
Previous presentations: Some of these data were presented at the North American Primary Care Research Group meeting in Banff, Alberta, in November 2011.
Funding support: Funding for this work was supported by the National Institute of Diabetes and Digestive and Kidney Diseases (DF067083) and the National Institute of Mental Health (MH069809-04).
References
- 1.Grundy P, Hagan KR, Hansen JC, Grumbach K. The multi-stakeholder movement for primary care renewal and reform. Health Aff (Millwood). 2010;29(5):791–798 [DOI] [PubMed] [Google Scholar]
- 2.Bodenheimer T, Pham HH. Primary care: current problems and proposed solutions. Health Aff (Millwood). 2010;29(5):799–805 [DOI] [PubMed] [Google Scholar]
- 3.Rosenthal TC. The medical home: growing evidence to support a new approach to primary care. J Am Board Fam Med. 2008;21(5):427–440 [DOI] [PubMed] [Google Scholar]
- 4.Fisher ES. Building a medical neighborhood for the medical home. N Engl J Med. 2008;359(12):1202–1205 [DOI] [PMC free article] [PubMed] [Google Scholar]
- 5.Starfield B, Shi L, Macinko J. Contribution of primary care to health systems and health. Milbank Q. 2005;83(3):457–502 [DOI] [PMC free article] [PubMed] [Google Scholar]
- 6.Wagner EH, Austin BT, Von Korff M. Organizing care for patients with chronic illness. Milbank Q. 1996;74(4):511–544 [PubMed] [Google Scholar]
- 7.Bodenheimer T, Wagner EH, Grumbach K. Improving primary care for patients with chronic illness: the Chronic Care Model, Part 2. JAMA. 2002;288(15):1909–1914 [DOI] [PubMed] [Google Scholar]
- 8.Parchman ML, Pugh JA, Wang CP, Romero RL. Glucose control, self-care behaviors, and the presence of the chronic care model in primary care clinics. Diabetes Care. 2007;30(11):2849–2854 [DOI] [PubMed] [Google Scholar]
- 9.Schmittdiel J, Mosen DM, Glasgow RE, Hibbard J, Remmers C, Bellows J. Patient Assessment of Chronic Illness Care (PACIC) and improved patient-centered outcomes for chronic conditions. J Gen Intern Med. 2008;23(1):77–80 [DOI] [PMC free article] [PubMed] [Google Scholar]
- 10.Acton KJ, Shields R, Rith-Najarian S, et al. Applying the diabetes quality improvement project indicators in the Indian Health Service primary care setting. Diabetes Care. 2001;24(1):22–26 [DOI] [PubMed] [Google Scholar]
- 11.Institute of Medicine Committee on Quality of Health Care in America, ed. Crossing the Quality Chasm: A New Health System for the 21st Century. Washington, DC: National Academy Press; 2001 [PubMed] [Google Scholar]
- 12.Tallia AF, Stange KC, McDaniel RR, Jr, Aita VA, Miller WL, Crabtree BF. Understanding organizational designs of primary care practices. J Healthc Manag. 2003;48(1):45–59; discussion 60–41 [PubMed] [Google Scholar]
- 13.Solberg LI, Brekke ML, Fazio CJ, et al. Lessons from experienced guideline implementers: attend to many factors and use multiple strategies. J Qual Improve. 2000;26(4):171–188 [DOI] [PubMed] [Google Scholar]
- 14.Wagner EH, Austin BT, Davis C, Hindmarsh M, Schaefer J, Bonomi A. Improving chronic illness care: translating evidence into action. Health Aff (Millwood). 2001;20(6):64–78 [DOI] [PubMed] [Google Scholar]
- 15.Davis DA, Thomson MA, Oxman AD, Haynes RB. Changing physician performance. A systematic review of the effect of continuing medical education strategies. JAMA. 1995;274(9):700–705 [DOI] [PubMed] [Google Scholar]
- 16.Cabana MD, Rand CS, Powe NR, et al. Why don’t physicians follow clinical practice guidelines? A framework for improvement. JAMA. 1999;282(15):1458–1465 [DOI] [PubMed] [Google Scholar]
- 17.Nagykaldi Z, Mold JW, Aspy CB. Practice facilitators: a review of the literature. Fam Med. 2005;37(8):581–588 [PubMed] [Google Scholar]
- 18.Frijling B, Hulscher ME, van Leest LA, et al. Multifaceted support to improve preventive cardiovascular care: a nationwide, controlled trial in general practice. Br J Gen Pract. 2003;53(497):934–941 [PMC free article] [PubMed] [Google Scholar]
- 19.Hogg W, Baskerville N, Nykiforuk C, Mallen D. Improved preventive care in family practices with outreach facilitation: understanding success and failure. J Health Serv Res Policy. 2002;7(4):195–201 [DOI] [PubMed] [Google Scholar]
- 20.Baskerville NB, Liddy C, Hogg W. Systematic review and meta-analysis of practice facilitation within primary care settings. Ann Fam Med. 2012;10(1):63–74 [DOI] [PMC free article] [PubMed] [Google Scholar]
- 21.Nutting PA, Crabtree BF, Stewart EE, et al. Effect of facilitation on practice outcomes in the National Demonstration Project model of the patient-centered medical home. Ann Fam Med. 2010;8(Suppl 1):S33–S44, S92 [DOI] [PMC free article] [PubMed] [Google Scholar]
- 22.Nutting PA, Crabtree BF, Miller WL, Stange KC, Stewart E, Jaen C. Transforming physician practices to patient-centered medical homes: lessons from the National Demonstration Project. Health Aff (Millwood). 2011;30(3):439–445 [DOI] [PMC free article] [PubMed] [Google Scholar]
- 23.Fifield J, Forrest DD, Martin-Peele M, et al. A randomized, controlled trial of implementing the patient-centered medical home model in solo and small practices. J Gen Intern Med. 2013;28(6):770–777 [DOI] [PMC free article] [PubMed] [Google Scholar]
- 24.Shaw EK, Howard J, West DR, et al. The role of the champion in primary care change efforts: from the State Networks of Colorado Ambulatory Practices and Partners (SNOCAP). J Am Board Fam Med. 2012;25(5):676–685 [DOI] [PMC free article] [PubMed] [Google Scholar]
- 25.Berwick DM. Continuous improvement as an ideal in health care. N Engl J Med. 1989;320(1):53–56 [DOI] [PubMed] [Google Scholar]
- 26.Batalden PB, Stoltz PK. A framework for the continual improvement of health care: building and applying professional and improvement knowledge to test changes in daily work. Jt Comm J Qual Improv. 1993;19(10):424–447, discussion 448–452 [DOI] [PubMed] [Google Scholar]
- 27.Berwick DM, Godfrey AB, Roessner J. Curing Health Care: New Strategies for Quality Improvement. 1st ed San Francisco, CA: Jossey-Bass; 1990 [Google Scholar]
- 28.Stroebel CK, McDaniel RR, Jr, Crabtree BF, Miller WL, Nutting PA, Stange KC. How complexity science can inform a reflective process for improvement in primary care practices. Jt Comm J Qual Patient Saf. 2005;31(8):438–446 [DOI] [PubMed] [Google Scholar]
- 29.Crabtree BF, Nutting PA, Miller WL, et al. Primary care practice transformation is hard work: insights from a 15-year developmental program of research. Med Care. 2011;49(Suppl):S28–S35 [DOI] [PMC free article] [PubMed] [Google Scholar]
- 30.Balasubramanian BA, Chase SM, Nutting PA, et al. ULTRA Study Team Using Learning Teams for Reflective Adaptation (ULTRA): insights from a team-based change management strategy in primary care. Ann Fam Med. 2010;8(5):425–432 [DOI] [PMC free article] [PubMed] [Google Scholar]
- 31.Nembhard IM, Singer SJ, Shortell SM, Rittenhouse D, Casalino LP. The cultural complexity of medical groups. Health Care Manage Rev. 2012;37(3):200–213 [DOI] [PubMed] [Google Scholar]
- 32.Bosch M, Dijkstra R, Wensing M, van der Weijden T, Grol R. Organizational culture, team climate and diabetes care in small office-based practices. BMC Health Serv Res. 2008;8:180. [DOI] [PMC free article] [PubMed] [Google Scholar]
- 33.Nutting PA, Crabtree BF, Miller WL, Stewart EE, Stange KC, Jaén CR. Journey to the patient-centered medical home: a qualitative analysis of the experiences of practices in the National Demonstration Project. Ann Fam Med. 2010;8(Suppl 1):S45–S56, S92 [DOI] [PMC free article] [PubMed] [Google Scholar]
- 34.American Diabetes Association Diabetes Recognition Program (DRP). http://www.ncqa.org/tabid/139/Default.aspx Accessed Aug 13, 2012
- 35.Ohman-Strickland PA, John Orzano A, Nutting PA, et al. Measuring organizational attributes of primary care practices: development of a new instrument. Health Serv Res. 2007;42(3 Pt 1):1257–1273 [DOI] [PMC free article] [PubMed] [Google Scholar]
- 36.Jaén CR, Crabtree BF, Palmer RF, et al. Methods for evaluating practice change toward a patient-centered medical home. Ann Fam Med. 2010;8(Suppl 1):S9–S20, S92 [DOI] [PMC free article] [PubMed] [Google Scholar]
- 37.Rothman KJ. No adjustments are needed for multiple comparisons. Epidemiology. 1990;1(1):43–46 [PubMed] [Google Scholar]
- 38.Perneger TV. What’s wrong with Bonferroni adjustments. BMJ. 1998;316(7139):1236–1238 [DOI] [PMC free article] [PubMed] [Google Scholar]
- 39.SAS v9.3. Cary, NC: SAS Institute Inc, 2011 [Google Scholar]
- 40.Glasgow RE, Nutting PA, King DK, et al. Randomized effectiveness trial of a computer-assisted intervention to improve diabetes care. Diabetes Care. 2005;28(1):33–39 [DOI] [PubMed] [Google Scholar]
- 41.Nutting PA, Dickinson WP, Dickinson LM, et al. Use of chronic care model elements is associated with higher-quality care for diabetes. Ann Fam Med. 2007;5(1):14–20 [DOI] [PMC free article] [PubMed] [Google Scholar]
- 42.Grumbach K, Mold JW. A health care cooperative extension service: transforming primary care and community health. JAMA. 2009;301(24):2589–2591 [DOI] [PubMed] [Google Scholar]