

Selective STAT3 inhibition controls human T cell alloreactivity, while permitting STAT5-mediated immune regulatory and effector functions.
Keywords: allogeneic hematopoietic stem cell transplantation, GVHD, alloreactivity
Abstract
Alloreactivity negatively influences outcomes of organ transplantation or HCT from allogeneic donors. Standard pharmacologic immune suppression impairs T-cell function and jeopardizes the beneficial reconstitution of Tregs. Murine transplantation models have shown that STAT3 is highly expressed in alloreactive T cells and may be therapeutically targeted. The influence and effects of STAT3 neutralization in human alloreactivity, however, remain to be elucidated. In this study, S3I-201, a selective small-molecule inhibitor of STAT3, suppressed human DC-allosensitized T-cell proliferation and abrogated Th17 responses. STAT3 blockade significantly enhanced the expansion of potent iTregs and permitted CD8+ cytolytic effector function. Mechanistically, S3I-201 polarized the ratio of STAT phosphorylation in favor of STAT5 over STAT3 and also achieved a significant degree of Foxp3 demethylation among the iTregs. Conversely, selective impairment of STAT5 phosphorylation with CAS 285986-31-4 markedly reduced iTregs. STAT3 represents a relevant target for achieving control over human alloresponses, where its suppression facilitates STAT5-mediated iTreg growth and function.
Introduction
Unregulated alloreactivity is a significant challenge to successful outcomes in solid-organ transplantation and HCT and may compromise allograft viability and induce GVHD, respectively. The cytokine milieu observed in such inflammatory states activates downstream signaling pathways that exert control over alloresponder T-cell function. The STAT3-mediated proinflammatory cytokines IL-6 and -23 favor Th17 differentiation over that of Tregs [1, 2]. Several lines of evidence demonstrate the biologic relevance of Th17 cells in the development of GVHD [3, 4]. STAT3 activates IL21 and CCR6 gene expression in naive T cells and induces Th17 expansion [5]. Conversely, IL-2-driven STAT5 promotes FOXP3 expression in CD4+ T cells, supporting the development and growth of Tregs [6]. As such, STAT5 signaling is significantly enhanced in Tregs compared with Tconvs [7, 8]. This STAT5-dependent Treg differentiation pathway, however, must compete with IL-6 signaling, which impairs STAT5-FOXP3 molecular interactions [6]. Therefore, polarizing the balance of phosphorylated STAT5 and -3 represents a rational therapeutic strategy in controlling alloreactivity.
Murine alloeffectors express high levels of phosphorylated STAT3 [9]. STAT3-deficient donor T cells favor Treg expansion over Th17 responses and limit GVHD in mice receiving allogeneic bone marrow grafts [6]. In addition, mouse systems replicating cutaneous chronic GVHD have demonstrated that STAT3 is necessary for disease induction [10]. The immunosuppressive effects and mechanistic features of STAT3 inhibition in a human system of alloreactivity remains to be described and is of specific importance, given the translational potential of this concept in preventing GVHD.
JAK2 inhibition has been shown to control alloreactivity, largely by a reduction in downstream STAT3 phosphorylation [11]. To capitalize on this approach and advance beyond observations from murine systems targeting STAT3, we investigated the impact of specific STAT3 inhibition on human DC-allosensitized T-cell responses by using S3I-201, a small-molecule inhibitor with antineoplastic activity [12]. In our study, opposing STAT5- and -3 signaling events directed the allosensitized immune landscape in a human model, where STAT3 inhibition is a platform that promotes potent iTreg expansion and control alloresponses. Distinct from the experiments reported in a murine GVHD model [6], in our experiments, human iTregs differentiated from untreated, naive T cells during the allogeneic response, but significantly increased in number when the culture was exposed to pharmacologic STAT3 blockade. Moreover, we establish that CD8 CTL function is preserved despite STAT3 inhibition. Conversely, selective STAT5 blockade reduced the number of iTregs in identical conditions.
MATERIALS AND METHODS
Cells, media, and reagents
Donor leukocyte concentrates were obtained from healthy volunteers in accordance with the Declaration of Helsinki (Florida Blood Services, St. Petersburg, FL, USA). PBMCs were isolated over lymphocyte separation medium (Corning Cellgro, Manassas, VA, USA). T cells were isolated in an inactivated state through nylon–wool column elution (Fisher Scientific, Pittsburgh, PA, USA), with a purity of >95%. moDCs were cytokine generated and matured as published [11]. Small-molecule inhibitors included S3I-201 (STAT3) and CAS 285986-31-4 (STAT5) (EMD Millipore, Billerica, MA, USA), diluted in DMSO (<0.1% v/v).
mAbs and flow cytometry
Fluorochrome-conjugated mouse anti-human mAbs included anti-CD3, -CD4, -CD8, -CD25, -CD45RO, -CD107a, -CD127, -Foxp3, -pSTAT3/pY705, -pSTAT5/pY694, -IFN-γ, and -IL-17A (BD Biosciences, San Jose, CA. USA; eBioscience; San Diego, CA, USA; Invitrogen; Carlsbad, CA, USA). Viability was assessed by Live/Dead staining (Invitrogen). Live events were acquired on FACSCalibur or LSRII (BD Biosciences) flow cytometers (FlowJo software, ver. 7.6.4; TreeStar, Ashland, OR, USA). Gates were defined by appropriate isotype controls. Naive T-cell sorting was performed on the FACSVantageDiVa (BD Biosciences). Where indicated, CD4+ T cells were purified by magnetic-bead negative selection (Miltenyi Biotec, Auburn, CA, USA).
Allo-MLRs
Allo-MLRs consisted of T cells stimulated by cytokine-mature moDCs (DC:T-cell ratio 1:30, 1×10⁵ T cells per 100 μl medium in a 96-well plate, 37°C). S3I-201 (50 or 100 μM) or DMSO control was added once on day 0. The allogeneic moDC stimulators were matured with a cytokine cocktail and terminally differentiated, eliminating the need for irradiation [11]. T-cell proliferation was quantified by a colorimetric assay (CellTiter 96 AQueous One Solution Cell Proliferation Assay [MTS]; Promega, Madison, WI) on day 5, per the manufacturer's instructions, with absorbance quantified at 490 nm [11]. The stimulation index was calculated by dividing the OD of the allo-MLR by the OD of T cells alone. PHA-stimulated T cells served as a positive control. Identical allo-MLRs were cultured with CAS 285986-31-4, to determine the dose–response effect of STAT5 inhibition on allostimulated T-cell growth. For these initial experiments, the cultures were analyzed on day 4 because of the early rapid T-cell proliferation among the STAT5 inhibitor–treated wells. The stimulation index was determined as described. CAS 285986-31-4 (1 μM) was identified as the optimal concentration, based on maximum T-cell proliferation, and 5-day cocultures were used in subsequent experiments.
Evaluation of STAT3 and -5 phosphorylation
To confirm selective STAT3 inhibition, T cells were first briefly allostimulated by moDCs (DC:T cell ratio 1:30) and then pulsed with the relevant STAT3- or -5-dependent cytokine in the presence or absence of S3I-201. The 3-day exposure to allogenic moDCs allows the responding T cells to increase CD25 expression and capacity to receive IL-2 signaling, while resting or stimulated T cells phosphorylate STAT3 in response to IL-6 [11]. DC-allostimulated T cells (1×10⁶) were then exposed to S3I-201 (50 or 100 μM) or DMSO for 4 h in serum-free RPMI (Corning Cellgro) to reduce background phosphorylation, followed by a 15 min pulse with IL-6 (4000 IU/ml) or -2 (50 IU/ml). T-cell STAT phosphorylation was determined by surface staining for CD3, followed by fixation (CytoFix; BD Biosciences), permeabilization with cold methanol, and intracellular staining for STAT3 and -5. The phosphorylated STAT3 and -5 geometric MFI ratio was calculated by dividing the geometric MFI of the cytokine-pulsed cells by the geometric MFI of the corresponding fluorochrome isotype. The percentage of STAT3 and bright STAT5 phosphorylation in the T cells is depicted by the gates in each respective histogram (Fig. 1C, D).
Figure 1. Selective STAT3 inhibition impaired DC-allosensitized T-cell responses.

(A) Dose response of S3I-201 (STAT3 inhibitor, 0–200 μM) in human allo-MLRs (DC:T cell ratio 1:30) treated once on day 0 with drug or DMSO diluent control, with a readout of T-cell proliferation on day 5. (B) Suppression of responder T-cell proliferation was confirmed in subsequent allo-MLRs exposed to S3I-201 (50 or 100 μM) or DMSO once on day 0, in identical culture conditions. T-cell proliferation was determined by a colorimetric assay on day 5. The stimulation index was calculated by dividing the OD of the allo-MLR by the OD of T cells alone. PHA-stimulated T cells served as the positive control. The stimulation index is an average of triplicate means from 3 independent experiments ± sem. (C, D) Representative contour plots demonstrate gating strategy of CD3+ T cells and histograms show on-target inhibition of IL-6/STAT3 phosphorylation, paired with intact IL-2/STAT5 activation in cytokine-pulsed T cells. Gates in (C) and (D) define the CD3+, pSTAT3+ and CD3+, pSTAT5Bright T cells, respectively. (E, G) Geometric MFI ratio of STAT3 or -5 phosphorylation and (F, H) percentage of STAT3 or bright STAT5 phosphorylation in DMSO- or S3I-201-treated T cells pulsed with IL-6 or -2, respectively, ± sd from 4 independent experiments. The geometric MFI ratio was calculated by dividing the geometric MFI of the cytokine-pulsed cells by the geometric MFI of the corresponding fluorochrome isotype.*P < 0.05, **P=0.001-0.01, paired t test.
To evaluate the effect of selective STAT3 or -5 blockade on STAT polarization after DC allosensitization alone, we added S3I-201 (50 or 100 μM), CAS 285986-31-4 (STAT5 inhibitor, 1 μM), or DMSO to the allo-MLRs once on day 0. No exogenous cytokine was added. DC-allosensitized T cells were harvested on day 5. STAT3 and -5 phosphorylation and geometric MFI ratios were determined by flow cytometry, as described earlier. The ratio of CD4+, pSTAT5Bright to CD4+, pSTAT3+ T cells was calculated by percentage of phosphorylation.
iTreg and Tconv expansion and staining
To evaluate iTreg development, we isolated naive CD4+ cells from nylon–wool-eluted T cells by magnetic-bead selection (Miltenyi Biotec), based on the positive expression of CD4 and lack of CD45RO, CD25, or both. In addition, we performed CD127 staining of the naive CD4+ cells after the purification, to ensure depletion of natural Tregs from the cell product. Negligible amounts of CD127−, CD25Bright nTregs were observed after magnetic-bead purification. The naive CD4+ T cells were DC allostimulated (DC:T cell ratio 1:30, 1×10⁵ T cells per 200 μl medium in a 96-well plate, 37°C) with S3I-201 (25–100 μM), CAS 285986-31-4 (1 μM), or DMSO added once on day 0. The T cells were harvested and surface stained on day 5 for CD3, -4, -25, and -127, followed by fixation and permeabilization (eBioscience), and then intracellular staining for Foxp3 [13, 14]. Tregs were characterized by gating on the live cells expressing surface CD3+, CD4+, and absence of CD127, followed by expression of Foxp3 and CD25bright [13, 14]. The absolute number of iTregs and Tconv (CD4+CD25−) cells was obtained by timed acquisition. The ratio of iTreg:Tconv was calculated based on the absolute number of each T-cell population.
iTreg suppression assay.
The suppressive potency of the STAT3 inhibitor–treated iTregs were compared with nTreg function in an allo-MLR. iTregs were generated by coculturing purified naive CD4+CD25− T cells with allogeneic moDCs, as described in the presence of S3I-201 (50 μM). On day 5, iTregs were selected by expression of CD3 and CD4; lack of CD127; and bright expression of CD25 by flow sorting. The purified iTregs were titrated against allo-MLRs consisting of 5 × 10⁴ responder CD4+CD25− T cells from the iTreg donor and 1.6 × 10³ HLA-disparate mature moDCs from the original stimulator donor. iTreg-to-responder CD4+CD25− T-cell ratios included 0:1, 1:27, 1:9, 1:3, 1:1, and 1:0, with iTregs alone and Tconvs alone as the controls. Sorted, untreated nTregs from the iTreg donors were titrated against allo-MLRs, by using identical methods. T-cell proliferation was determined by pulsing cells with 1 μCi/well 3H-thymidine for the last 18 h in culture and harvested on day 6. The limited number of iTregs from cocultures treated with S3I-201 (100 μM) or CAS 285986-31-4 (1 μM) prevented their inclusion in these suppression experiments.
iTreg Foxp3 demethylation assay.
The degree of Foxp3 demethylation among purified iTregs was measured to evaluate the stability of the iTreg populations in response to STAT3 (S3I-201 at 50 or 100 μM) or -5 (CAS 285986-31-4 at 1 μM) inhibition [15, 16]. The degree of Foxp3 TSDR demethylation among iTregs from DMSO-treated allo-MLRs, purified nTregs, and Tconvs served as the controls [17]. For these experiments, iTregs and nTregs were sorted to select the CD4+CD25+CD127− population. PCR products were amplified by using methylation or demethylation specific TSDR forward and reverse primers from bisulphate-treated genomic DNA of sorted natural Tregs. DNA fragments were cloned into a pCR2.1-Topo vector (Life Technologies, Grand Island, NY, USA) and verified by DNA sequencing. The following TSDR primers and probes were used for PCR: methylation forward 5′-GTTTTCGATTTGTTTAGATTTTTTCGTT-3′, reverse 5′-CCTCTTCTCTTCCTCCGTAATATCG-3′, and hydrolysis probe 5′-TAMRA-ATGGCGGTCGGATGCGTCGGGT-FAM-3′; and demethylation forward 5′-GTTTTTGATTTGTTTAGATTTTTTTGTT-3′, reverse 5′-CCTCTTCTCTTCCTCCATAATATCA-3′, and hydrolysis probe 5′-TAMRA-ATGGTGGTTGGATGTGTTGGGT-FAM-3′. Standards were diluted at concentrations ranging from 27 to 23 plasmid copies of each methylation or demethylation TSDR. Genomic DNA was isolated by using the DNeasy Blood and Tissue kit (Qiagen, Valencia, CA, USA) from sorted natural or expanded iTregs. Genomic DNA (200–500 ng) was treated with bisulfite from the EZ DNA Methylation-Gold Kit (Zymo Research, Irvine, CA, USA). After bisulfite conversion, qPCR was performed with TaqMan Universal PCR Master Mix No AmpErase UNG (Life Technologies) containing methylation or demethylation TSDR forward or reverse primers, methylation- or demethylation TSDR specific hydrolysis probe, and bisulfite-treated genomic DNA. PCR was performed with a 95°C preheating step for 10 min, and then 50 cycles at 95°C for 15 s, followed by 1 min at 61°C.
Evaluation of Th17 responses
To optimize the detection of IL-17A producing cells, nylon–wool-purified T cells underwent CD4+ magnetic-bead selection. The CD4+ T cells were cultured in triplicate with allogeneic, mature moDCs (DC:T cell ratio 1:30, 1×10⁶ T cells/1 ml medium in a 48-well plate, 37°C) and treated with S3I-201 (50 or 100 μM) or DMSO. The medium was supplemented with IL-6 (105 IU/ml), TGF-β (4 ng/ml), and anti-IFN-γ mAb (10 μg/ml) to support Th17 growth. The T cells were harvested and stimulated with PMA/ionomycin for 5 h, with GolgiStop Protein Transport Inhibitor (BD Biosciences) added after 1 h of activation. Th17s were identified by surface CD3 and CD4 expression, followed by intracellular staining for IL-17A. The absolute number of IL-17A-producing CD4+ T cells was obtained by timed acquisition.
The concentration of IL-17A was measured (anti-human IL-17A [homodimer] ELISA Ready-Set-Go; eBioscience) in the supernatant of identically prepared and drug-treated CD4+ T-cell allo-MLRs (DC:T cell ratio 1:30, 1.5×10⁵ T cells per 125 μl medium in a 96-well plate, 37°C). After 5 days, PMA/ionomycin was added directly to the cultures and stimulated for 5 h. GolgiStop was omitted from the PMA/ionomycin activation step, to permit detection of IL-17A in the culture supernatants. The supernatants were collected, and the IL-17A protein concentration was measured in triplicate, per the manufacturer's instructions.
Evaluation of CD8 CTL capacity
The naive CD8+ T cells were purified by live cell sorting (CD4− and CD45RO/CD25−) and were stimulated with allogeneic moDCs (DC:T cell ratio of 1:30), with S3I-201 (50 or 100 μM) or DMSO added once on day 0. On day 5, the allosensitized CD8 T cells were harvested and stimulated with PMA/ionomycin in the presence of Golgi Stop and anti-CD107a, followed by surface CD8 and intracellular IFN-γ staining.
Statistical Analysis
Statistical comparisons were determined with the paired, 2-tailed Student's t test (Prism software, ver. 5.04; GraphPad, San Diego, CA, USA). Statistical significance was defined by P < 0.05.
RESULTS
Specific STAT3 inhibition impaired DC-allosensitized T-cell proliferation
A dose titration of S3I-201-treated allo-MLRs showed a 50% reduction in T-cell proliferation at 50 μM and complete impairment at 100 μM, with little effect at 1 or 10 μM of the STAT3 inhibitor (Fig. 1A). Additional experiments confirmed that S3I-201 significantly reduced T-cell proliferation in allo-MLRs, compared with DMSO (Fig. 1B). T-cell viability was preserved at 50 μM of S3I-201, although viability staining showed toxicity at 100 μM, with the greatest effect observed among the Tconvs, rather than the iTregs (data not shown).
S3I-201 suppressed STAT3 phosphorylation while permitting IL-2/STAT5 signaling
To evaluate the selectivity of STAT inhibition by S3I-201, T cells were briefly pulsed with IL-6 or -2, to measure the degree of permitted STAT3 or -5 phosphorylation, respectively. S3I-201 inhibited IL-6-mediated STAT3 signaling at 50 and 100 μM in alloactivated T cells (Fig. 1C, E, F). Conversely, IL-2-induced STAT5 phosphorylation occurred in all treated T cells, as demonstrated by significant increases in STAT5 geometric MFI and bright STAT5 signaling compared with unstimulated baseline levels (Fig. 1D, G, H). The highest degree of STAT3 inhibition selectivity was achieved with 50 μM S3I-201. Off-target effects of S3I-201 were seen at 100 μM, given the decrease in IL-2/STAT5 phosphorylation by geometric MFI ratio (P>0.5) and percentage of phosphorylation (P<0.5), compared with the DMSO control (Fig. 1G, H).
STAT3 blockade polarized T cells toward STAT5 phosphorylation
S3I-201 maintained on-target suppression of STAT3 in 5 day allo-MLRs, where no exogenous cytokines were added (Fig. 2A, C). STAT5 activation was preserved in response to DC allostimuli, without a statistically significant decline in measurable phospho-protein (Fig. 2B, D). Specific attention was focused on the CD4+, pSTAT5Bright population, given that Tregs are known to express higher levels of STAT5 phosphorylation than Tconvs [7, 8]. This population was maintained among the S3I-201- and DMSO-exposed alloresponders, although a trend in reduced STAT5 phosphorylation was observed at 100 μM of the STAT3 inhibitor (Fig. 2E). However, the S3I-201-treated conditions showed reduced STAT3 signaling in all cases and resulted in a robust, dose-dependent polarization of the ratio of CD4+, pSTAT5Bright to CD4+, pSTAT3+ T cells (Fig. 2F).
Figure 2. STAT3 inhibition with S3I-201 polarized STAT5 phosphorylation in allostimulated CD4+ T cells.

(A, B) Representative contour plots show gating strategy and histograms demonstrate reduced STAT3 phosphorylation in CD4+ alloresponders, with preservation of STAT5 activity, in 5 day allogeneic cocultures (DC:T cell ratio 1:30) treated with S3I-201 vs. DMSO without the addition of any exogenous cytokine. (A, B) Gates define the CD4+, pSTAT3+ and CD4+, pSTAT5Bright T cells, respectively. (C, D) The mean ± sd of results in 3 independent experiments of STAT3 and -5 phosphorylation by geometric MFI ratio. (E) the frequency of CD4+, pSTAT5Bright T cells, and (F) the CD4+, pSTAT5Bright:pSTAT3+ ratio by percentage of phosphorylation, in CD4+ T cells harvested from S3I-201- or DMSO-treated 5 day allogeneic cocultures. *P < 0.05, **P=0.001–0.01, ***P = 0.0001–0.001, NS, by paired t test.
CAS 285986-31-4 (a STAT5 inhibitor, 1 μM) was used to further evaluate the influence of STAT5 phosphorylation on alloreactivity. Partial blockade of STAT5 was chosen to shift STAT phosphorylation and avoid the broad effects of complete IL-2 deprivation among the alloresponders [18]. The dose of CAS 285986-31-4 was titrated by T-cell proliferation in treated allo-MLRs. A concentration of 1 μM achieved maximum allostimulated T-cell growth, with no toxic effects by viability staining (Fig. 3A). While 1 μM of CAS 285986-31-4 did not affect the overall geometric MFI of CD4+ STAT5 phosphorylation (Fig. 3C, E), this dose selectively impaired the CD4+, pSTAT5Bright population (Fig. 3C, F) and maintained intact STAT3 signaling (Fig. 3B, D). This significantly decreased the ratio of CD4+, pSTAT5Bright to CD4+, pSTAT3+ T cells (Fig. 3G).
Figure 3. Inhibition of bright STAT5 phosphorylation among CD4+ alloresponders.

(A) Dose response of CAS 285986-31-4 (STAT5 inhibitor, 0–100 μM) in human allo-MLRs (DC:T cell ratio 1:30) treated once on day 0 with drug or DMSO diluent control. T-cell proliferation was determined by a colorimetric assay on day 4. The stimulation index was calculated by dividing the OD of the allo-MLR by the OD of T cells alone. (B, C) Representative histograms (using an identical gating strategy as in Fig. 2A) demonstrate the on-target selectivity of CAS 285986-31-4, impairing bright STAT5 activity, yet preserving STAT3 phosphorylation in 5 day allostimulated T cells. (B, C) Gates in the histograms define the (B) CD4+, pSTAT3+ and (C) CD4+, pSTAT5Bright T cells. Graph data are the mean ± sd of results in 3 independent experiments. (D) STAT3 and (E) -5 phosphorylation by geometric MFI ratio, (F) the frequency of CD4+, pSTAT5Bright T cells, and (G) the CD4+, pSTAT5Bright:pSTAT3+ ratio by percentage of phosphorylation in CD4+ T cells harvested from CAS 285986-31-4- or DMSO-treated 5 day allogeneic cocultures. *P < 0.05, paired t test.
STAT3 blockade significantly expanded allostimulated iTregs
Based on the observation that STAT3 inhibition polarized STAT5 signaling in CD4+ alloresponders, we went on to investigate the effects of S3I-201 on Foxp3 expression and iTreg expansion. Use of purified, naive CD4+ T cells devoid of contaminating nTregs showed that STAT3 inhibition significantly increased the absolute number of iTregs in a dose-dependent manner at 25 μM and 50 μM of S3I-201 (Fig. 4A–C). Moreover, the number of competing alloreactive Tconvs was dramatically reduced, resulting in an increased ratio of iTregs to Tconvs (Fig. 4D). While 100 μM of S3I-201 significantly reduced the number of iTregs compared with DMSO, the effect on the Tconvs was greater, suggesting a lower susceptibility threshold of STAT3 deprivation among the Tconvs (data not shown). Conversely, STAT5 inhibition with CAS 285986-31-4 significantly decreased allostimulated iTreg expansion, paired with a significant reduction in the iTreg:Tconv ratio compared with DMSO or the STAT3 inhibitor-treated conditions (Fig. 4D).
Figure 4. STAT3 inhibition expanded potent allostimulated iTregs.

(A) Naive CD4+, CD45RO−/CD25− T cells were purified through magnetic bead selection and depleted of nTregs before allogeneic coculture. nTregs are shown as CD127−, CD25Bright gating on the CD4+ T cells before and after depletion. (B) Representative histogram demonstrates the degree of Foxp3 expression among CD4+, CD127−, CD25Bright T cells after allostimulation of naive CD4+ T cells with mature moDCs (DC:T cell ratio 1:30 for 5 days) treated with either S3I-201 (STAT3 inhibitor), CAS 285986-31-4 (STAT5 inhibitor), or DMSO-diluent control. (C) Expansion of iTregs vs. Tconvs in absolute number (triplicate mean ± sd) from 5 day allogeneic cocultures treated with S3I-201, CAS 285986-31-4, or DMSO. (D) The effects of STAT3 vs. -5 inhibition on the ratio (triplicate means ± sd) of iTregs to Tconvs, calculated according to absolute number of T cells. Results are from 1 representative experiment of 5. (E) The suppressive capacity of sorted iTregs expanded from STAT3-treated allogeneic cocultures vs. purified untreated nTregs was tested at different ratios to self CD4+CD25− responders stimulated by original allogeneic moDCs (DC:T cell ratio 1:30). Graphs show the percentage of proliferation based on 3H-thymidine incorporation and triplicate means ± sd of counts per minute at day 6. (F) Triplicate means ± sd of percentage of demethylated Foxp3 among purified iTregs expanded in allogeneic cocultures treated with S3I-201, CAS 285986-31-4, or DMSO. Results shown are from 1 representative experiment of 2. *P < 0.05, paired t test.
STAT3-deprived iTregs displayed a potent suppressive function
iTregs expanded from STAT3 inhibitor–treated cocultures were titrated against Tconvs from the same donor in allo-MLRs (DC:T cell ratio 1:30) to evaluate iTreg suppression of DC-allostimulated T cells. Similarly, untreated nTregs from the same iTreg donors where titrated in parallel allo-MLRs. In all cases, no inhibitors or exogenous cytokines were added to the suppression assay allo-MLRs. After 6 days of culture, T-cell proliferation was measured. The STAT3-deprived iTregs demonstrated significant suppressive potency, compared with the nTregs at Treg:Tconv ratios of 1:9, 1:3, and 1:1 (Fig. 4E).
STAT3 inhibition facilitated Foxp3 demethylation among expanded iTregs
iTreg phenotype stability and suppressive function is linked to the degree of Foxp3 demethylation. iTreg reverting to a Tconv-like state may still express Foxp3; however, in such cases, Foxp3 becomes highly methylated [15, 16]. We quantified the degree of Foxp3 demethylation among the iTregs expanded from S3I-201-, CAS 285986-31-4-, and DMSO-treated cocultures. STAT3 inhibition with 50 or 100 μM of S3I-201 significantly enhanced the amount of iTreg Foxp3 demethylation, compared with DMSO-treated iTregs (Fig. 4F). Moreover, STAT5 inhibition with 1 μM of CAS 285986-31-4 rendered a significant reduction in Foxp3 demethylation (Fig. 4F).
STAT3 inhibition suppressed Th17
STAT3 blockade impaired Th17 responses, as demonstrated by a significant reduction in both the frequency and absolute numbers of CD4+, IL-17A+ T cells, compared with DMSO (Fig. 5A–C). Given that Th17 cells represent a small fraction of alloresponders, our findings were further strengthened by a significant decrease in IL-17A protein concentration within the supernatants of cocultures treated with S3I-201 (Fig. 5D). In these experiments, 1 × 10⁶ CD4+ T cells (as opposed to 1×10⁵) were cultured with moDCs at a DC:T-cell ratio of 1:30, to optimize the final Th17 yield.
Figure 5. STAT3 inhibition suppressed Th17 responses.

(A) Contour plots show a reduction in the CD4+, IL-17A+ population among allostimulated T cells (DC:CD4+ T cell ratio 1:30) in 5 day cocultures treated with S3I-201, compared with DMSO. (B, C) Effects of STAT3 inhibition on the percentage and absolute number of allostimulated CD4+, IL-17A+ T cells as triplicate means ± sd from 3 independent experiments. (D) Reduction in IL-17A protein concentration (triplicate means ± sd from 3 independent experiments) from the supernatants of 5 day allogeneic cocultures treated with S3I-201 or DMSO control. *P < 0.05, paired t test.
STAT3 inhibition preserved CTL capacity
Maintenance of CTL function is critical for the beneficial antimalignancy immune properties of the allograft [19, 20]. Allostimulated CD8+ effectors from cocultures treated with S3I-201 demonstrated intact cytolytic potential by way of CD107a expression [21] and intracellular IFN-γ production (Fig. 6). The CTL potential among S3I-201-treated CD8+ T cells was not significantly different from that of the DMSO control.
Figure 6. STAT3 inhibition preserved CTL capacity.
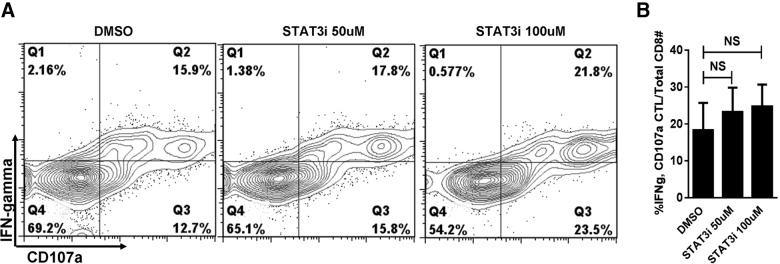
(A) Contour plots and (B) bar graph shows preserved CD8 CTL capacity by CD107a and IFN-γ expression, in S3I-201- or DMSO-treated allo-MLRs. Allogeneic cocultures (DC:CD8+ T cell ratio 1:30) were analyzed on day 5. Graph data are the mean ± sd from 3 independent experiments. NS, paired t test.
DISCUSSION
In this study, human alloresponder T cells were susceptible to selective STAT3 inhibition. This approach impaired allostimulated T-cell proliferation, while promoting STAT5-mediated iTreg growth and function. Allostimulated iTregs were most efficiently expanded when treated with 50 μM of S3I-201, paired with a decrease in Tconvs and a positive shift in the iTreg:Tconv ratio. These iTregs not only had intact suppressive capacity, but they displayed greater potency than the nTregs. Moreover, the expressed Foxp3 among the STAT3 inhibitor–exposed iTreg demonstrated a significantly increased amount of demethylation. This finding indicates a higher degree of Foxp3 expression stability and functional capacity among these expanded iTregs. Of interest, the dose-dependent increase in the ratio of CD4+, pSTAT5Bright to CD4+, pSTAT3+ T cells appeared to share a similarly positive trend with the iTreg:Tconv ratio in response to the STAT3 inhibitor. This result is in keeping with data from other studies demonstrating that Tregs brightly express STAT5 phosphorylation [7, 8], whereas allosensitized Tconvs express increased levels of STAT3 activation [9].
Conversely, partial STAT5 inhibition with 1 μM of CAS 285986-31-4 dramatically impaired iTreg expansion. Moreover, STAT3 phosphorylation was enabled at this concentration and Tconv expansion was maintained. Although Foxp3-expressing iTregs were still detectable in cultures treated with CAS 285986-31-4, the degree of Foxp3 demethylation was severely decreased and was rendered susceptible to potential instability. These opposing effects induced by STAT5 inhibition strengthen the importance of balance between STAT5 and -3 phosphorylation with respect to human iTreg alloresponses.
In this setting, iTregs differentiated and expanded when challenged with DC-allostimuli, and this effect was significantly enhanced by blocking STAT3 during culture. This result identifies a potential distinction between human and murine allostimulated iTreg growth. In murine GVHD models, where MHC-disparate recipients receive donor marrow accompanied by unmodified, naive T cells, iTregs show negligible development [6]. Conversely, iTregs are detected only when the mice receive allogeneic STAT3 knockout, naive T cells [6].
Selective STAT3 inhibition by S3I-201 was confirmed, with potent suppression of IL-6/STAT3 signaling in the treated T cells. STAT5 phosphorylation occurred in response to stimulation with IL-2 as well, with the greatest degree of STAT3 inhibition selectivity achieved at 50 μM of S3I-201. We observed an off-target reduction in IL-2-mediated STAT5 phosphorylation at 100 μM of S3I-201, the concentration at which iTreg expansion was impaired. We noted that the responding Tconvs were more extensively affected by S3I-201 at 100 μM and correspondingly increased the ratio of iTregs to Tconvs (data not shown). Although Tconvs may be more susceptible to STAT3 deprivation, this observation may be confounded by off-target effects of S3I-201 at high concentrations.
In a human system of alloreactivity, we verify that STAT3 inhibition abrogates Th17 responses when added to cocultures supplemented with IL-6, TGF-β, and IFN-γ mAb. In prior work, neutralization of IL-6 with tocilizumab was an insufficient means of reducing Th17 responses or enhancing opposing Treg development [22]. Selective JAK2 inhibition, however, successfully achieved a reduction in Th17 cells, while preserving rather than increasing Treg populations [11]. We have now clearly shown that downstream STAT3 inhibition is sufficient to both reduce Th17 and alternatively optimize iTreg expansion. As such, this approach directly targets unwanted Th17-dependent STAT3 signaling, while facilitating Treg-dependent STAT5 activity and Foxp3 demethylation.
The preservation of human CD8+ CTL capacity provides mechanistic evidence that STAT3 blockade permits effector function through intact IL-2/STAT5 signaling pathways. In all CTL experiments, CD107a expression was linked to concurrent intracellular expression of IFN-γ within the CD8+ alloresponders. Although STAT3 inhibition reduced overall T-cell proliferation in allo-MLRs, the cytolytic potential was unhindered by S3I-201. As such, CD8+ CTL capacity remained intact despite STAT3 blockade with S3I-201, where similar amounts of CD107a and IFN-γ expression were observed compared with that found with DMSO control.
STAT3 inhibition with agents such as S3I-201 may offer enhanced fidelity in controlling alloreactivity, compared with upstream JAK2 or relevant cytokine receptor blockade [11, 22], given that STAT3 phosphorylation is not exclusive to JAK2 activation alone. Moreover, the current data identified the plasticity of the STAT5:STAT3 dynamics as a critical mediator and target of human alloreactivity. The approach proposed here is highly translatable and reveals the potential implications of incorporating selective STAT3 inhibition in the prevention and management of GVHD.
ACKNOWLEDGMENTS
This work was supported in part by grants R01CA132197(C.A.), R01CA118116 (X.Y.), R01CA143812 (X.Y.), and R01CA169116(X.Y.) from the U.S. National Institutes of Health and by an ASBMT/Bristol-Myers Squibb New Investigator Award (B.C.B).
SEE CORRESPONDING EDITORIAL ON PAGE 197
- allo-MLR
- allogeneic mixed leukocyte reaction
- DC
- dendritic cell
- GVHD
- graft-versus-host disease
- HCT
- hematopoietic stem cell transplantation
- iTreg
- induced Treg
- MFI
- mean fluorescence intensity
- moDC
- monocyte-derived dendritic cell
- nTreg
- natural Treg
- OD
- optic density
- STAT3i
- STAT3 inhibitor
- STAT5i
- STAT5 inhibitor
- Tconv
- conventional T cells
- Treg
- regulatory T-cell
- TSDR
- Treg-specific demethylated region
AUTHORSHIP
B.C.B. designed the overall study, performed experiments, analyzed/interpreted data, and wrote the manuscript. A.V. performed experiments, analyzed/interpreted data and edited the manuscript. J.P. and X.Z.Y. assisted with interpretation of data and edited the manuscript. C.A. supervised performance of the experiments, supervised the analysis/interpretation of data, and edited the manuscript.
REFERENCES
- 1. Antin J. H., Ferrara J. L. (1992) Cytokine dysregulation and acute graft-versus-host disease. Blood 80, 2964–2968 [PubMed] [Google Scholar]
- 2. Littman D. R., Rudensky A. Y. (2010) Th17 and regulatory T cells in mediating and restraining inflammation. Cell 140, 845–858 [DOI] [PubMed] [Google Scholar]
- 3. Carlson M. J., West M. L., Coghill J. M., Panoskaltsis-Mortari A., Blazar B. R., Serody J. S. (2009) In vitro-differentiated TH17 cells mediate lethal acute graft-versus-host disease with severe cutaneous and pulmonary pathologic manifestations. Blood 113, 1365–1374 [DOI] [PMC free article] [PubMed] [Google Scholar]
- 4. Yu Y., Wang D., Liu C., Kaosaard K., Semple K., Anasetti C., Yu X. Z. (2011) Prevention of GVHD while sparing GVL effect by targeting Th1 and Th17 transcription factor T-bet and RORγt in mice. Blood 118, 5011–5020 [DOI] [PMC free article] [PubMed] [Google Scholar]
- 5. Laurence A., Tato C. M., Davidson T. S., Kanno Y., Chen Z., Yao Z., Blank R. B., Meylan F., Siegel R., Hennighausen L., Shevach E. M., O'Shea J, J. (2007) Interleukin-2 signaling via STAT5 constrains T helper 17 cell generation. Immunity 26, 371–381 [DOI] [PubMed] [Google Scholar]
- 6. Laurence A., Amarnath S., Mariotti J., Kim Y. C., Foley J., Eckhaus M., O'Shea J. J., Fowler D. H. (2012) STAT3 transcription factor promotes instability of nTreg cells and limits generation of iTreg cells during acute murine graft-versus-host disease. Immunity 37, 209–222 [DOI] [PMC free article] [PubMed] [Google Scholar]
- 7. Zeiser R., Leveson-Gower D. B., Zambricki E. A., Kambham N., Beilhack A., Loh J., Hou J. Z., Negrin R. S. (2008) Differential impact of mammalian target of rapamycin inhibition on CD4+CD25+Foxp3+ regulatory T cells compared with conventional CD4+ T cells. Blood 111, 453–462 [DOI] [PMC free article] [PubMed] [Google Scholar]
- 8. Matsuoka K., Koreth J., Kim H. T., Bascug G., McDonough S., Kawano Y., Murase K., Cutler C., Ho V. T., Alyea E. P., Armand P., Blazar B. R., Antin J. H., Soiffer R. J., Ritz J. (2013) Low-dose interleukin-2 therapy restores regulatory T cell homeostasis in patients with chronic graft-versus-host disease. Sci. Transl. Med. 5, 179ra43. [DOI] [PMC free article] [PubMed] [Google Scholar]
- 9. Lu S. X., Alpdogan O., Lin J., Balderas R., Campos-Gonzalez R., Wang X., Gao G. J., Suh D., King C., Chow M., Smith O. M., Hubbard V. M., Bautista J. L., Cabrera-Perez J., Zakrzewski J. L., Kochman A. A., Chow A., Altan-Bonnet G., van den Brink M. R. (2008) STAT-3 and ERK 1/2 phosphorylation are critical for T-cell alloactivation and graft-versus-host disease. Blood 112, 5254–5258 [DOI] [PMC free article] [PubMed] [Google Scholar]
- 10. Radojcic V., Pletneva M. A., Yen H. R., Ivcevic S., Panoskaltsis-Mortari A., Gilliam A. C., Drake C. G., Blazar B. R., Luznik L. (2010) STAT3 signaling in CD4+ T cells is critical for the pathogenesis of chronic sclerodermatous graft-versus-host disease in a murine model. J. Immunol. 184, 764–774 [DOI] [PMC free article] [PubMed] [Google Scholar]
- 11. Betts B. C., Abdel-Wahab O., Curran S. A., St Angelo E. T., Koppikar P., Heller G., Levine R. L., Young J. W. (2011) Janus kinase-2 inhibition induces durable tolerance to alloantigen by human dendritic cell-stimulated T cells yet preserves immunity to recall antigen. Blood 118, 5330–5339 [DOI] [PMC free article] [PubMed] [Google Scholar]
- 12. Siddiquee K., Zhang S., Guida W. C., Blaskovich M. A., Greedy B., Lawrence H. R., Yip M. L., Jove R., McLaughlin M. M., Lawrence N. J., Sebti S. M., Turkson J. (2007) Selective chemical probe inhibitor of Stat3, identified through structure-based virtual screening, induces antitumor activity. Proc. Natl. Acad. Sci. U. S. A. 104, 7391–7396 [DOI] [PMC free article] [PubMed] [Google Scholar]
- 13. Liu W., Putnam A. L., Xu-Yu Z., Szot G. L., Lee M. R., Zhu S., Gottlieb P. A., Kapranov P., Gingeras T. R., Fazekas de St Groth B., Clayberger C., Soper D. M., Ziegler S. F., Bluestone J. A. (2006) CD127 expression inversely correlates with FoxP3 and suppressive function of human CD4+ T reg cells. J. Exp. Med. 203, 1701–1711 [DOI] [PMC free article] [PubMed] [Google Scholar]
- 14. Seddiki N., Santner-Nanan B., Martinson J., Zaunders J., Sasson S., Landay A., Solomon M., Selby W., Alexander S. I., Nanan R., Kelleher A., Fazekas de St Groth B. (2006) Expression of interleukin (IL)-2 and IL-7 receptors discriminates between human regulatory and activated T cells. J. Exp. Med. 203, 1693–1700 [DOI] [PMC free article] [PubMed] [Google Scholar]
- 15. Toker A., Engelbert D., Garg G., Polansky J. K., Floess S., Miyao T., Baron U., Duber S., Geffers R., Giehr P., Schallenberg S., Kretschmer K., Olek S., Walter J., Weiss S., Hori S., Hamann A., Huehn J. (2013) Active demethylation of the Foxp3 locus leads to the generation of stable regulatory T cells within the thymus. J. Immunol. 190, 3180–3188 [DOI] [PubMed] [Google Scholar]
- 16. Miyao T., Floess S., Setoguchi R., Luche H., Fehling H. J., Waldmann H., Huehn J., Hori S. (2012) Plasticity of Foxp3(+) T cells reflects promiscuous Foxp3 expression in conventional T cells but not reprogramming of regulatory T cells. Immunity 36, 262–275 [DOI] [PubMed] [Google Scholar]
- 17. Veerapathran A., Pidala J., Beato F., Betts B. C., Kim J., Turner J. G., Hellerstein M. K., Yu X., Janssen W., Anasetti C. (2013) Human regulatory T cells against minor histocompatibility antigens: ex vivo expansion for prevention of graft-versus-host disease. Blood 10.1182/blood-2013-03-492397 [Epub ahead of print] [DOI] [PMC free article] [PubMed] [Google Scholar]
- 18. Lin J. X., Li P., Liu D., Jin H. T., He J., Ata Ur Rasheed M., Rochman Y., Wang L., Cui K., Liu C., Kelsall B. L., Ahmed R., Leonard W. J. (2012) Critical role of STAT5 transcription factor tetramerization for cytokine responses and normal immune function. Immunity 36, 586–599 [DOI] [PMC free article] [PubMed] [Google Scholar]
- 19. Warren E. H., Greenberg P. D., Riddell S. R. (1998) Cytotoxic T-lymphocyte-defined human minor histocompatibility antigens with a restricted tissue distribution. Blood 91, 2197–2207 [PubMed] [Google Scholar]
- 20. Faber L. M., van Luxemburg-Heijs S. A., Willemze R., Falkenburg J. H. (1992) Generation of leukemia-reactive cytotoxic T lymphocyte clones from the HLA-identical bone marrow donor of a patient with leukemia. J. Exp. Med. 176, 1283–1289 [DOI] [PMC free article] [PubMed] [Google Scholar]
- 21. Rubio V., Stuge T. B., Singh N., Betts M. R., Weber J. S., Roederer M., Lee P. P. (2003) Ex vivo identification, isolation and analysis of tumor-cytolytic T cells. Nat. Med. 9, 1377–1382 [DOI] [PubMed] [Google Scholar]
- 22. Betts B. C., St Angelo E. T., Kennedy M., Young J. W. (2011) Anti-IL6-receptor-alpha (tocilizumab) does not inhibit human monocyte-derived dendritic cell maturation or alloreactive T-cell responses. Blood 118, 5340–5343 [DOI] [PMC free article] [PubMed] [Google Scholar]