Abstract
Background
The incidence of pancreatic neuroendocrine tumors (PNETs) is increasing but only a subset of these heterogeneous tumors will progress to malignant disease which is associated with a poor prognosis. Currently, there is limited data on the natural history of these tumors and it is difficult to determine which patients require surgical intervention because the risk of metastatic disease cannot be accurately determined.
Study Design
We conducted a prospective study of 87 patients with von Hippel Lindau syndrome-associate solid pancreatic lesions to determine the natural history of these tumors with biochemical testing, follow up anatomic and functional imaging, and advanced imaging analysis with a median follow up of 4 years.
Results
Approximately 20% of consecutive tumor measurements during follow up were decreased in size and 20% showed no change. This included 2 of 4 surgically-proven malignant tumors which had a net decrease in tumor size over time. Tumor volume, as derived from greatest diameter and volumetric measurement, showed good correlation to pathology tumor measurement of surgically resected tumors (Spearman rank correlation ρ=0.72, p=0.0011, and ρ=0.83, p<0.0001; respectively). Tumor density measurement had an inverse relationship with tumor size (Spearman rank correlation −0.22, p=0.0047). A tumor density cutoff of 200 was 75% specific for malignant tumors.
Conclusions
PNETs demonstrate a non-linear growth pattern, which includes periods of no growth and apparent decrease in size by imaging. These growth patterns are variable and not associated with tumor grade and malignancy. Tumor density, as measured in this cohort, may offer a specific diagnostic tool for malignant disease.
Keywords: Pancreatic Neuroendocrine Tumor, von Hippel Lindau Syndrome, Growth Rate, Tumor Density, Volumetric Growth Analysis, Neoplasm
Introduction
Pancreatic neuroendocrine tumors (PNETs) are a heterogeneous group of rare tumors, with a low but increasing incidence, accounting for 1.3% of all pancreatic tumors.1–5 PNETs may be functional, manifesting in one of several characteristic clinical syndromes, or non-functional.2–5 They may be sporadic, or occur within the context of multiple endocrine neoplasia type 1, von Hippel Lindau (VHL) syndrome, neurofibromatosis type I or carcinoid syndrome.2–5 PNETs display a variety of histologic characteristics, presenting as a spectrum of well- to poorly- differentiated neuroendocrine cells, with only a subset progressing to malignant disease.2–5
There is limited prospective data on the optimal management of localized PNETs. Benign tumors do not threaten patient survival, and may not require surgical resection if symptoms associated with hormonal hypersecretion are medically controlled, excluding insulinomas.6,7 Malignant tumors, on the other hand, exhibit a poor prognosis.6–8 Survival rates average 1–3 years once metastases are identified.1 Early surgical intervention offers the best potential for curative therapy or the prevention of metastatic disease but is not without morbidity.6,7,9
Unfortunately, it is difficult to distinguish benign tumors from those which are potentially malignant without histopathologic analysis, with a significant number of tumors still of undetermined malignant potential based on the World Health Organization (WHO) classification.10 Chromogranin A (CgA) and pancreatic polypeptide (PPP) are often used as serum tumor markers for PNETs once disease has been surgically confirmed; however, they provide little pre-operative prognostic information.5,8 Radiographic evidence of advanced disease, such as local tumor invasion or evidence of metastasis, are currently the only reliable clinical predictors of malignancy. However, these findings provide little benefit to the patient, as curative resection may not be possible at that point. Previous studies have suggested tumor size and/or growth rate as useful indicators of malignancy.11 However, recent studies have shown that even small tumors (≤2 cm) may have aggressive behavior.5,12,13
Patients with vHL syndrome have an approximate 20% risk of developing one or more PNETs over their lifetime. As such, they undergo routine lifetime screening and surveillance to allow for early intervention for PNETs, which have malignant potential.14 Computed tomography (CT) is the most commonly used imaging modality for screening and surveillance, due to its high sensitivity (~94%) for identifying PNETs.15–18 Fortunately, PNETs are easily identifiable, with characteristic radiographic features, appearing as an early enhancing well-circumscribed solid mass with rounded or lobulated borders and a rich vascular supply, and characteristic hyperintensity on arterial phase of CT scan.17,19 The aim of this study was to review a prospectively maintained database and identify PNETs that develop in patients within the context of VHL and follow their natural course of disease progression in hopes of identifying a means to distinguish patients who are more appropriate for active surveillance compared to those who may benefit from early surgical intervention for tumors with high malignant potential.
Methods
As part of a prospective clinical protocol approved by the National Cancer Institute’s Institutional Review Board, 134 patients with pancreatic manifestations of VHL were enrolled and underwent comprehensive biochemical testing and anatomic and functional imaging studies annually at the National Institutes of Health (NIH) Clinical Center.
Radiographic Imaging/Volume & Density Assessment
As part of our clinical research protocol, we perform a routine pancreatic protocol (2mm slices) abdominal computed tomography (CT) and magnetic resonance imaging, both with contrast (both protocols inject contrast at 3cc/second, with arterial phase typically 10–20 seconds after injection). These are performed annually in patients with solid pancreatic lesions and every 2 years in those with complex or cystic pancreatic lesions. These defined intervals comprised the majority of all collected data points and the measurements from CT scan were used to determine growth rate. If patients presented with concerning symptoms warranting further CT imaging between specified surveillance intervals, these studies were also included at 4 to 6 month intervals. Four of the 134 patients enrolled in the study had their CT scan repeated within 6 months.
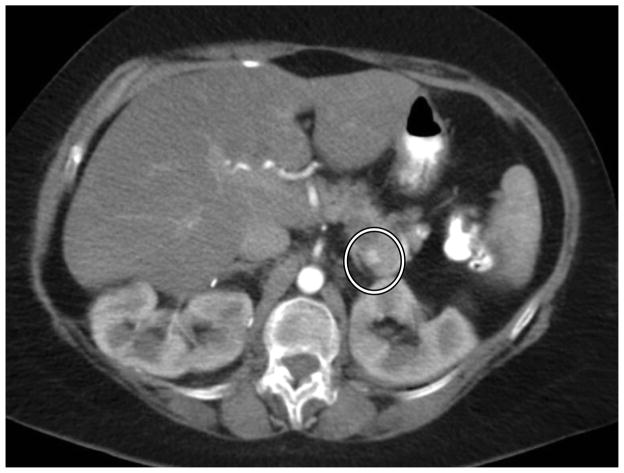
Each imaging study was assessed by at least two independent reviewers (three independent reviewers for the first 107 patients enrolled) who catalogued all solid radiographic lesions of the pancreas that displayed hyperintense signal during early arterial phase (Figure 1). Size and location were recorded for each lesion. Key images were stored for each tumor to provide a reference baseline image for consistent analysis. For each lesion, the largest diameter of each tumor was recorded by each reviewer, and then averaged to provide a consensus measurement. Volume measurements were derived using the equation volume = diameter3.
Figure 1.
Solid pancreatic lesion on CT scan. A solid radiographic lesion is identified by independent reviewers, whose averaged measurements are the basis for 2-dimensional volume estimations.
In addition, a software-based measurement for volume and density was calculated for each lesion identified on CT scan (Figure 2). Using the stored key images provided by our independent reviewers, each tumor was centrally labeled within a computer workstation. Syngo.via for oncology (Siemens Health Care Corporation) was used to collect software-calculated measurements of volume and density for each identified pancreatic lesion.
Figure 2.
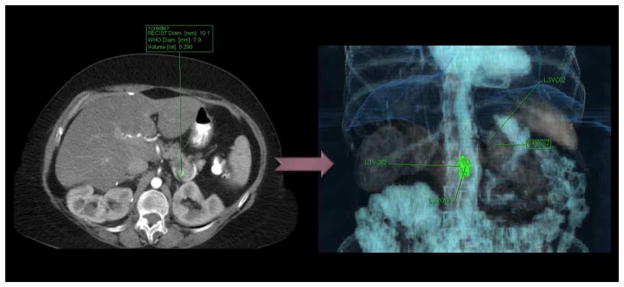
Software-derived tumor volumes. Each tumor is labeled, and then the software delineates tumor margins from surrounding densities to derive volume measurements.
Tumor measurements were used for comparison against different laboratory and radiographic data obtained within a 6 month time frame. Tumor greatest diameter was compared to serum chromogranin A (CgA) and pancreatic polypeptide (PP) values.
Patient Population
Of 134 patients in our study, 30 were excluded from the sample population after all three reviewers independently found no evidence of a solid pancreatic tumor - a lesion that in this population is most consistent with a neuroendocrine tumor. An additional 17 patients were excluded for having only a single imaging record, therefore not providing enough data to measure tumor growth. This resulted in a cohort of 87 patients. Twenty-one patients in our cohort had a total of 26 lesions surgically resected, a subset of the population for which histopathology data was available and which were classified according to the WHO tumor grade classification system. Malignancy was defined as the presence of metastasis to lymph nodes or distant sites (liver) proven on histologic examination. The WHO grading system was used in all the primary tumors removed. Patients followed within our study cohort received only surgical intervention over the study time period for management of their disease. None were treated with systemic therapy including octreotide.
Statistical Analysis
All statistical analyses were completed through collaboration with biostatisticians in the Biostatistics and Data Management Section of the National Cancer Institute. Tumor measurements were used for comparison against different laboratory and radiographic data obtained within a 6 month interval. For descriptive information, data was calculated as a mean with standard deviation. Because standard deviations are expected to increase as the mean increases, a coefficient of variation was calculated as the standard deviation divided by the mean, and then expressed as a percentage. Tumor sizes (linear and volume measurements) were compared using the Spearman rank correlation test. The Spearman rank correlation test was also used for growth rate comparisons and for associations with pathology tumor measurements. Repeated measures analysis of variance was used to adjust for correlation between the multiple tumors of some patients in tests of serum CgA, PPP and 18F-FDOPA PET SUVs. For analyses of tumor growth measurements, tumor sizes were log-transformed prior to analysis. Growth distributions at 3 month intervals were estimated by linear interpolation of measurements over observed intervals. The central tendency and the variation in growth rates across patients were tested using a Kruskal-Wallis and Ansari-Bradley tests. The Wilcoxon signed rank test was applied to changes in tumor density.
Results
A total of 163 tumors were followed within our cohort of 87 patients for a total of 377 growth intervals. Forty-one (47%) of the patients manifested a single tumor, with a median tumor burden of 2 for the entire cohort. Demographic, clinical and histopathology diagnoses for the study cohort are summarized in Table 1. During this time period, 29 new lesions were identified over an aggregate follow-up time period of 3,249 patient months, producing a new tumor incidence of 1 per 112 patient months.
Table 1.
Demographic and Clinical Characteristics of Study Cohort
| Age, y, mean ± SD | 47.6 ± 13.7 |
|
| |
| Male:female | 35:52 |
|
| |
| Race/ethnicity, n | |
| Caucasian | 79 |
| African American | 3 |
| Asian | 1 |
| Unknown | 4 |
|
| |
| Total no. radiographic solid enhancing lesions | 163 |
|
| |
| Median tumor burden per patient, n | 2 |
|
| |
| Surgically resected lesions, n | 26 |
|
| |
| Histopathologic diagnosis | MCA: 3 WHO Grade I: 5 WHO Grade II: 7 WHO Grade III: 8 Unspecified PNET: 3 |
MCA, microcystic serous cystadenoma
Tumor Growth & Accuracy of Volume Calculations
Inter-reader correlation in linear tumor measurements was high (correlation coefficients >0.86). The range of reader deviations from the mean for each lesion was −0.7 to 0.7, the median coefficient of variation was 9.4%, and no individual reader had deviations statistically different from a zero mean. The mean over readers was therefore an appropriate summary for each measurement.
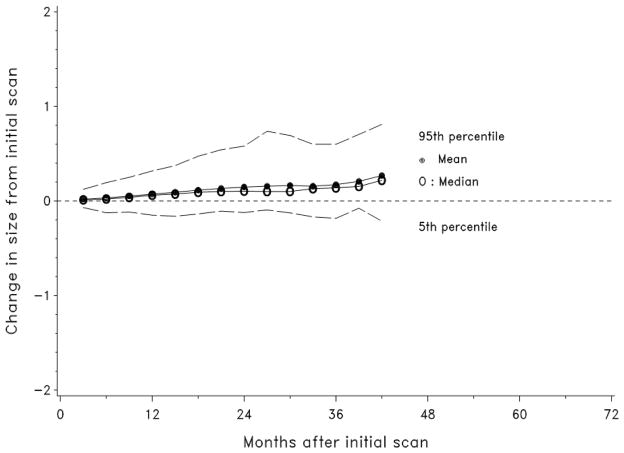
Tumor growth was followed for the entire cohort (Figure 3). Tumor growth patterns were non-linear. Approximately 20% of the differences between consecutive measurements were radiographic decreases in size and 20% were no change. Figure 4 shows growth for the mean, median, 5th and 95th percentile of tumors at 3 month intervals. Growth rate was independent from tumor size (correlation ρ= −0.08, p=0.11) (i.e. larger lesions did not tend to show a more rapid growth pattern). The growth rates in patients with multiple tumors showed no significant clustering or differences between means (Kruskal-Wallis test, p=0.45); however, some patients showed highly variable growth rates while others had more consistent tumor growth over time (p<0.0001).
Figure 3.
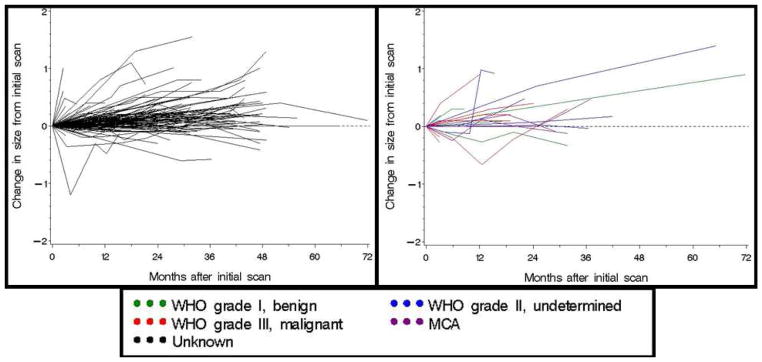
Observed changes in tumor size for 163 solid radiographic lesions in patients with von Hippel Lindau. The graph on the left displays growth patterns for all tumors in our cohort. The graph on the right displays the growth patterns for tumors with known histopathologic diagnoses.
Figure 4.
The mean, median, 5th and 95th percentiles of the observed growth of solid radiographic pancreatic lesions in patients with von Hippel Lindau are depicted over time.
The accuracy of tumor volume measurements was assessed for both 2-dimensional imaging and volumetric software calculations. The modalities showed strong correlation with each other in the measurements at the first tumor scan (correlation coefficient 0.80, p<0.0001). Additionally, both measurements showed a strong correlation with pathology measurements of resected tumors (volumetric software ρ=0.83, p<0.0001 and 2-dimensional imaging ρ=0.72, p=0.0011).
Tumor Density
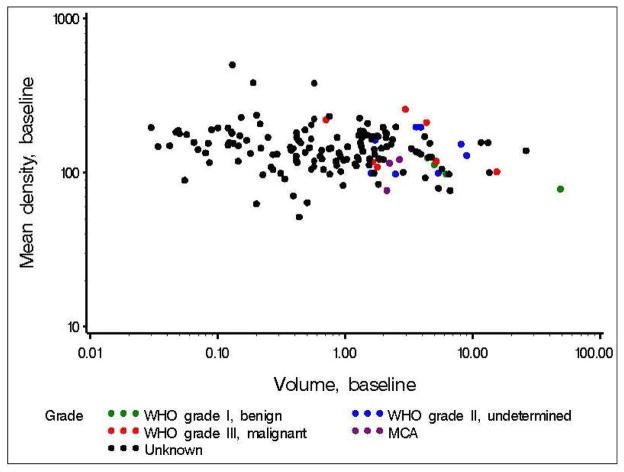
Overall, tumor density displayed a weak tendency to decrease with time (median changes<0 in three of four intervals, p=0.049 corrected for multiple comparisons), and was inversely related to baseline tumor volume (correlation −0.22, p=0.0047) (Figure 5). There was a trend towards decreasing mean density with increased tumor aggressiveness. Six of 7 malignant tumors decreased in density over time. Three of 7 malignant tumors had the greatest mean density for all tumors with a histopathologic diagnosis. The remaining 4 malignant tumors demonstrated densities below the median of the mean densities for all tumors evaluated by histology. This suggests that a high tumor density may be specific for malignant classification on histology. A tumor density of 200 was 75% specific for malignant classification (n=16).
Figure 5.
Relationship of tumor density and tumor volume.
Clinical Correlations
Growth rates were not significantly different by WHO tumor grade in tumors which were resected. Furthermore, no threshold in growth rate was observed to distinguish malignant tumors (patients who presented or developed metastasis during follow up) from benign and intermediate grades (localized tumors). Two lesions in the surgically-proven malignant subset had a net decrease in tumor size over time.
Tumor greatest diameter was compared to serum CgA and PP values. Serum CgA values demonstrated a statistical trend towards an inverse relationship with tumor size (p=0.053, n=137), whereas no association was seen between tumor size and serum PP levels (p=0.81, n=165).
Discussion
Our study shows that PNETs can demonstrate variable growth. Across all time periods in our cohort, 20% of consecutive measurements of tumors demonstrated no growth and an additional 20% were smaller by imaging. This observation was consistent across different patients and different tumors, with evidence that individual tumors may have periods of negative growth, no growth, indolent growth and aggressive growth over time.
To our knowledge, this is the first large cohort study to examine the variable natural history of PNETs with a relatively long follow up time. There have been reports of partial and complete spontaneous regression of malignant neuroendocrine tumors in the literature, including patients with metastatic disease.20–26 This has also been observed in other types of tumors. Lindell and associates observed the growth characteristics by CT scan of 48 histologically-proven lung cancers, finding periods of negative growth in 4 tumors.27 Korst, et al., identified a negative growth rate in 28% of 69 patients with pulmonary nodules <3cm, including 1 histologically proven lung cancer that showed negative growth over three consecutive intervals.28 Finally, Honda and colleagues identified negative doubling time in 5 of 40 pulmonary adenocarcinomas.29
Negative growth has been published in longitudinal studies on PNETs. Kann, et al., described the natural progression of 84 asymptomatic PNETs <15mm in size in 20 patients with multiple endocrine neoplasia type 1 (MEN-1). Endoscopic ultrasound (EUS) was used to measure greatest tumor diameter every six months for a maximum of 44 months. The findings were similar to ours, identifying periods of variable growth. This included tumors with alternating periods of positive and negative growth, as well as individual tumors that consistently grew smaller over time.30 None of the patients in the study by Kann and colleagues had surgical intervention to provide histopathologic confirmation of individual lesions; however, subsets of the PNETs were documented by pathology and had excellent tumor size and volume correlation to the surgically resected tumor.
It is uncertain what causes PNETs to decrease in size in our study cohort. This may be a fluctuation of a constant tumor mass, with change in density causing a reciprocal inverse change in tumor size (mass = volume x density). A weak but significant statistical relationship to this effect is seen in our population; however, does not account for multiple individual tumors. It may be suggested that measurement error plays an additional factor, with fluctuations in size caused by inter-reader variations. However, there was a strong correlation in measurement between independent measurements in the current study. Additionally, it is has been demonstrated that tumor size changes that meet a threshold of ≥1.73mm are reliably detected by CT scan images; a threshold which was surpassed by the shrinking tumors over multiple intervals.31 Therefore, even though a small factor of measurement error is likely present in any study, our data is suggestive of a real decrease in tumor size.
A separate radiographic variable, tumor density, had high specificity for malignant PNETs. Within our cohort, a tumor density of 200 on arterial phase images demonstrated a specificity of 75% for malignant classification as evidenced by the presence of metastasis on histology. While tumor density is a standard variable of measurement within the CT software package, we are not aware of previous publications that described its use as a marker of malignant disease. Further testing in a larger patient population is needed to see if CT tumor density provides useful information for surgical decision-making with adequate patient follow up time. We currently recommend surgical intervention in patients with VHL who have localized solid enhancing pancreatic lesion greater than 3 cm (> 2cm in the head) on CT scan or when there is suspicion of metastatic disease. Thus, the tumor density measurement may reduce the need for surgical intervention in low risk lesions, which accounted for 5 of the resected tumors (Table 1).
An interesting result of this study was that serum CgA showed a statistical trend towards an inverse relationship to tumor size. Neuroendocrine cells characteristically synthesize and secrete CgA, making it a helpful biomarker for neuroendocrine tumors for follow up.32,33 Serum CgA levels have been shown to correlate with tumor burden and are often used for patient surveillance.32,33 Our findings suggest that as the lesions in our cohort grew, an increasing percentage of the tumor volume may not produce CgA. A change may occur with tumor growth that either stops production or secretion of CgA. An alternative reason may be that as the lesion grows, there is a greater percentage of non-metabolically active tissue (i.e. necrosis or fibrosis).
There are several limitations to this study. First, technical error may provide inaccurate representation of tumor size. Even though a standardized CT protocol was used for all patients within our cohort, certain factors cannot be controlled including exact timing of contrast administration and identical level of CT images at each follow-up visit. These variations are generally understood and accepted under standard practice but may confound our results. Nonetheless, these variations may account for differences in tumor volume of 2–20%.34–37 An additional limitation is the equation used to derive tumor volume from tumor greatest diameter. Volume =diameter3 may not be the most appropriate mathematical description for each tumor, which likely takes an irregular rather than perfectly geometric shape. With these recognized pitfalls, it is reassuring that both the greatest diameter-derived volumes and the volumetric software-derived volumes showed high correlation to three-dimensional measurements documented on actual tumor samples volumetric software (Spearman rank correlation ρ=0.72, p=0.0011, and ρ=0.83, p<0.0001, respectively).
In summary, our study shows that PNETs can demonstrate variable growth on serial imaging. Tumor density may provide a specific indicator for malignancy in our cohort and should be validated in additional populations. Further study is warranted to establish the optimal means for measuring changes in tumor behavior that may necessitate surgical intervention.
Acknowledgments
Funding: This research was supported by the intramural research program of the Center for Cancer Research, National Cancer Institute, National Institutes of Health.
Footnotes
Disclosure Information: Nothing to disclose.
Conflict of Interest
The authors disclose no potential conflicts of interest.
Publisher's Disclaimer: This is a PDF file of an unedited manuscript that has been accepted for publication. As a service to our customers we are providing this early version of the manuscript. The manuscript will undergo copyediting, typesetting, and review of the resulting proof before it is published in its final citable form. Please note that during the production process errors may be discovered which could affect the content, and all legal disclaimers that apply to the journal pertain.
References
- 1.Yao JC, Eisner MP, Leary C, et al. Population-based study of islet cell carcinoma. Ann Surg Oncol. 2007;14:3492–3500. doi: 10.1245/s10434-007-9566-6. [DOI] [PMC free article] [PubMed] [Google Scholar]
- 2.Oberg K. Pancreatic endocrine tumors. Semin Oncol. 2010;37:594–618. doi: 10.1053/j.seminoncol.2010.10.014. [DOI] [PubMed] [Google Scholar]
- 3.Eriksson B, Oberg K. Neuroendocrine tumours of the pancreas. Br J Surg. 2000;87:129–131. doi: 10.1046/j.1365-2168.2000.01277.x. [DOI] [PubMed] [Google Scholar]
- 4.Oberg K, Eriksson B. Endocrine tumours of the pancreas. Best Pract Res Clin Gastroenterol. 2005;19:753–781. doi: 10.1016/j.bpg.2005.06.002. [DOI] [PubMed] [Google Scholar]
- 5.Kulke MH, Benson AB, 3rd, Bergsland E, et al. Neuroendocrine tumors. J Natl Compr Canc Netw. 2012;10:724–764. doi: 10.6004/jnccn.2012.0075. [DOI] [PubMed] [Google Scholar]
- 6.Jensen RT, Cadiot G, Brandi ML, et al. ENETS Consensus Guidelines for the management of patients with digestive neuroendocrine neoplasms: functional pancreatic endocrine tumor syndromes. Neuroendocrinology. 2012;95:98–119. doi: 10.1159/000335591. [DOI] [PMC free article] [PubMed] [Google Scholar]
- 7.Falconi M, Bartsch DK, Eriksson B, et al. ENETS Consensus Guidelines for the management of patients with digestive neuroendocrine neoplasms of the digestive system: well-differentiated pancreatic non-functioning tumors. Neuroendocrinology. 2012;95:120–134. doi: 10.1159/000335587. [DOI] [PubMed] [Google Scholar]
- 8.Halperin DM, Kulke MH. Management of pancreatic neuroendocrine tumors. Gastroenterol Clin North Am. 2012;41:119–131. doi: 10.1016/j.gtc.2011.12.003. [DOI] [PubMed] [Google Scholar]
- 9.Grant CS. Surgical management of malignant islet cell tumors. World J Surg. 1993;17:498–503. doi: 10.1007/BF01655109. [DOI] [PubMed] [Google Scholar]
- 10.Graziani R, Brandalise A, Bellotti M, et al. Imaging of neuroendocrine gastroenteropancreatic tumours. Radiol Med. 2010;115:1047–1064. doi: 10.1007/s11547-010-0540-1. [DOI] [PubMed] [Google Scholar]
- 11.Blansfield JA, Choyke L, Morita SY, et al. Clinical, genetic and radiographic analysis of 108 patients with von Hippel-Lindau disease (VHL) manifested by pancreatic neuroendocrine neoplasms (PNETs) Surgery. 2007;142:814–818. doi: 10.1016/j.surg.2007.09.012. discussion 818 e811–812. [DOI] [PMC free article] [PubMed] [Google Scholar]
- 12.Haynes AB, Deshpande V, Ingkakul T, et al. Implications of incidentally discovered, nonfunctioning pancreatic endocrine tumors: short-term and long-term patient outcomes. Arch Surg. 2011;146:534–538. doi: 10.1001/archsurg.2011.102. [DOI] [PMC free article] [PubMed] [Google Scholar]
- 13.Ferrone CR, Tang LH, Tomlinson J, et al. Determining prognosis in patients with pancreatic endocrine neoplasms: can the WHO classification system be simplified? J Clin Oncol. 2007;25:5609–5615. doi: 10.1200/JCO.2007.12.9809. [DOI] [PubMed] [Google Scholar]
- 14.Kim JJ, Rini BI, Hansel DE. Von Hippel Lindau syndrome. Adv Exp Med Biol. 2010;685:228–249. doi: 10.1007/978-1-4419-6448-9_22. [DOI] [PubMed] [Google Scholar]
- 15.Noone TC, Hosey J, Firat Z, Semelka RC. Imaging and localization of islet-cell tumours of the pancreas on CT and MRI. Best Pract Res Clin Endocrinol Metab. 2005;19:195–211. doi: 10.1016/j.beem.2004.11.013. [DOI] [PubMed] [Google Scholar]
- 16.O’Grady HL, Conlon KC. Pancreatic neuroendocrine tumours. Eur J Surg Oncol. 2008;34:324–332. doi: 10.1016/j.ejso.2007.07.209. [DOI] [PubMed] [Google Scholar]
- 17.Rockall AG, Reznek RH. Imaging of neuroendocrine tumours (CT/MR/US) Best Pract Res Clin Endocrinol Metab. 2007;21:43–68. doi: 10.1016/j.beem.2007.01.003. [DOI] [PubMed] [Google Scholar]
- 18.Kitano M, Millo C, Rahbari R, et al. Comparison of 6-18F-fluoro-L-DOPA, 18F-2-deoxy-D-glucose, CT, and MRI in patients with pancreatic neuroendocrine neoplasms with von Hippel-Lindau disease. Surgery. 2011;150:1122–1128. doi: 10.1016/j.surg.2011.09.048. [DOI] [PMC free article] [PubMed] [Google Scholar]
- 19.Rha SE, Jung SE, Lee KH, et al. CT and MR imaging findings of endocrine tumor of the pancreas according to WHO classification. Eur J Radiol. 2007;62:371–377. doi: 10.1016/j.ejrad.2007.02.036. [DOI] [PubMed] [Google Scholar]
- 20.Ip YT, Pong WM, Kao SS, Chan JK. Spontaneous complete regression of gastric large-cell neuroendocrine carcinoma: mediated by cytomegalovirus-induced cross-autoimmunity? Int J Surg Pathol. 2011;19:355–358. doi: 10.1177/1066896911404412. [DOI] [PubMed] [Google Scholar]
- 21.Wooff JC, Trites JR, Walsh NM, Bullock MJ. Complete spontaneous regression of metastatic merkel cell carcinoma: a case report and review of the literature. Am J Dermatopathol. 2010;32:614–617. doi: 10.1097/DAD.0b013e3181cd3158. [DOI] [PubMed] [Google Scholar]
- 22.Hassan SJ, Knox M, Griffin M, Kennedy MJ. Spontaneous regression of metastatic Merkel cell carcinoma. Ir Med J. 2010;103:21–22. [PubMed] [Google Scholar]
- 23.Kubo H, Matsushita S, Fukushige T, Kanzaki T, Kanekura T. Spontaneous regression of recurrent and metastatic Merkel cell carcinoma. J Dermatol. 2007;34:773–777. doi: 10.1111/j.1346-8138.2007.00382.x. [DOI] [PubMed] [Google Scholar]
- 24.Agard C, Guerzider P, Bouillard J, et al. A metastatic neuroendocrine tumor with exceptional outcome! Rev Med Interne. 1998;19:438–441. doi: 10.1016/s0248-8663(98)80870-9. [DOI] [PubMed] [Google Scholar]
- 25.Christ F, Siewert B, Koch O. Spontaneous regression of liver metastases in neuroendocrine tumors of the abdomen. Ultraschall Med. 1991;12:41–44. doi: 10.1055/s-2007-1004045. [DOI] [PubMed] [Google Scholar]
- 26.Fujimaki T, Mishima K, Asai A, et al. Spontaneous regression of a residual pineal tumor after resection of a cerebellar vermian germinoma. J Neurooncol. 1999;41:65–70. doi: 10.1023/a:1006155120191. [DOI] [PubMed] [Google Scholar]
- 27.Lindell RM, Hartman TE, Swensen SJ, et al. Five-year lung cancer screening experience: CT appearance, growth rate, location, and histologic features of 61 lung cancers. Radiology. 2007;242:555–562. doi: 10.1148/radiol.2422052090. [DOI] [PubMed] [Google Scholar]
- 28.Korst RJ, Lee BE, Krinsky GA, Rutledge JR. The utility of automated volumetric growth analysis in a dedicated pulmonary nodule clinic. J Thorac Cardiovasc Surg. 2011;142:372–377. doi: 10.1016/j.jtcvs.2011.04.015. [DOI] [PubMed] [Google Scholar]
- 29.Honda O, Johkoh T, Sekiguchi J, et al. Doubling time of lung cancer determined using three-dimensional volumetric software: comparison of squamous cell carcinoma and adenocarcinoma. Lung Cancer. 2009;66:211–217. doi: 10.1016/j.lungcan.2009.01.018. [DOI] [PubMed] [Google Scholar]
- 30.Kann PH, Balakina E, Ivan D, et al. Natural course of small, asymptomatic neuroendocrine pancreatic tumours in multiple endocrine neoplasia type 1: an endoscopic ultrasound imaging study. Endocr Relat Cancer. 2006;13:1195–1202. doi: 10.1677/erc.1.01220. [DOI] [PubMed] [Google Scholar]
- 31.Revel MP, Bissery A, Bienvenu M, Aycard L, Lefort C, Frija G. Are two-dimensional CT measurements of small noncalcified pulmonary nodules reliable? Radiology. 2004;231:453–458. doi: 10.1148/radiol.2312030167. [DOI] [PubMed] [Google Scholar]
- 32.Portela-Gomes GM, Grimelius L, Wilander E, Stridsberg M. Granins and granin-related peptides in neuroendocrine tumours. Regul Pept. 2010;165:12–20. doi: 10.1016/j.regpep.2010.02.011. [DOI] [PubMed] [Google Scholar]
- 33.Modlin IM, Gustafsson BI, Moss SF, et al. Chromogranin A--biological function and clinical utility in neuro endocrine tumor disease. Ann Surg Oncol. 2010;17:2427–2443. doi: 10.1245/s10434-010-1006-3. [DOI] [PubMed] [Google Scholar]
- 34.Wormanns D, Kohl G, Klotz E, et al. Volumetric measurements of pulmonary nodules at multi-row detector CT: in vivo reproducibility. Eur Radiol. 2004;14:86–92. doi: 10.1007/s00330-003-2132-0. [DOI] [PubMed] [Google Scholar]
- 35.Revel MP, Lefort C, Bissery A, et al. Pulmonary nodules: preliminary experience with three-dimensional evaluation. Radiology. 2004;231:459–466. doi: 10.1148/radiol.2312030241. [DOI] [PubMed] [Google Scholar]
- 36.Ko JP, Rusinek H, Jacobs EL, et al. Small pulmonary nodules: volume measurement at chest CT--phantom study. Radiology Sep. 2003;228(3):864–870. doi: 10.1148/radiol.2283020059. [DOI] [PubMed] [Google Scholar]
- 37.Winer-Muram HT, Jennings SG, Meyer CA, et al. Effect of varying CT section width on volumetric measurement of lung tumors and application of compensatory equations. Radiology. 2003;229:184–194. doi: 10.1148/radiol.2291020859. [DOI] [PubMed] [Google Scholar]


