

Abstract
Cfr-dependent methylation of C8 of adenosine 2503 (A2503) in 23S rRNA confers bacterial resistance to an array of clinically important antibiotics that target the large subunit of the ribosome, including the synthetic oxazolidinone antibiotic linezolid. The key element of the proposed mechanism for Cfr, a radical S-adenosylmethionine (SAM) enzyme, is the addition of a methylene radical — generated by hydrogen-atom abstraction from the methyl group of an S-methylated cysteine residue (mCys) — onto C8 of A2503 to form a protein – nucleic acid cross-linked species containing an unpaired electron. Herein we use continuous-wave and pulsed electron paramagnetic resonance (EPR) techniques to provide direct spectroscopic evidence for this intermediate, showing a spin-delocalized radical with maximum spin density at N7 of the adenine ring. In addition, we use rapid-freeze quench EPR to show that the radical forms and decays with rate constants that are consistent with the rate of formation of the methylated product.
The rise of antibiotic-resistance among bacterial pathogens is becoming a global health crisis, and the inability to produce new antibiotics at a pace keeping up with the growing spread of resistance mechanisms, especially across bacterial species, threatens to undermine the world’s current arsenal of antibiotics 1,2. Approximately one-half of all clinically relevant antibiotics target some aspect of bacterial ribosome function 3,4. As with other classes of antibiotics, bacteria evolve and/or share mechanisms to evade those that bind to the ribosome, often involving nucleotide changes in the surrounding rRNA or amino acid changes in ribosomal proteins, as well as posttranscriptional and/or posttranslational modifications of these ribosomal components 3,5. One such posttranscriptional modification is methylation of C8 of adenosine 2503 (A2503) of 23S rRNA 6–10 (Fig. 1). This nucleotide resides in the peptidyltransferase center of active ribosomes and is essential for proper ribosome function 11–14. In bacteria, A2503 carries a natural C2 modification, which is installed by the chromosomally encoded product of the rlmN gene 15,16. This C2 modification is believed to enhance translational fidelity 17. By contrast, C8 methylation, catalyzed by the product of the cfr gene in Staphylococcus aureus (SA), is generally a plasmid-borne acquired activity that confers resistance to multiple classes of antibiotics, including phenicols, lincosamides, oxazolidinones, pleuromutilins, streptogramin A, and the macrolides josamycin and spiramycin 6–9.
Figure 1. Mechanistic proposal for catalysis by Cfr.
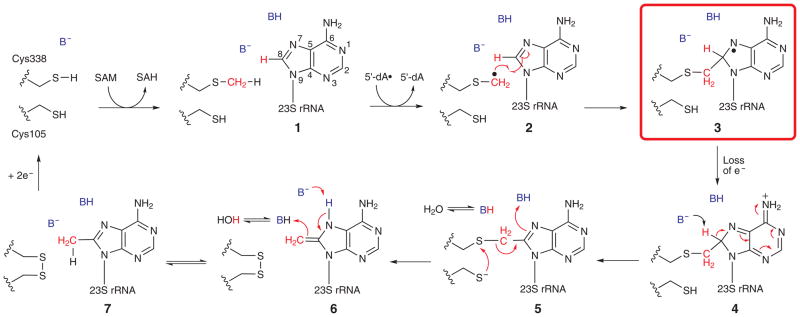
The numbering of the carbons in the adenosine ring is displayed in 1.
Cfr activity was first identified in 2000 on a plasmid isolated from the animal pathogen Staphylococcus sciuri 8. It has also been found in staphylococci that infect humans, including methicillin-resistant Staphylococcus aureus (MRSA). In 2007, a chromosomally located cfr ortholog was identified in a strain of MRSA obtained from a patient in Colombia with fatal ventilator-associated pneumonia. This strain was also resistant to one of the newest and most promising antibiotics currently in use, the synthetic oxazolidinone linezolid 18,19. Since the 2007 report, new cases of cfr-positive staphylococcal isolates from hospitalized patients in the United States (US) 20–23, Spain 24,25, Italy 26, Mexico 27, and Ireland 28 have been reported, suggesting this mechanism of antibiotic resistance is readily spreading, even across different staphylococcal species. More recently, cfr genes in human isolates of Enterococcus faecalis29 have been found, and is widespread in the order Bacillales30, suggesting the existence of a large environmental reservoir of this mode of antibiotic resistance. The global spread of this mechanism of antibiotic resistance warrants detailed analysis of all aspects of the Cfr reaction to prepare to fend off a looming and potentially disastrous world health crisis.
Cfr and RlmN belong to a rapidly growing class of metalloenzymes dubbed the radical S-adenosylmethionine (SAM) superfamily. These enzymes employ [4Fe–4S] clusters as cofactors and SAM as either a cofactor or cosubstrate to generate a potent 5’-deoxyadenosyl 5’-radical (5’-dA•) by reductive cleavage of SAM, affording L-methionine as a coproduct. In almost all radical SAM (RS) enzymes studied, the role of the 5’-dA• is to abstract a target hydrogen atom (H•) from a carbon center of a noncovalently bound substrate to generate a substrate radical that undergoes further transformation 31–33. However, the associated homolytic bond-dissociation energies (BDEs) for the sp2-hybridized carbon centers functionalized by RlmN (C2 of adenosine: 105 kcal/mol) and Cfr (C8 of adenosine: 113 kcal/mol) are even greater than that for methane (104 kcal/mol) 34,35. Recent studies, 36,37 however, showed that Cfr and RlmN employ a unique mechanism of catalysis, involving H• abstraction from the methyl moiety that is ultimately appended to the substrate, with addition of the ensuing methylene radical to C8 or C2 of the adenine base. In the mechanism that we proposed for Cfr, which is supported by a SAM-bound X-ray crystal structure of the mechanistically analogous enzyme, RlmN, SAM binds in contact with the unique iron ion of the [4Fe–4S] cluster. Cysteine 338 attacks the activated methyl group of SAM, resulting in formation of a methylcysteinyl (mCys) residue and S-adenosylhomocysteine (SAH), which subsequently dissociates from the enzyme’s active site. Following binding of another molecule of SAM and reduction of the [4Fe–4S] cluster from the +2 to the +1 oxidation state, this second SAM molecule undergoes reductive cleavage to a 5’-dA•, which abstracts a H• from the mCys residue. The resulting methylene radical adds to C8 of A2503 to generate a covalent protein–RNA crosslink containing an unpaired electron (Fig. 1, species 3). Upon loss of the electron and abstraction of the C8 proton by a general base, the covalent crosslink is resolved by disulfide-bond formation, involving a second strictly conserved cysteine (C105), with partial return of the proton removed from C8 to the nascent methyl group 36,38. The key, but unusual, step in this proposed mechanism is radical addition to afford a paramagnetic protein–RNA cross-linked species. Herein we use continuous wave (CW) electron paramagnetic resonance spectroscopy (EPR) coupled with pulsed electron nuclear double resonance (ENDOR) spectroscopy to provide direct evidence for this novel nucleic acid radical species in the Cfr mechanism. Our analysis indicates a clear change in hybridization at C8 from sp2 to sp3 and the attachment of the methyl carbon of the mCys residue to the nucleotide base. Moreover, we use rapid-freeze-quench EPR coupled with product analysis in similar single-turnover reactions to provide evidence both for the chemical and kinetic competence of this unusual species.
RESULTS
Observation of a substrate radical
Full-length 23S rRNA is comprised of 2904 nucleotides, and is therefore not practical for use as a substrate in the studies detailed herein because of its size. Consequently, a 155-nucleotide RNA strand comprising nucleotides 2464–2608 (155mer) and incorporating helices 89, 90–92, and 93, shown previously to be essential for high activity, 39 was used as the RNA substrate (Online Methods). A sample containing wild-type (wt) Cfr, SAM, and the 155mer RNA substrate was incubated for 5 min at room temperature before being mixed with the low-potential reductant, sodium dithionite, to initiate the reaction. The reaction was quickly loaded into an EPR tube before being rapidly frozen in cryogenic liquid isopentane. Analysis of the sample by CW X-band EPR revealed a spectrum characteristic of a radical strongly coupled to a single proton (Fig. 2A, top spectrum). The optimal conditions for observing the signal were also consistent with an organic radical, requiring relatively high temperatures (≥70 K) and low microwave powers (20 μW) to prevent saturation. A simulation of the spectrum indicated a highly isotropic 1H hyperfine (HF) coupling tensor (A1,2,3 = [80, 82, 85] MHz) for its three principal components. Importantly, it was necessary to include an additional contribution from an 14N nucleus with highly anisotropic HF coupling (A1,2,3 = [60, −5, −5] MHz) to reproduce the shape of the EPR signal.
Figure 2. EPR and ENDOR study of the substrate radical.

(a) CW EPR spectra in the presence of the 155mer substrate (not enriched), deu155mer substrate, [2H]; doubly labeled sample with 2H and 13C isotopes [2H,13C]; and 13C-labeled mCys, [13C]. Inserts show corresponding isotope labeling positions of A2503 in the radical species. (b, c, d) Comparative ENDOR measurements of the unlabeled (blue) and doubly labeled [2H, 13C] samples (red), which allow identification of a total of 5 HF coupling constants (see main text). Experimental conditions: (a) Temperature, 100 K; MW frequency, 9.379 GHz; modulation amplitude, 0.5 mT; MW power, 12.8 μW. Simulations accounting for C8-1H/2H, N7(14N) and 13C HF coupling constants from Table 1 are shown in red. (b) Mims ENDOR sequence; τ, 200 ns; TRF=15 μs; MW frequency, 9.730 GHz; Magnetic Field, 347.0 mT. (c) Davies ENDOR sequence; Tinv, 200 ns; TRF=12 μs; MW frequency, 9.7119 GHz; Magnetic Field, 346.0 mT. (d) Mims ENDOR sequence; τ, 200 ns; TRF=15 μs; MW frequency, 9.710 GHz; Magnetic Field, 346.2 mT. In d, the turquoise trace is the difference of the experimental data for the unlabeled and [2H,13C] samples. All CW EPR and ENDOR spectra were accumulated over a period of 40–60 hours.
To characterize the nature of this radical, a spectrum of a similar sample, in which the 155mer substrate was replaced with a substrate isotopolog containing perdeuterated adenosine nucleotides (deu155mer), was recorded. The analysis of this sample by CW EPR reveals a dramatic narrowing of the spectrum in comparison with the unlabeled sample, indicating substitution of the strongly coupled proton with a deuteron (Fig. 2A, [2H]). This behavior is consistent with the observation that the HF coupling constants of the substituting 2H are scaled with respect to the original 1H HF coupling constants by the quotient of the gyromagnetic ratios of these two nuclei, gn(1H)/gn(2H)= 6.51.
Our previous studies on RlmN suggest that both RlmN and Cfr contain only one SAM binding site, of which a major determinant is the unique iron ion of the [4Fe–4S] cluster to which the α-amino and carboxylate groups of SAM coordinate 38,40. We showed that this one site supports both transfer of a methyl group from SAM to the target Cys residue and generation of a 5’-dA• to abstract a H• from the resulting mCys residue. When overproduced under our normal expression conditions, both RlmN and Cfr are isolated almost exclusively (≥95%) with the mCys modification. However, we showed that when RlmN is overproduced in its apo form (i.e. no Fe/S cluster present) by adding o-phenanthroline to the growth media of the expression host at induction, the protein is isolated almost exclusively without a mCys modification (≥98%). When apo RlmN is incubated with SAM, no reaction takes place. However, when the [4Fe–4S] cofactor is first reconstituted into the apo protein, rapid formation of SAH takes place upon addition of SAM 40. Similar results were also obtained herein with Cfr (Supplementary Results, Supplementary Figs. 1 and 2). When Cfr was overproduced and isolated in its apo form and then incubated with SAM, no reaction took place. By contrast, when the [4Fe–4S] cofactor was first reconstituted into apo Cfr (designated Cfrapo→rcn) before incubating it with SAM (Supplementary Fig. 1), rapid formation of SAH ensued, indicating transfer of a methyl group to C338 (Supplementary Fig. 2).
Using the methodology described above, we reconstituted the [4Fe–4S] cluster on apo Cfr and then incubated the protein with S-adenosyl-L-[methyl-13C]methionine to generate Cfrapo→rcn containing a [methyl-13C]Cys residue at C338. To show that the methylene carbon of the mCys residue is connected to C8 of the adenine ring of species 3 (Fig. 1), the organic radical was generated with the [methyl-13C]-labeled protein and analyzed by CW EPR spectroscopy. Because 13C contains a nuclear spin (I = ½), the expectation is that the EPR signal should be split or broadened, depending on the magnitude of the HF coupling. To observe the anticipated 13C splitting in the absence of the strong 1H splitting, the sample was prepared using the deu155mer substrate. We term this EPR sample, containing both [methyl- 13C]mCys 338 and the deu155mer RNA substrate, [2H, 13C]. Its spectrum is markedly split in comparison to the sample generated with unlabeled Cfr and the deu155mer substrate (Fig. 2a). In the spectrum of the sample prepared with [methyl-13C]mCys 338 Cfrapo→rcn and the unlabeled 155mer substrate, termed [13C], the splitting due to the strongly coupled proton (Fig. 2a) is superimposed on that from 13C (Fig. 2a). Because the magnitude of the 13C HF coupling is similar to that of the proton, the superpositioning creates a pseudo 1:2:1 pattern in the EPR spectrum (Fig. 2a). From simulations of these EPR spectra, the corresponding 13C HF coupling constant is observed to be ~60 MHz with only 2 MHz axial anisotropy (see Table 1), indicating the presence of spin density directly on this nucleus. Based on the above observations and analyses, we conclude that there is substantial spin density around C8 of the adenine ring, indicating that the strong 1H HF coupling in the EPR spectrum described above derives from the C8 proton, while the 14N contribution derives from N7.
Table 1.
HF coupling constants (all in MHz) extracted from the experimental data as compared with calculated values from spin-unrestricted DFT methods.
| exp | DFT | ||||||||
|---|---|---|---|---|---|---|---|---|---|
|
| |||||||||
| A1* | A2* | A3* | Aiso | assign. | A1 | A2 | A3 | Aiso | |
| H1 | 80 | 82±2 | 85 | 82.3 | C8-H | +86.4 | +88.0 | +95.6 | +90.0 |
| H2 | 15 | 14 | 13±1 | 12.7 | C2-H | −23.4 | −15.7 | −6.1 | −15.1 |
| H3 | 9 | 9 | 7±2 | 8.3 | NH2 | −15.3 | −10.4 | +0.9 | −8.3 |
| H4 | 6.5 | 6.5 | 4±2 | 5.7 | NH2 | −11.5 | −11.2 | −2.1 | −8.2 |
| H5 | 2 | 2 | −2:0** | 0.1:0.7** | 1'-H | −1.5 | −1.3 | + 2.8 | −0.0 |
| C1 | 60 | 60 | 64 | 61.3 | C8-13C | +59.6 | +59.9 | +70.6 | +63.4 |
| N1 | 60±3 | −5±2 | −5±2 | 16.7 | N7 | +61.5 | −4.5 | −5.0 | +17.3 |
|
| |||||||||
| C8-CH2 | −6.1 | −4.4 | +1.9 | −2.9 | |||||
| C8-CH2 | −6.0 | −4.5 | +1.6 | −3.0 | |||||
If not specified, the uncertainty in the determination is ±0.5 or better in the unit of the last significant digit. If uncertainty is larger, a number is provided
A3 part of the coupling could not be identified in our experiment
Electronic structure of the substrate radical
To gain a better understanding of the spin distribution in the radical species, we performed additional pulsed ENDOR experiments targeted specifically to observe the 1H and 2H signals. The Mims ENDOR pulse sequence is most suitable for analysis of weak, fairly isotropic, HF interactions, while the Davies ENDOR pulse sequence is used for nuclei that are more strongly coupled, and which possess relatively large anisotropy (Supplementary Fig. 3). We chose the [2H, 13C] sample for this study over the [2H] sample because of the similarity of the EPR spectra of the doubly labeled and unlabeled samples (see Fig. 2a). This strategy results in a similar orientation selection pattern in all ENDOR experiments, allowing direct comparison of the signals obtained. Mims ENDOR analysis of the [2H, 13C] sample reveals two distinct 2H signals that are absent in control measurements of the unlabeled sample (Fig 2b). One of these signals (D1) is centered at 6.5 MHz and split by 4.54 MHz, which is 2×the Larmor frequency (νL) of deuterium. This behavior indicates that these peaks derive from a strongly coupled deuteron. The observed HF coupling constant of ~12.5 MHz precisely matches the splitting observed in the EPR signal of the unlabeled sample, accounting for the scaling factor of 6.51. The hyperfine coupling constants derived from simulation of the CW EPR spectra can also be used directly to simulate these ENDOR signals. Therefore, this signal can be assigned unambiguously to the C8 deuteron of A2503 in the deu155mer substrate. This observation, together with those described above, indicates that C8 has undergone a change in hybridization from sp2 to sp3 as depicted in Fig. 1 (Species 3).
The second 2H signal (D2) is centered at νL(2H) = 2.27 MHz and split by 2.0 MHz, indicating a case of weak coupling. The corresponding 1H doublet with 13 MHz splitting is also found in the Davies ENDOR spectra of the proton region (see H2 in Fig. 2c). Given that the CW-EPR experiments presented above establish that the spin density is located on the adenine ring, this signal most likely derives from the C2 deuteron of A2503. The isotropic character of this 1H HF coupling is also an indication of substantial spin density at C2, given that, for π-type radicals, there is a direct relationship between the isotropic 1H HF coupling constant of a ring proton and the spin density population on the carbon to which it is bonded 41. Therefore, these results indicate that the spin density is delocalized throughout the adenine ring.
A subtraction of the Mims ENDOR spectrum of the sample prepared with the deu155mer from that of the sample containing the unlabeled 155mer reveals another doublet centered at the Larmor frequency of a 1H that vanishes upon selective 2H labeling (Fig. 2d). The shape of the signal suggests that the corresponding HF coupling is dipolar with a magnitude of ~2 MHz. Because this splitting is small, no definite assignment of all three principal values of the HF coupling tensor could be achieved. Nevertheless, this coupling most likely derives from the closest proton on the ribose ring (C1’-H), because this nucleus is the only remaining unassigned proton/deuteron in the vicinity of the spin density. The corresponding deuteron signal in the sample with the deu155mer substrate has a splitting that is too small to be observed in these experiments (2 MHz/6.51 = 0.3 MHz). Additionally, Davies ENDOR measurements reveal two distinct signals in the proton region that remain unchanged upon 2H labeling (H3 and H4 in Fig. 2c). The two signals are similar, and have extracted HF coupling constants that differ by ~1.5 MHz (see Table 1). Based on the proposed structure of the organic radical, these signals could correspond either to the pair of protons on the N6 amine or the bridging methylene protons of the mCys residue.
To obtain a more precise depiction of the electronic structure of species 3 and verify assignments made by EPR and ENDOR spectroscopies, DFT calculations were performed using the Gaussian 03 package 42 on the unrestricted B3LYP level 43,44, and using Aldrich’s triple zeta basis set with a single set of polarization functions for all atoms (TZVP) 45. Table 1 includes comparisons of the calculated HF coupling constants with those derived experimentally. As can be seen from the table, the agreement between the experimental and theoretical values is good, confirming the delocalized nature of the electron spin density (see Fig. 3) deduced from the EPR and ENDOR data. Based on the performed DFT calculations, we were able to assign the HF signals of H3 and H4 in the ENDOR spectrum to the amine protons (N6H2), because the protons on the added methylene carbon were calculated to experience a relatively weak isotropic HF interaction.
Figure 3. Spin density distribution in the A2503 radical species, as modeled by spin-unrestricted B3LYP (DFT) methods.

Blue cyan areas correspond to negative spin density, and orange to positive spin density. Numbers correspond to most significant spin populations based on Mulliken population analysis. Atom color coding: white-H, gray-C, blue-N, red-O and yellow-S.
The reaction catalyzed by Cfr and RlmN is potentially analogous to the Minisci reaction, wherein protonated heteroaromatic bases are substituted by nucleophilic carbon-centered radicals 46. A Minisci-like reaction would suggest protonation of N7 before or during radical addition to afford a radical cation species. We explored this possibility via DFT analysis. Supplementary Table 1 displays predicted HF coupling constants for both protonated and non-protonated models. The non-protonated model reproduces the experimental data much better, even when accounting for relatively poor reproduction of the anisotropy of the 1H hyperfine couplings for C2-H and NH2. Most notably, in the protonated model the calculated 13C HF coupling for the added methylene group and the 14N HF coupling of N7 are considerably smaller than the experimental values. It is important to note that the proton at N7 in the protonated model is expected to exhibit a large HF coupling constant, given that it is in direct contact with the spin density located on N7. Indeed, calculations on the protonated model reveal a mostly axial HF coupling tensor with the principal values Ax=−45 MHz, Ay=−30 MHz, Az=−2 MHz (see Supplementary Table 1). Therefore, the presence of the proton would significantly perturb the shape of the CW EPR spectra. Supplementary Fig. 4 shows a comparison between the measured EPR spectra and a simulation that includes the HF coupling constants predicted for the proton at N7, keeping the remaining parameters identical to those in the simulations shown in Fig. 2. The simulated spectra for the protonated model do not reproduce the measured EPR spectra.
Chemical and kinetic competence of the substrate radical
To determine whether the characterized radical is consistent with a species that is on the reaction pathway to the m8A product (see Fig. 1), its chemical and kinetic competence was assessed using rapid-freeze-quench (RFQ) EPR in combination with chemical-quench LC/MS. Cfr, SAM, appropriate buffer components, and the 155mer RNA substrate were loaded into one syringe of an Update Instruments RFQ apparatus, while dithionite and appropriate buffer components were loaded into a second syringe. Designated volumes of the two syringes were rapidly mixed and then expelled at various times into cryogenic liquid ethane (~−150 °C). After removing the ethane by evaporation, the remaining powder was packed into EPR tubes at cryogenic temperature. A parallel experiment was conducted using the exact same components at the indicated concentrations, but quenching was performed by hand rather than using an RFQ apparatus. In Fig. 4a, representative EPR spectra at indicated times (matched by colored arrows in Fig. 4b) are displayed, while in Fig. 4b (closed triangles), the time-dependent concentration of the organic radical is plotted. As can be observed, the radical forms and decays, affording the rate constants k1 = 0.024 s−1 and k2 = 0.016 s−1 upon fitting the data to an irreversible A→B→C kinetic model, wherein A is the substrate, B is the organic radical, and C is the product. The net rate constant for these two steps, calculated as the product of k1 and k2 divided by the sum of k1 and k2, is 0.0096 s−1. A fit of this data to a first-order single-exponential equation, which neglects the small lag observed in the trace, affords a rate constant of 0.0093 s−1. This value is in agreement with the net rate constant calculated from RFQ EPR (Fig. 4b). Therefore, this radical species is chemically and kinetically competent, and consistent with an intermediate species on the reaction pathway.
Figure 4. Kinetic competence of radical intermediate.

(a) Representative CW-EPR spectra from the rapid freeze-quench time course (green trace, 180 s; red trace, 45 s; blue trace, 15 s). (b) Time-dependent formation and decay of the A2503 radical species (solid triangles) and time-dependent formation of m8A (open triangles). Both radical and m8A formation were fitted to an A→B→C kinetic model. The extracted rate constants are reported in the text. Error bars, where indicated, denote the standard deviation from two independent reactions. CW-EPR spectra were collected as described in the Materials and Methods.
DISCUSSION
RlmN and Cfr exhibit both methyltransferase and methylsynthase activity. The methyltransferase activity has been characterized and involves a direct nucleophilic attack of a strictly conserved Cys residue on the activated methyl group of SAM, resulting in a mCys intermediate that has been observed by high-resolution mass spectrometry and X-ray crystallography 36,38. By contrast, intermediates in the unconventional methylsynthase step have been more elusive, and the evidence for their existence has been indirect. For example, in in vivo studies of Cfr, an alanine variant at the cysteine (C105) proposed to resolve the cross-linked species (see Fig. 1) gave rise to a strong pause at A2503 in reverse transcription assays of the isolated RNA — as is seen when C8 of A2503 undergoes methylation —but antibiotic resistance was not conferred, indicating a modification to this nucleotide that was not a methyl group 47. In our in vitro studies of RlmN, the analogous substitution in this protein (C118A) resulted in its isolation with covalently bound rRNA 36. More recent studies of C118A and C118S variants of RlmN provide strong evidence for turnover-dependent, in vitro crosslink formation between the methylene carbon of C355 of the protein and C2 of A2503. 48 However, the inability of this species to advance to the final product does not allow its chemical and kinetic competence to be established. Our ability to trap the radical that accompanies formation of the crosslink, characterize it, and monitor its formation and decay during turnover, allows the establishment of the identity of this cross-linked species, the spin-distribution of its unpaired electron, and its chemical and kinetic competence. Our EPR and ENDOR data show that the radical is located primarily on the adenine ring of A2503, and that a covalent bond exists between A2503 and the methylene carbon of the mCys residue of Cfr, as indicated by the presence of strong 13C HF interactions in the sample containing [methyl-13C] mCys 338. The spectroscopic and computational data show that the spin density is delocalized over the adenine ring. The observation that the signal assigned to the C8 proton/deuteron of A2503 is strong and rather isotropic indicates that C8 has undergone a change in hybridization from sp2 to sp3 as depicted in Fig. 1 (Species 3). Importantly, the collapse of HF splitting observed in the sample containing the deuterated substrate, and our ability to see the C8 deuteron by ENDOR spectroscopy, clearly show that Cfr-catalyzed exchange of the mCys methylene hydrogens with solvent hydrons, which was reported previously, takes place after formation of this intermediate 36.
Our DFT calculations confirm the experimental observations. The agreement is good, given that the sets of experimental and theoretical isotropic HF values deviate within 15% of each other. However, aromatic ring protons, such as C2-H, typically experience strong anisotropic HF interactions with rhombic character 49, as indeed predicted by the DFT calculations. Surprisingly, the line width of the D2 and H2 ENDOR signals in the experimental sample are too narrow to account for any significant anisotropy. Therefore it is likely that the structure of the adenosine ring around C2 is perturbed upon docking to Cfr, which may be related to the ability of the protein to catalyze C2 methylation after the preferred C8 methylation. Overall, the experimentally deduced picture of the spin distribution is confirmed by the DFT calculations. Considering that N7 has the largest spin population of all atoms (Fig. 3), we can formally assign the radical as residing on this atom, as shown in Fig. 1.
To summarize, EPR and ENDOR spectroscopic data presented herein provide clear evidence for radical-dependent methylsynthase activity, involving abstraction of a H from the mCys residue and addition of the ensuing methylene radical onto C8 of A2503 to afford a spin delocalized radical formally residing at N7. Complementary pre-steady state kinetic analysis of formation and decay of the radical species as well as m8A formation, provide evidence both for the chemical and kinetic competence of the organic radical.
ONLINE METHODS
Materials
[methyl-13C]-methionine, DNase I (from bovine pancreas), and S-adenosylhomocysteine were purchased from Sigma–Aldrich and used as received. 2H8-adenosine 5’-triphosphate (ammonium salt; 97% 2H8) was purchased from Cambridge Isotopes (Andover, MA) and used as received. X-band quartz EPR tubes (3.8 mm) were purchased from Wilmad-LabGlass (Vineland, NJ). [methyl-13C]-SAM was synthesized as previously described 50.
Cloning of Staphylococcus aureus cfr Gene
The gene encoding cfr from S. aureus (A5HBL2) was codon-optimized for expression in E. coli by GeneArt (Burlingame, CA), and supplied in the plasmid pMA. The gene was then amplified from this plasmid using the following primers: Cfr_For (5’-gcccggcatatgaactttaacaacaaaaccaaatatggc -3’) and Cfr_Rev (5’-gcgcgaattccctggctgttctgataattgcc -3’). Cfr_For contained an NdeI restriction site (underlined), while Cfr_Rev contained an EcoRI restriction site (underlined). Primer Cfr_Rev removes the native stop codon in the cfr gene, allowing the encoded protein to be produced with a C-terminal hexahistidine tag. The resulting PCR product was digested with NdeI and EcoRI and cloned into similarly digested pET-26b by standard methods. The final construct was verified by DNA sequencing at the Molecular Core Facility (Penn State University) and designated pET26b-Cfr-Wt.
Synthesis and Purification of 155mer RNA and deu155mer (nucleotides 2454-2608 of E. coli 23S rRNA)
To generate a 155 nucleotide (nt) strand corresponding to nt 2454–2608 of 23S rRNA, a PCR product was amplified from plasmid pKK3535 36 using the following primers: Forward 5′-CGG-AAA-TTA-ATA-CGA-CTC-ACT-ATA-GGC-TGA-TAC-CGC-CCA-AGA-GTT-CAT-ATC-G -3′; Reverse 5′-mCmCG-AAC-TGT-CTC-ACG-ACG-TTC-TAA-ACC-3, where the underlined region indicates the T7 promoter. The product was isolated by agarose gel-electrophoresis and used in a large scale PCR (20 rxn ×200 μL volume each). The resulting product was precipitated with 2.5 M sodium acetate (pH 5) and used in a reaction with T7 RNA polymerase under the following conditions in a final volume of 10 mL: 30 mM Tris-HCl, pH 8.0, 26 mM MgCl2, 0.01 % Triton X-100, 20 mM DTT, 2 mM spermidine, 5 mM each NTP (dry powder was dissolved in water, neutralized with Tris base, and quantified by UV-visible spectroscopy), 5 ng/μL of PCR product, and hexahistidine-tagged T7 RNA polymerase (5% of the final volume of reaction). Reactions were incubated at 37 °C for 1 h. 20 U of DNase (New England Biolabs; Ipswich, MA) was added, and incubation at 37 °C was continued for 60 min. The precipitate was removed by centrifugation and the supernatant was separated from digested DNA and remaining NTPS by size-exclusion chromatography on an S-200 column equilibrated in 10 mM HEPES, pH 7.5, 50 mM KCl, 10 mM MgCl2, and 10% glycerol. Fractions containing the full transcript were pooled and concentrated using an Amicon Centricon with a YM-10 membrane (Millipore; Billerica, MA). The final concentration was determined from an extinction coefficient (1.87 μM−1 • cm−1) calculated from the sequence using the program DNAssist. Production of the deu155mer was carried out exactly as above except that ATP was replaced with 2H8-ATP.
Purification of wt Cfrapo
All purification steps were carried out in a Coy anaerobic chamber. In a typical purification, 20 g cell paste is resuspended in 150 mL lysis buffer [50 mM HEPES, pH 7.5, 300 mM KCl, 4 mM imidazole, 10 mM MgCl2, 10% glycerol, 10 mM 2-mercaptoethanol (BME)] containing lysozyme and DNase I at final concentrations of 1 mg/mL and 0.1 mg/mL, respectively. After stirring at room temperature for 30 min, the solution is placed in an ice bath, cooled to ~4 °C, and subjected to six 40 s bursts of sonic disruption (30% output) with intermittent pausing for ~8 min to maintain a temperature less than 8 °C. The lysate is centrifuged for 1 h at 50,000 × g and 4 °C. The resulting supernatant is loaded onto a column of Talon (Clontech; Mountain View, CA) Co2+ resin equilibrated in lysis buffer for purification by immobilized metal affinity chromatography (IMAC). The column is washed twice with 100 mL lysis buffer before eluting with 50 mL of elution buffer (50 mM HEPES, pH 7.5, 300 mM KCl, 10 mM BME, 300 mM imidazole, 10 mM MgCl2, 30% glycerol). Fractions displaying significant brown color are pooled and concentrated by ultrafiltration using an Amicon Centricon with a YM-10 membrane. The protein is exchanged into final buffer (10 mM HEPES, pH 7.5, 500 mM KCl, 5 mM DTT, 10 mM MgCl2, and 25% glycerol) using a PD-10 column (GE Biosciences; Piscataway, NJ). Reconstitution of wt Cfrapo is carried out as previously described 40. The protein is then subjected to molecular-sieve chromatography on a HiPrep 16/60 S-200 column equilibrated in final buffer to afford wt Cfrapo→RCN. Protein concentrations were determined by the method of Bradford 51 using a correction factor of 0.78 36.
Assays
Assays monitoring SAH production by wt Cfrapo→RCN were conducted and analyzed as previously described 40.
EPR Sample Preparation and Measurement
All experiments were conducted on Cfr containing a C-terminal hexahistidine tag. All manipulations of the enzyme, including preparation of EPR and ENDOR samples, were conducted inside an anaerobic chamber from Coy Laboratories. Samples to be analyzed by EPR contained the following in a total volume of 150 μL: 50 mM Tris-HCl, pH 8.4, 10 mM MgCl2, 2 mM SAM or [methyl-13C]-SAM, 150 μM 155-mer RNA or deu155mer substrate, and 200 μM wt Cfrapo→RCN. Samples were incubated for 5 min at 22 °C before being rapidly mixed with 3 μL of dithionite (114 mM in 1 M Tris-HCl). Reactions were placed in 3.8 mm quartz EPR tubes and incubated for ~ 15 s before being freeze-quenched in cryogenic liquid isopentane. All EPR measurements were acquired on a Bruker Elexsys E580 X-band spectrometer equipped with a SuperX-FT microwave bridge. CW EPR measurements were performed using an ER 4122 SHQE SuperX high-sensitivity cavity in combination with an ER 4112-HV Oxford Instruments variable temperature helium flow cryostat. For pulsed EPR/ENDOR measurements a Bruker EN 4118X-MD4 dielectric ENDOR resonator was used in concert with an Oxford CF935 helium flow cryostat. MW pulses generated by the MW bridge were amplified by an Applied Systems Engineering 1 kW traveling wave tube (TWT) amplifier (model 117x), which allows use of an 8 ns π/2 pulse at minimum attenuation.
X-band pulsed ENDOR spectra were recorded using the standard Bruker data acquisition system. RF pulses were generated by the Bruker ”DICE” system (first generation) and amplified by a 150 W Amplifier Research RF amplifier. This set up allows generation of RF π-pulses of 12 μs at 15 MHz (μL(1H)) at 10 dB total attenuation. All ENDOR measurements were recorded in a stochastic regime, as implemented in the Bruker Dice system and Bruker XEpr software. Two pulse sequences were used: Davies and Mims ENDOR 52. Corresponding pulse sequences are shown in Supplementary Figure 3. In addition, Supplementary Figure 3 describes the manner in which HF coupling constants and nuclear Zeeman frequency affects the peak position.
EPR and ENDOR measurements were performed on samples with organic radical concentrations ranging from 20 to 100 μM for the labeled material and 100–200 μM for the unlabeled material.
Rapid Freeze-Quench
Rapid freeze-quench (RFQ) was conducted as previously described 53. Briefly, the components of each syringe apparatus were taken into the anaerobic chamber 24 h before loading the syringes with the reaction mixtures. For each time series, consisting of eight points, a total of 3.0 mL of reaction mixture was used, which was distributed between 2 mL and 1 mL syringes. In the 2 mL syringe, the following was added: 50 mM Tris-HCl, pH 8.4, 5 mM MgCl2, 2 mM SAM, 300 μM 155mer RNA substrate, and 275 μM Cfr. In the 1 mL syringe, the following was added: 50 mM Tris- HCl, pH 8.4, 5 mM MgCl2, and 20 mM dithionite. These volumes are sufficient to prepare all time points and result in dilution of the reaction only by 33% after mixing. Each syringe was then capped and taken out of the anaerobic chamber to be placed in the Update Instruments Syringe driver. The instrument was programed to mix the two syringes together at 2 cm/s and then expel 357 μL of reaction mixture into a collection tube filled with liquid cryogenic ethane (~ −150 ° C) at specific reaction times. The ethane was then removed from each sample by vacuum while maintaining the collection tube at ~ - 140 °C using a liquid N2/isopentane bath. After cryogenic ethane removal, the frozen mixture becomes a fine powder, which is then packed into individual 3.8 mm quartz EPR tubes. CW-EPR spectra were recorded as described above and the concentration of each sample was determined by comparison of the sample’s double integral to that of the flavodoxin semiquinone radical (37.2 μM). All concentrations were multiplied by two to account for the packing factor 53.
Chemical Quench of Cfr Reaction
Reaction tube 1 contained in a total volume of 225 μL: 50 mM Tris- HCl, pH 8.4, 5 mM MgCl2, 2 mM SAM, 300 μM 155mer RNA substrate, and 275 μM Cfr. Reaction tube 2 contained in a total volume of 100 μL: 50 mM Tris-HCl, pH 8.4, 5 mM MgCl2, and 20 mM dithionite. The contents of Reaction tube 1 (200 μL) were then rapidly mixed with those of Reaction tube 2 to initiate the reaction. Aliquots (20 μL) were removed at designated times and then added to 20 μL of a solution containing 50 mM H2SO4 and 100 μM L-tryptophan (IS) to quench the reaction, yielding a final IS concentration of 50 μM. After quenching the reaction, 40 μL of 2 ×P1 nuclease quench buffer was added (250 mM NaAcetate, pH 6.0, 45 mM NaCl, and 4 mM ZnCl2). P1 nuclease (0.5 U) and Antarctic phosphatase (5 U) were added, and the RNA was then digested at 37 °C for 12 h. The precipitate was removed by centrifugation and the supernatants directly analyzed by LC-MS, as previously described 36,40. This entire procedure was performed in duplicate.
Production of Flavodoxin Semiquinone Radical for EPR Quantification
Flavodoxin semiquinone (FSQ) was produced by incubating 50 μM flavodoxin, 100 mM Tris-HCl, pH 8.4, and 150 mM KCl with 25 μM dithionite at 37 °C for 30 min in an anaerobic chamber. The reaction was diluted 1:5, added to a septum-sealed anaerobic cuvette, and its UV-visible spectrum recorded. The concentration of FSQ was determined from its UV/vis spectrum (ε580 nm = 4,570 M−1 cm−1) 54 (Supplementary Figure 5).
Spectral Interpretation
Spectral simulations were performed using a spin Hamiltonian formalism in a high field approximation, in which the nuclear Zeeman, hyperfine and quadrupole interactions are considered as perturbations to the electron Zeeman interaction. CW EPR simulations were calculated using the "pepper" routine from the EasySpin package for Matlab 55 using the following g-matrix principal components: g1,2 = 2.0044 and g3= 2.0079. We note that because the g-matrix components cannot be resolved directly from the EPR spectra, the presented g-values have no physical meaning and were used in the fit merely to account for minor asymmetric distortions of the lineshape. We believe that further experiments using high field EPR will clarify the actual g-anisotropy of this radical. Simulations included all nuclei with HF coupling constants above 15 MHz. All other nuclei were simulated by introducing inhomogeneous line broadening via g-strain.
ENDOR Simulations
ENDOR spectra were interpreted by independent simulation of each nucleus with programs from the "Kazan Viewer" package (Alexey Silakov, https://sites.google.com/site/silakovalexey/kazan-viewer). Because the MW pulses used have a bandwidth that is larger than the overall spectral width of the system, the simulations were performed including all orientations in powder averaging. Because no quadrupole splitting could be resolved in the deuterium ENDOR signals, we excluded this interaction from the simulation of 2H signals.
Density Functional Theory
All calculations were performed using Gaussian 03 Rev. E. within the spin- unrestricted Density Functional Theory (DFT) level 42. The geometries of all models were optimized utilizing the BP86 functional 43,44 without any restrictions. In the optimizations, Ahlrichs triple-ζ valence basis set (TZV) 45 with one set of polarization functions was used for all atoms (TZVP). The single point calculations with subsequent extraction of EPR parameters were performed using the B3LYP functional 56,57 with TZVP basis sets on all atoms. Both geometry optimization and single point calculations were performed using Gaussian's implementation of continuous solvation model COSMO (conductor-like screening model) 58 in the PCM (polarizable continuum models) framework termed 59 as C-PCM with ε=4.0. Two types of models were used, with a full cysteine residue and a truncated version with cysteine modeled as S-CH3. No substantial difference was found between those models. Thus, we present only the smaller model to simplify the representation. Coordinates for the models uses are shown in Supplementary Note 1.
Supplementary Material
Acknowledgments
We thank Drs. J. Martin Bollinger, Jr., and Carsten Krebs for a critical reading of the manuscript, and are also grateful to Dr. J. Niklas (ANL) for helpful discussions. This work was supported by NIH grants GM101957 (S.J.B) and GM101390 (M.T.G).
Footnotes
Author Contributions T.L.G., S.J.B. and A.S. designed experiments, and T.L.G. and E.L.S. prepared samples and performed experiments; J.L. and A.S acquired spectra and performed DFT calculations; A.S., T.L.G., S.J.B., and M.T.G. analyzed data; T.L.G., S.J.B. and A.S. prepared the manuscript. All authors discussed the results and commented on the manuscript.
Reprints and permissions information are available at www.nature.com/reprints.
The authors declare no competing financial interests.
supplementary Information, full methods and any associated references are available in the online version of the paper at www.nature.com/nature.
References
- 1.Choffnes ER, Relman DA, Mack A. Implications for Global Health and Novel Intervention Strategies. National Academies Press; 2010. Antibiotic Resistance. [PubMed] [Google Scholar]
- 2.Fischbach MA, Walsh CT. Antibiotics for emerging pathogens. Science. 2009;325:1089–1093. doi: 10.1126/science.1176667. [DOI] [PMC free article] [PubMed] [Google Scholar]
- 3.Poehlsgaard J, Douthwaite S. The bacterial ribosome as a target for antibiotics. Nat Rev Microbiol. 2005;3:870–881. doi: 10.1038/nrmicro1265. [DOI] [PubMed] [Google Scholar]
- 4.Steitz TA. From the structure and function of the ribosome to new antibiotics (Nobel Lecture) Angew Chem Int Ed. 2010;49:4381–4398. doi: 10.1002/anie.201000708. [DOI] [PubMed] [Google Scholar]
- 5.Weisblum B. Erythromycin resistance by ribosome modification. Antimicrob Agents Chemother. 1995;39:577–585. doi: 10.1128/AAC.39.3.577. [DOI] [PMC free article] [PubMed] [Google Scholar]
- 6.Kehrenberg C, Schwarz S, Jacobsen NE, Hansen LH, Vester B. A new mechanism for chloramphenicol, florfenicol and clindamycin resistance: methylation of 23S ribosomal RNA at A2503. Mol Microbiol. 2005;57:1064–1073. doi: 10.1111/j.1365-2958.2005.04754.x. [DOI] [PubMed] [Google Scholar]
- 7.Long KS, Poehlsgaard J, Kehrenberg C, Schwarz S, Vester B. The Cfr rRNA methyltransferase confers resistance to phenicols, lincosamides, oxazolidinones, pleuromutilins, and streptogramin A antibiotics. Antimicrob Agents Chemother. 2006;50:2500–2505. doi: 10.1128/AAC.00131-06. [DOI] [PMC free article] [PubMed] [Google Scholar]
- 8.Schwarz S, Werckenthin C, Kehrenberg C. Identification of a plasmid-borne chloramphenicol–florfenicol resistance gene in Staphylococcus sciuri. Antimicrob Agents Chemother. 2000;44:2530–2533. doi: 10.1128/aac.44.9.2530-2533.2000. [DOI] [PMC free article] [PubMed] [Google Scholar]
- 9.Smith LK, Mankin AS. Transcriptional and translational control of the mlr operon, which confers resistance to seven classes of protein synthesis inhibitors. Antimicrob Agents Chemother. 2008;52:1703–1712. doi: 10.1128/AAC.01583-07. [DOI] [PMC free article] [PubMed] [Google Scholar]
- 10.Giessing AMB, et al. Identification of 8-methyladenosine as the modification catalyzed by the radical SAM methyltransferase Cfr that confers antibiotic resistance in bacteria. RNA. 2009;15:327–336. doi: 10.1261/rna.1371409. [DOI] [PMC free article] [PubMed] [Google Scholar]
- 11.Ban N, et al. A 9 Å resolution x-ray crystallographic map of the large ribosomal subunit. Cell. 1998;93 :1105–1115. doi: 10.1016/s0092-8674(00)81455-5. [DOI] [PubMed] [Google Scholar]
- 12.Harms J, et al. High-resolution structure of the large ribosomal subunit from a mesophilic eubacterium. Cell. 2001;107:679–688. doi: 10.1016/s0092-8674(01)00546-3. [DOI] [PubMed] [Google Scholar]
- 13.Schuwirth BS, et al. Structures of the bacterial ribosome at 3.5 Å resolution. Science. 2005;310:827–834. doi: 10.1126/science.1117230. [DOI] [PubMed] [Google Scholar]
- 14.Selmer M, et al. Structure of the 70S ribosome complexed with mRNA and tRNA. Science. 2006;313:1935–1942. doi: 10.1126/science.1131127. [DOI] [PubMed] [Google Scholar]
- 15.Kowalak JA, Bruenger E, McCloskey JA. Posttranscriptional modification of the central loop of domain V in Escherichia coli 23S ribosomal RNA. J Biol Chem. 1995;270:17758–17764. doi: 10.1074/jbc.270.30.17758. [DOI] [PubMed] [Google Scholar]
- 16.Toh SM, Xiong L, Bae T, Mankin AS. The methyltransferase YfgB/RlmN is responsible for modification of adenosine 2503 in 23S rRNA. RNA. 2008;14:98–106. doi: 10.1261/rna.814408. [DOI] [PMC free article] [PubMed] [Google Scholar]
- 17.Vazquez-Laslop N, Ramu H, Klepacki D, Mankin AS. The key role of a conserved and modified rRNA residue in the ribosomal response to the nascent peptide. EMBO J. 2010;29:3108–3117. doi: 10.1038/emboj.2010.180. [DOI] [PMC free article] [PubMed] [Google Scholar]
- 18.Diekema DJ, Jones RN. Oxazolidinone antibiotics. The Lancet. 2001;358:1975–1982. doi: 10.1016/S0140-6736(01)06964-1. [DOI] [PubMed] [Google Scholar]
- 19.Toh SM, et al. Acquisition of a natural resistance gene renders a clinical strain of methicillin-resistant Staphylococcus aureus resistant to the synthetic antibiotic linezolid. Mol Microbiol. 2007;64:1506–1514. doi: 10.1111/j.1365-2958.2007.05744.x. [DOI] [PMC free article] [PubMed] [Google Scholar]
- 20.Bonilla H, et al. Multicity outbreak of linezolid-resistant Staphylococcus epidermidis associated with clonal spread of a cfr-containing strain. Clin Infect Dis. 2010;51:796–800. doi: 10.1086/656281. [DOI] [PubMed] [Google Scholar]
- 21.Mendes RE, et al. First report of cfr-mediated resistance to linezolid in human staphylococcal clinical isolates recovered in the United States. Antimicrob Agents Chemother. 2008;52:2244–2246. doi: 10.1128/AAC.00231-08. [DOI] [PMC free article] [PubMed] [Google Scholar]
- 22.Farrell DJ, Mendes RE, Ross JE, Jones RN. Linezolid surveillance program results for 2008 (LEADER Program for 2008) Diagn Microbiol Infect Dis. 2009;65:392–403. doi: 10.1016/j.diagmicrobio.2009.10.011. [DOI] [PubMed] [Google Scholar]
- 23.Farrell DJ, Mendes RE, Ross JE, Sader HS, Jones RN. LEADER program results for 2009: an activity and spectrum analysis of linezolid using 6,414 clinical isolates from 56 medical centers in the United States. Antimicrob Agents Chemother. 2011;55:3684–3690. doi: 10.1128/AAC.01729-10. [DOI] [PMC free article] [PubMed] [Google Scholar]
- 24.Morales G, et al. Resistance to linezolid is mediated by the cfr gene in the first report of an outbreak of linezolid-resistant Staphylococcus aureus. Clin Infect Dis. 2010;50:821–825. doi: 10.1086/650574. [DOI] [PubMed] [Google Scholar]
- 25.Sánchez-Garcia M, et al. Clinical outbreak of linezolid-resistant Staphylococcus aureus in an intensive care unit. JAMA. 2010;303:2260–2264. doi: 10.1001/jama.2010.757. [DOI] [PubMed] [Google Scholar]
- 26.Mendes RE, et al. Assessment of linezolid resistance mechanisms among Staphylococcus epidermidis causing bacteraemia in Rome, Italy. J Antimicrob Chemother. 2010;65:2329–2335. doi: 10.1093/jac/dkq331. [DOI] [PubMed] [Google Scholar]
- 27.Mendes RE, et al. First report of Staphylococcal clinical isolates in Mexico with linezolid resistance caused by cfr: evidence of in vivo cfr mobilization. J Clin Microbiol. 2010;48:3041–3043. doi: 10.1128/JCM.00880-10. [DOI] [PMC free article] [PubMed] [Google Scholar]
- 28.Shore AC, et al. Identification and characterization of the multidrug resistance gene cfr in a Panton-Valentine leukocidin-positive sequence type 8 methicillin-resistant Staphylococcus aureus IVa (USA300) isolate. Antimicrob Agents Chemother. 2010;54:4978–4984. doi: 10.1128/AAC.01113-10. [DOI] [PMC free article] [PubMed] [Google Scholar]
- 29.Diaz L, et al. Transferable plasmid-mediated resistance to linezolid due to cfr in a human clinical isolate of Enterococcus faecalis. Antimicrob Agents Chemother. 2012;56:3917–3922. doi: 10.1128/AAC.00419-12. [DOI] [PMC free article] [PubMed] [Google Scholar]
- 30.Hansen LH, Planellas MH, Long KS, Vester B. The order Bacillales hosts functional homologs of the worrisome cfr antibiotic resistance gene. Antimicrob Agents Chemother. 2012;56:3563–3567. doi: 10.1128/AAC.00673-12. [DOI] [PMC free article] [PubMed] [Google Scholar]
- 31.Booker SJ. Anaerobic functionalization of unactivated C H bonds. Curr Opin Chem Biol. 2009;13:58–73. doi: 10.1016/j.cbpa.2009.02.036. [DOI] [PMC free article] [PubMed] [Google Scholar]
- 32.Challand MR, Driesener RC, Roach PL. Radical S-adenosylmethionine enzymes: mechanism, control and function. Nat Prod Rep. 2011;28:1696–1721. doi: 10.1039/c1np00036e. [DOI] [PubMed] [Google Scholar]
- 33.Frey PA, Hegeman AD, Ruzicka FJ. The radical SAM superfamily. Crit Rev Biochem Mol Biol. 2008;43:63–88. doi: 10.1080/10409230701829169. [DOI] [PubMed] [Google Scholar]
- 34.Kim S, Meehan T, Schaefer HF. III Hydrogen-atom abstraction from the adenine–uracil base pair. J Phys Chem A. 2007;111:6806–6812. doi: 10.1021/jp070225x. [DOI] [PubMed] [Google Scholar]
- 35.Zierhut M, Roth W, Fischer I. Dynamics of H-atom loss in adenine. Phys Chem Chem Phys. 2004;6:5178–5183. [Google Scholar]
- 36.Grove TL, et al. A radically different mechanism for S-adenosylmethionine-dependent methyltansferases. Science. 2011;332:604–607. doi: 10.1126/science.1200877. [DOI] [PubMed] [Google Scholar]
- 37.Yan F, Fujimori DG. RNA methylation by radical SAM enzyme RlmN and Cfr proceeds via methylene transfer and hydride shift. Proc Natl Acad Sci U S A. 2011;108:3930–3934. doi: 10.1073/pnas.1017781108. [DOI] [PMC free article] [PubMed] [Google Scholar]
- 38.Boal AK, et al. Structural basis for methyl transfer by a radical SAM enzyme. Science. 2011;332:1089–1092. doi: 10.1126/science.1205358. [DOI] [PMC free article] [PubMed] [Google Scholar]
- 39.Yan F, et al. RlmN and Cfr are radical SAM enzymes involved in methylation of ribosomal RNA. J Am Chem Soc. 2010;132:3953–3964. doi: 10.1021/ja910850y. [DOI] [PMC free article] [PubMed] [Google Scholar]
- 40.Grove TL, Radle MI, Krebs C, Booker SJ. Cfr and RlmN contain a single [4Fe–4S] cluster, which directs two distinct reactivities for S-adenosylmethionine: methyl transfer by SN2 displacement and radical generation. J Am Chem Soc. 2011;133:19586–19589. doi: 10.1021/ja207327v. [DOI] [PMC free article] [PubMed] [Google Scholar]
- 41.Weil JA, Bolton JR, Wertz JE. Elementary Theory and Practical Applications. John Wiley & Sons, Inc; 1994. Electron Paramagnetic Resonance. [Google Scholar]
- 42.Gaussian v. Revision E.01 ed. Gaussian, Inc; Wallingford, CT: 2004. [Google Scholar]
- 43.Becke AD. Density-functional exchange-energy approximation with correct asymptotic-behavior. Phys Rev A. 1988;38:3098–3100. doi: 10.1103/physreva.38.3098. [DOI] [PubMed] [Google Scholar]
- 44.Perdew JP, Wang Y. Jellium work function for all electron densities. Phys Rev B. 1988;38:12228–12232. doi: 10.1103/physrevb.38.12228. [DOI] [PubMed] [Google Scholar]
- 45.Schafer A, Huber C, Ahlrichs R. Fully optimized contracted Gaussian-basis sets of triple zeta valence quality for atoms Li to Kr. J Chem Phys. 1994;100:5829–5835. [Google Scholar]
- 46.Minisci F. Novel applications of free-radical reactions in preparative organic chemistry. Synthesis. 1973:1–24. [Google Scholar]
- 47.Kaminska KH, et al. Insights into the structure, function and evolution of the radical-SAM 23S rRNA methyltransferase Cfr that confers antibiotic resistance in bacteria. Nuc Acids Res. 2010;38:1652–1663. doi: 10.1093/nar/gkp1142. [DOI] [PMC free article] [PubMed] [Google Scholar]
- 48.McCusker KP, et al. Covalent intermediate in the catalytic mechanism of the radical S-adenosyl-L-methionine methyl synthase RlmN trapped by mutagenesis. J Am Chem Soc. 2012;134:18074–18081. doi: 10.1021/ja307855d. [DOI] [PMC free article] [PubMed] [Google Scholar]
- 49.Close DM, Nelson WH. ESR and ENDOR study of adenosine single crystals X-irradiated at 10 K. Radiat Res. 1989;117:367–378. [PubMed] [Google Scholar]
- 50.Iwig DF, Booker SJ. Insight into the polar reactivity of the onium chalcogen analogues of S-adenosyl-L-methionine. Biochemistry. 2004;43:13496–13509. doi: 10.1021/bi048693+. [DOI] [PubMed] [Google Scholar]
- 51.Bradford M. A rapid and sensitive method for the quantitation of microgram quantities of protein utilizing the principle of protein dye-binding. Anal Biochem. 1976;72:248–254. doi: 10.1006/abio.1976.9999. [DOI] [PubMed] [Google Scholar]
- 52.Schweiger A, Jeschke G. Principles of Pulse Electron Paramagnetic Resonance. Oxford University Press; 2001. [Google Scholar]
- 53.Bollinger JM., Jr Use of rapid kinetics methods to study the assembly of the diferric-tyrosyl radical cofactor of E. coli ribonucleotide reductase. Methods Enzymol. 1995;258:278–303. doi: 10.1016/0076-6879(95)58052-2. [DOI] [PubMed] [Google Scholar]
- 54.Fujii K, Galivan JH, Huennekens FM. Activation of methionine synthase: further characterization of flavoprotein system. Arch Biochem Biophys. 1977;178:662–670. doi: 10.1016/0003-9861(77)90238-7. [DOI] [PubMed] [Google Scholar]
- 55.Stoll S, Schweiger A. EasySpin, a comprehensive software package for spectral simulation and analysis in EPR. J Magn Reson. 2006;178:42–55. doi: 10.1016/j.jmr.2005.08.013. [DOI] [PubMed] [Google Scholar]
- 56.Becke AD. Density-functional thermochemistry 3. The role of exact exchange. J Chem Phys. 1993;98 :5648–5652. [Google Scholar]
- 57.Lee CT, Yang WT, Parr RG. Development of the Colle-Salvetti correlation-energy formula into a functional of the electron-density. Phys Rev B. 1988;37:785–789. doi: 10.1103/physrevb.37.785. [DOI] [PubMed] [Google Scholar]
- 58.Klamt A, Schuurmann G. Cosmo - a new approach to dielectric screening in solvents with explicit expressions for the screening energy and its gradient. J Chem Soc Perkin Trans. 1993;2:799–805. [Google Scholar]
- 59.Barone V, Cossi M. Quantum calculation of molecular energies and energy gradients in solution by a conductor solvent model. J Phys Chem A. 1998;102:1995–2001. [Google Scholar]
Associated Data
This section collects any data citations, data availability statements, or supplementary materials included in this article.