

Abstract
Purpose
To understand changes in pain severity over time and to explore the factors associated with pain changes in ambulatory patients with solid tumors.
Patients and Methods
We enrolled 3,106 patients with invasive cancer of the breast, prostate, colon/rectum, or lung from multiple sites. At baseline and 4 to 5 weeks later, patients rated their pain level on a 0 to 10 numerical rating scale. A 2-point change in pain score was defined as a clinically significant change in pain. Multivariable logistic models were fitted to examine the effects of pain management and demographic and clinical factors on change in pain severity.
Results
We analyzed 2,761 patients for changes in pain severity. At initial assessment, 53.0% had no pain, 23.5% had mild pain, 10.3% had moderate pain, and 13.2% had severe pain. Overall, one third of patients with initial pain had pain reduction within 1 month of follow-up, and one fifth had an increase, and the improvement and worsening of pain varied by baseline pain score. Of the patients without pain at initial assessment, 28.4% had pain (8.9% moderate to severe) at the follow-up assessment. Logistic regression analysis showed that inadequate pain management was significantly associated with pain deterioration, as were lower baseline pain level, younger age, and poor health status.
Conclusion
One third of patients have pain improvement and one fifth experience pain deterioration within 1 month after initial assessment. Inadequate pain management, baseline pain severity, and certain patient demographic and disease characteristics are associated with pain deterioration.
INTRODUCTION
The prevalence of pain and inadequate pain management in patients with cancer has been extensively documented.1–4 A meta-analysis of 52 pain prevalence studies showed that pain prevalence varies with cohort definition and exceeds 50% for all cancer types.5 Estimates of the undertreatment of pain in patients with cancer range from 25% to 43% worldwide,6,7 with one third of patients with cancer in the United States not adequately treated.8
In contrast, less is understood about how cancer-related pain changes and what factors influence it. Pain variability is an increasingly recognized phenomenon.9 Changes in pain severity over time predict disability of patients with cancer.10 The economic costs of chronic pain are enormous,11 as are its' effects on patient function and quality of life (QOL) of patients and their families.12,13 Understanding the determinants of changes in pain severity may help clinicians improve pain management and help investigators increase assay sensitivity of clinical trials (ie, the ability of such a trial to distinguish an effective treatment from a less effective or ineffective one).14 In 2002, a National Institutes of Health–sponsored State-of-the-Science Panel reiterated the need for prospective studies on pain.15 However, data on pain changes remain limited, and more data are needed to understand the trajectory of pain during the course of disease.
The Eastern Cooperative Oncology Group (ECOG) conducted a large-scale multicenter prospective observational study to describe the prevalence and severity of 19 common symptoms, including pain, in oncology outpatients over a 1-month period (Symptom Outcomes and Practice Patterns [SOAPP]). The first publication on pain used cross-sectional baseline data from SOAPP to examine the prevalence of pain and adequacy of pain management in patients with cancer.8 The present analysis capitalizes on the longitudinal design of the SOAPP study to evaluate changes in pain severity over the 1-month period. Patients on the SOAPP study were categorized into three groups based on their pain level and analgesic use at initial assessment. Group 1 included patients with pain at initial assessment regardless of analgesic use (at risk for pain worsening); group 2 included patients without pain and taking no analgesics at initial assessment (at risk for pain occurrence); group 3 included patients without pain but taking analgesics at initial assessment (pain under control and at risk for pain recurrence). The objectives of the present report were (1) to assess pain severity changes over time and to explore potential predictors for pain worsening in the group 1 patients, and (2) to estimate the incidence of moderate-to-severe pain at the follow-up assessments and to explore its baseline predictors in the patients in groups 2 and 3.
PATIENTS AND METHODS
Patients
All patients included in this report were enrolled in the SOAPP study. Detailed information about the study population and study design for SOAPP is provided in the Appendix (online only). In total, 3,123 patients were accrued to the SOAPP study through 38 (six academic and 32 community) institutions between March 2006 and May 2008, and 2,761 patients (88%) reported their pain scores both at the initial assessment and at follow-up 28 to 35 days later and were included in the current report (Fig 1). The study protocol was approved by the institutional review board at each registering institution. All participants provided written informed consent.
Fig 1.
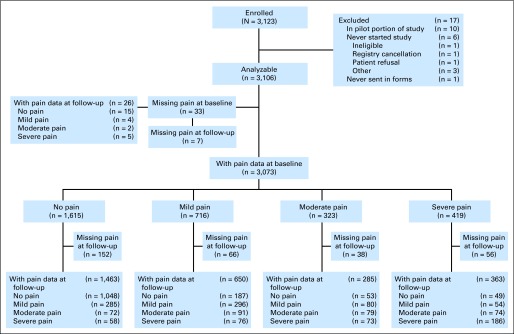
CONSORT diagram. Mild pain, pain scores of 1 to 3; moderate pain, pain scores of 4 to 5; and severe pain, pain scores of 6 to 10. A total of 2,761 patients reported pain score at both initial and follow-up assessments.
Measures
Pain severity changes between two assessments.
Patients reported their pain symptoms using the MD Anderson Symptom Inventory at both initial and follow-up assessments in the SOAPP study. Specifically, pain symptoms were rated “at their worst” in the previous 24 hours on a scale ranging from 0 (“not present”) to 10 (“as bad as you can imagine”). In the present analysis, change in pain severity was calculated as pain score at follow-up minus initial pain score. A 2-point change was considered clinically significant16 for the group 1 patients. Specifically, pain was considered worse if the difference was ≥ 2, better if the difference was ≤ −2, and stable for others. Analyses using percentage change,16 with 30% as the cutoff point for clinically significant change, gave similar results. We report the results with the 2-point change method for the group 1 patients. The cutoff points for categories of pain severity17,18 were determined using Serlin criteria19 in our patient population, and the patients' pain ratings of 1 to 3 were coded as mild, 4 to 5 as moderate, and 6 to 10 as severe pain in both initial and follow-up assessments in the present analysis.
Adequacy of pain treatment.
The Pain Management Index (PMI) was used to measure the adequacy of pain treatment at both visits, and it was calculated by subtracting the pain score from the analgesic score for each patient.8 The PMI can range from −3 (a patient with severe pain receiving no analgesic drugs) to +3 (a patient receiving strong opioids and reporting no pain). Patients were dichotomized into two groups based on the PMI value (undertreatment [PMI < 0] or adequate treatment [PMI ≥ 0]). On the basis of their initial and follow-up PMI values, patients were grouped into four categories: patients who had (1) PMI ≥ 0 at both assessments, (2) PMI ≥ 0 at the initial assessment and PMI less than 0 at the follow-up assessment, (3) PMI less than 0 at the initial assessment and PMI ≥ 0 at the follow-up assessment, and (4) PMI less than 0 at both assessments.
Demographic, disease, and pain characteristics.
At initial assessment, patient demographic and disease characteristics were collected via patient on-study form, including their overall QOL, which was assessed using one global item. Bother by adverse effects related to treatment of pain or other symptoms and bother by comorbidities were collected from both patients and clinicians on a 5-point verbal rating scale via single items. Clinicians reported the inferred mechanism of pain and presence of incidental pain using the revised Edmonton Staging System20 and collected data on the causes of current pain.
Statistical Analysis
Associations between categorical or binary variables were examined using the χ2 and Fisher's exact tests.21 Cochran-Armitage test for trend22 was used to examine the proportion of patients bothered by adverse effects across different types of analgesics. Multivariable logistic models were used to examine the factors associated with pain deterioration in each of the three patient groups. Specifically, model 1 was fitted for group 1 to examine how change in pain management was associated with pain worsening, which was defined as ≥ 2- point increase in pain score,16 and to identify baseline factors that predict pain worsening in these patients. Of note, patients with pain levels of 9 or 10 at the initial assessment were excluded from the logistic analysis because a 2-point (significant) increase in pain was not possible for them. In total, 38 factors were included as covariates (Appendix Table A1, online only). A separate category for missing data was generated for categorical covariates if the proportion of missing data was ≥ 5%. Otherwise, patients with missing data were excluded from the logistic models. No multicollinearity was found among these covariates using the Variance Inflation Factor method (VIF< 3 for all variables). Models 2 and 3 were fitted to identify baseline factors predicting the occurrence of moderate-to-severe pain at follow-up visit in patients in groups 2 and 3, respectively. All covariates in model 1 were considered in the two models, except for the variables related to pain. Type of analgesic was included as a covariate in model 3. In all models, robust sandwich estimators of SEs23 were calculated to account for the clustering effect of institutions.
All P values were two-sided. A level of 5% was considered statistically significant. All statistical analyses were conducted using STATA 11.0 software (STATA, College Station,TX).
RESULTS
Patients
Of the 2,761 patients, 49.7% had breast cancer, 23.6% had colorectal cancer, 10.3% had prostate cancer, and 16.4% had lung cancer. Patient demographic and disease characteristics are provided in Appendix Table A2 (online only).
Severity of Pain at Initial and Follow-Up Assessments
Of the 2,761 patients, 1,298 patients (47.0%) had pain at the initial assessment (group 1), and 1,463 patients (53.0%) had pain score of 0 (groups 2 and 3). Table 1 displays the baseline pain severity and pain change by baseline pain level in all patients. Of the whole sample, 23.5% had mild pain, 10.3% had moderate pain, and 13.2% had severe pain at initial assessment. The corresponding percentages were 25.9%, 11.5%, and 14.2%, respectively, at follow-up visit. Of the 1,298 group 1 patients, 32.2% had reduced pain, 19.6% had worse pain, and 48.2% had stable pain at follow-up assessment, and the proportions of improvement and worsening in pain severity between the two assessments varied by baseline pain level. Of the 1,463 patients in groups 2 and 3, 19.5% had mild pain, 4.9% had moderate pain, and 4.0% had severe pain at follow-up assessment.
Table 1.
Change in Pain Severity by Pain Severity Level at Baseline
| Pain Score | Pain Score at Baseline |
Pain Change* |
Pain Score at Follow-Up |
|||||||||||
|---|---|---|---|---|---|---|---|---|---|---|---|---|---|---|
| No. | % | Better |
Stable |
Worse |
Group 2 |
Group 3 |
Groups 2 and 3 |
|||||||
| No. | % | No. | % | No. | % | No. | % | No. | % | No. | % | |||
| 1-10 (group 1) | 1,298 | 47.0 | 418 | 32.2 | 625 | 48.2 | 255 | 19.6 | 214 | 23.5 | 201 | 36.3 | 415 | 28.4 |
| 1-3 | 650 | 23.5 | 102 | 15.7 | 378 | 58.2 | 170 | 26.2 | 154 | 16.9 | 131 | 23.6 | 285 | 19.5 |
| 1 | 275 | 10.0 | 0 | 0.0 | 208 | 75.6 | 67 | 24.4 | 89 | 9.8 | 71 | 12.8 | 160 | 10.9 |
| 2-3 | 375 | 13.6 | 102 | 27.2 | 170 | 45.3 | 103 | 27.5 | 65 | 7.2 | 60 | 10.8 | 125 | 8.6 |
| 4-5 | 285 | 10.3 | 114 | 40.0 | 107 | 37.5 | 64 | 22.5 | 35 | 3.9 | 37 | 6.7 | 72 | 4.9 |
| 6-10 | 363 | 13.2 | 202 | 55.6 | 140 | 38.6 | 21 | 5.8 | 25 | 2.8 | 33 | 6.0 | 58 | 4.0 |
| 6-8 | 257 | 9.3 | 132 | 51.4 | 104 | 40.5 | 21 | 8.2 | 19 | 2.1 | 26 | 4.7 | 45 | 3.1 |
| 9-10 | 106 | 3.8 | 70 | 66.0 | 36 | 34.0 | 0 | 0.0 | 6 | 0.7 | 7 | 1.3 | 13 | 0.9 |
| 0 (groups 2 and 3) | 1,463 | 53.0 | 0 | 0.0 | 1,208 | 82.6 | 255 | 17.4 | 695 | 76.5 | 353 | 63.7 | 1,048 | 71.6 |
| Group 2 | 909 | 32.9 | 0 | 0.0 | 784 | 86.2 | 125 | 13.8 | — | — | — | |||
| Group 3 | 554 | 20.1 | 0 | 0.0 | 424 | 76.5 | 130 | 23.5 | — | — | — | |||
| Total | 2,761 | 100.0 | 418 | 15.1 | 1,833 | 66.4 | 510 | 18.5 | 909 | 100.0 | 554 | 100.0 | 1,463 | 100.0 |
NOTE. In group 1 patients, P < .001 for the Fisher's exact test of the overall association between baseline pain severity (mild, moderate, severe) and pain severity change (better, stable, worse). The χ2 test was used to compare (1) the proportion of pain worsening at initial assessment between patients with 1 to 3, 4 to 5, and 6 to 8 pain scores (26.2% v 22.5% v 8.2%; P < .001), and (2) the proportion of pain improvement at initial assessment between patients with 2 to 3, 4 to 5, and 6 to 10 pain scores (27.2% v 40.0% v 55.6%, P < .001).
Pain severity change between two visits = pain score at follow-up–pain score at baseline. If the difference was ≥ 2, the pain had become worse; if the difference was between −1 and 1, the pain level had remained stable; if the difference was ≤ −2, the pain had improved.
Pain Management at Initial and Follow-Up Assessments
Of the 2,761 patients, 54.9% patients had adequate pain management at both visits, 11.4% patients had adequate pain management at initial visit but were undertreated at follow-up visit, 10.2% patients were undertreated at initial visit but had adequate pain management at follow-up visit, 11.7% patients were undertreated at both visits, and 11.8% patients had missing values for at least one visit. Patients in group 2 had the highest proportion of change from adequate pain management to undertreatment (20.1% v 7.6% for group 3 v 6.9% for group 1 patients; P < .001 for pairwise comparisons). In group 1, patients with severe pain at initial assessment had the highest proportion of undertreatment at both visits (34.7% v 20.5% for mild pain and 22.1% for moderate pain at initial assessment; P < .01 for pairwise comparisons).
Association Between Change in Pain Management and Change in Pain Severity
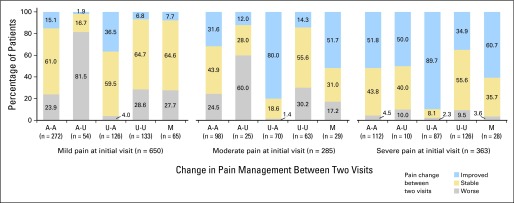
Of the 1,298 group 1 patients, the proportion of patients with worsening pain was highest for patients with PMI that changed from adequate to undertreated, whereas patients with PMI that changed from undertreated to adequate were more likely to experience pain relief (P < .001 for both; Fig 2), regardless of pain level at initial assessment (Appendix Fig A1, online only). Of the 909 group 2 patients, 214 (23.5%) had developed pain at follow-up assessment, and 183 (85.5%) of them received inadequate pain management. Of the 554 group 3 patients, 201 (36.3%) had recurrent pain at follow-up, and 42 (20.9%) of them received inadequate pain management for the recurrent pain (Fig 3).
Fig 2.

Change in pain severity by change in pain management between two visits in patients with pain at initial assessment (group 1, n = 1,298). A-A: adequately treated in both visits; A-U: adequately treated at initial, undertreated at follow-up; U-A: undertreated at initial, adequately treated at follow-up; U-U: undertreated in both visits; M: missing pain treatment data in at least one visit. P < .001 for Fisher's exact test to assess the significance of the overall association between pain management change (A-A, A-U, U-A and U-U) and pain severity change; P < .001 for χ2 tests to compare the proportion of pain relief between patients with pain management of U-A and other patients (63.6% v 22.5%), and to compare the proportion of pain worsening between patients with pain management of A-U and other patients (67.4% v 15.7%).
Fig 3.
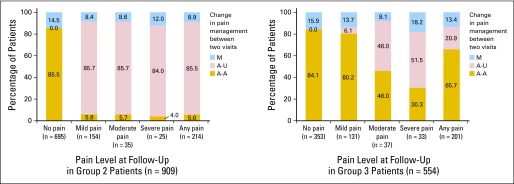
Change in pain management by pain level at follow-up assessment in patient groups 2 and 3. A-A: adequately treated in both visits; A-U: adequately treated at initial, undertreated at follow-up; M: missing pain treatment data in at least one visit.
Patients' Perceptions of Being Bothered by Pain Treatment
Of the group 1 patients, 42.5% (549 of 1,292) were at least moderately bothered by adverse effects related to treatment of pain or other symptoms; this proportion was higher for patients who were taking strong opioids (54.2% v 44.1%, 39.1%, 36.4% for patients taking weak opioids, nonopioids, and no analgesics, respectively; P < .001 for trend analysis). Of the patients in groups 2 and 3, 19.6% and 19.5%, respectively, reported moderate or more severe bothering. Figure 4 shows how patients' perceptions of being bothered by adverse effects influenced pain management in the whole sample: those who were not or slightly bothered by adverse effects were more likely to receive adequate treatment at both visits (P < .01), whereas those who were extremely bothered by adverse effects were more likely to receive undertreatment at both visits (P < .01).
Fig 4.

Change in pain management by amount bothered by adverse effects related to treatment of pain or other symptoms at initial assessment (n = 2,746). Fifteen patients had missing data for amount bothered by adverse effects. A-A: adequately treated in both visits; A-U: adequately treated at initial, undertreated at follow-up; U-A: undertreated at initial, adequately treated at follow-up; U-U: undertreated in both visits; M: missing pain treatment data in one visit. Those who were not bothered or slightly bothered by adverse effects were more likely to receive adequate treatment at both visits (57.9% v 48.2% for other patients, P < .001, χ2 test), whereas those who were extremely bothered by adverse effects were more likely to receive undertreatment at both visits (30.0% v 11.1% for other patients, P < .001, χ2 test).
Predictors for Pain Deterioration
Multivariable logistic analysis identified many factors associated with worsening pain in group 1 patients (model 1, Table 2). Patients had 12 times higher odds of having pain worsening when their PMI changed from adequate to undertreated (odds ratio [OR] = 11.8; 95% CI, 6.3 to 21.9). Pain owing to cancer, neuropathic pain, moderate-to-severe constipation (opioid adverse effect), comorbidity-related discomfort, lung cancer, taking fewer medicines, unemployment, and treatment in community institutions were associated with increased odds of worsening pain. The odds of worsening pain decreased as baseline pain level increased.
Table 2.
Multivariable Logistic Analysis of Factors Associated With Pain Worsening Among Patients With Pain Score of 1 to 8 at Initial Assessment (model 1, n = 1,051)
| Variable | Adjusted OR | 95% CI | P |
|---|---|---|---|
| Pain management | |||
| Adequate + under v adequate at both | 11.76 | 6.32 to 21.90 | < .001 |
| Under + adequate v adequate at both | 0.20 | 0.08 to 0.52 | .001 |
| Under at both v adequate at both | 2.19 | 1.34 to 3.60 | .002 |
| Missing v adequate at both | 1.70 | 0.88 to 3.28 | .112 |
| Pain score at baseline, continuous | 0.68 | 0.62 to 0.74 | < .001 |
| Cause of current pain | |||
| Cancer treatment v cancer | 0.59 | 0.30 to 1.14 | .117 |
| Comorbidity v cancer | 0.52 | 0.25 to 1.09 | .085 |
| Psychological/other reasons v cancer | 0.48 | 0.28 to 0.84 | .009 |
| Mechanism of pain | |||
| Neuropathic v nociceptive | 1.97 | 1.23 to 3.15 | .005 |
| No or unknown v nociceptive | 1.00 | 0.54 to 1.83 | .991 |
| Constipation severity, score ≥ 5 v score < 5 | 1.69 | 1.05 to 2.73 | .032 |
| Bothered by side effects related to pain treatment, yes v not at all | 1.44 | 0.93 to 2.22 | .103 |
| Bothered by comorbidity—clinician,* yes v no | 1.57 | 1.02 to 2.40 | .038 |
| Psychological distress and/or addictive behavior, yes v no | 1.39 | 0.96 to 2.02 | .083 |
| No. of medicines currently taken | |||
| ≥ 5 v 0-4 | 0.57 | 0.35 to 0.93 | .023 |
| Unknown v 0-4 | 1.10 | 0.52 to 2.34 | .796 |
| Type of institute, community v academic | 2.22 | 1.20 to 4.10 | .011 |
| Disease site | |||
| Prostate v lung | 0.44 | 0.22 to 0.84 | .014 |
| Colorectal v lung | 0.45 | 0.24 to 0.83 | .011 |
| Breast v lung | 0.70 | 0.42 to 1.16 | .163 |
| Employment | |||
| Part time v full time | 1.32 | 0.68 to 2.54 | .409 |
| No work v full time | 2.05 | 1.27 to 3.31 | .003 |
| Age, < 55 v ≥ 55 years | 1.40 | 0.87 to 2.23 | .164 |
| Progressive disease, yes v no | 1.39 | 0.90 to 2.13 | .134 |
| Patient's QOL, poor v good | 1.30 | 0.90 to 1.88 | .158 |
| Disturbed sleep, score ≥ 5 v score < 5 | 1.25 | 0.89 to 1.74 | .193 |
| Participating in any support group, yes v no | 0.65 | 0.38 to 1.13 | .125 |
NOTE. Outcome variable: pain deteriorated at follow-up = 1, pain improved or no change at follow-up = 0. A total of 38 covariates were included in the multivariable model, and only the 17 factors with a P value of no greater than .2 were shown in the table. The other 21 factors had a P value of greater than .2. Of the 1,298 patients with pain at the initial assessment (group 1), 106 had pain scores of 9 or 10. A total of 1,192 patients had pain scores of 1 to 8 at the initial assessment, 141 had missing value for at least one covariate, and 1,051 patients were included in model 1.
Abbreviations: OR, odds ratio; QOL, quality of life.
“Bothered by comorbidity–clinician” means clinician reported whether the patient was being bothered by comorbidity.
Younger age, Hispanic ethnicity, and more severe constipation were significant predictors of moderate-to-severe pain at follow-up assessment in group 2 patients (model 2, Table 3), whereas nonopioid or weak opioid use, shorter duration of cancer, and accompaniment to the visit were significant predictors for worsening pain in group 3 patients (model 3, Table 3).
Table 3.
Multivariable Logistic Analysis of Predictors for Occurrence of Moderate-To-Severe Pain Among Patients Without Pain at Initial Assessment
| Variable | Analgesic Use at Initial Assessment |
|||||
|---|---|---|---|---|---|---|
| No (group 2, model 2, n = 833)* |
Yes (group 3, model 3, n = 464)† |
|||||
| Adjusted OR | 95% CI | P | Adjusted OR | 95% CI | P | |
| Ethnicity | ||||||
| Hispanic v non-Hispanic | 3.38 | 1.78 to 6.43 | < .001 | |||
| Missing v non-Hispanic | 1.71 | 0.74 to 3.95 | .212 | |||
| Race | ||||||
| Black v white | 2.01 | 0.87 to 4.65 | .103 | |||
| Other v white | 0.73 | 0.11 to 4.74 | .744 | |||
| Constipation severity, continuous (0-10)‡ | 1.18 | 1.02 to 1.37 | .024 | |||
| Bone metastasis, yes v no | 0.16 | 0.02 to 1.43 | .101 | |||
| ECOG PS, 1-4 v 0 | 1.83 | 0.79 to 4.24 | .158 | |||
| History of depression, yes v no | 1.50 | 0.87 to 2.58 | .143 | |||
| Weight loss in past 6 months, > 5% v ≤ 5% | 0.35 | 0.07 to 1.68 | .189 | |||
| Duration of current cancer therapy | ||||||
| < 1 month v no treatment | 2.04 | 0.78 to 5.33 | .144 | |||
| 1 month to 1 year v no treatment | 1.70 | 0.73 to 3.92 | .217 | |||
| ≥ 1 year v no treatment | 0.57 | 0.22 to 1.48 | .249 | |||
| Receiving any counseling service, yes v no | 1.92 | 0.85 to 4.29 | .115 | |||
| Age, < 55 v ≥ 55 years | 2.28 | 1.17 to 4.46 | .016 | 0.45 | 0.18 to 1.13 | .088 |
| Analgesic use§ | ||||||
| Nonopioid v strong opioids | 2.09 | 1.16 to 3.76 | .015 | |||
| Weak opioids v strong opioids | 3.96 | 2.04 to 7.66 | < .001 | |||
| Years since cancer diagnosis, continuous | 0.89 | 0.79 to 0.99 | .038 | |||
| Accompanied to the visit, yes v no | 2.09 | 1.06 to 4.14 | .034 | |||
| Progressive disease, yes v no | 1.83 | 0.90 to 3.74 | .096 | |||
| Bothered by comorbidity—patient,¶ yes v no | 1.89 | 0.95 to 3.77 | .071 | |||
| Psychological distress and/or addictive behavior, yes v no | 1.76 | 0.86 to 3.62 | .122 | |||
| Disturbed sleep, score ≥ 5 v score < 5 | 1.68 | 0.77 to 3.66 | .189 | |||
| Bothered by side effects related to pain treatment, yes v not at all | 1.66 | 0.82 to 3.35 | .156 | |||
NOTE. Outcome variable for both models: moderate to severe pain at follow-up = 1, no or mild pain at follow-up = 0. In total, 31 covariates were included in the multivariable logistic model (model 2) for patients without analgesic use at initial assessment (group 2), and 33 covariates were included in model 3 for patients with analgesic use at initial assessment (group 3). Only factors with a P value of no greater than .2 were shown in the table.
Abbreviations: ECOG PS, Eastern Cooperative Oncology Group performance status; OR, odds ratio.
Of the 909 patients in group 2, 76 of them had missing value for at least one covariate, and 833 patients were included in model 2.
Of the 554 patients in group 3, 90 patients had missing value for at least one covariate, and 464 patients were included in model 3.
Constipation severity was included as a continuous variable in models 2 and 3 because very few patients (37 in model 2 and 30 in model 3) included in these analyses had a score of 5 or higher for constipation.
Strong opioids included morphine, hydromorphone, oxycodone, methadone, fentanyl, OxyContin, intrathecal pump, and subcutaneous or intravenous opioids; weak opioids included hydrocodone/acetaminophen, codeine/acetaminophen, and propoxyphene/acetaminophen.
“Bothered by comorbidity—patient” means patient reported whether he/she was being bothered by comorbidity.
The effect of sex on change in pain severity was investigated in patients with colorectal and lung cancer. It was significant in none of the models (data not shown).
DISCUSSION
To our knowledge, the SOAPP study is the largest prospective evaluation of pain and other symptoms in outpatient oncology patients in the United States to date. This secondary analysis of the SOAPP study shows that about half of the outpatients seen in oncology clinics have pain at initial assessment. Pain relief within a 1-month period is seen in approximately one third of these patients and pain worsening in about one fifth. This proportion of outpatients who experience worsening pain is similar to that of outpatients who are referred for outpatient palliative care consultation.24 In our study, approximately 30% of the patients who had no pain at the initial visit experienced pain at the second visit. These findings highlight the importance of frequent assessment of pain and close monitoring for pain changes.
We conclude that in addition to underlying disease, changes in pain level are driven primarily by the adequacy of pain treatment. These findings are similar to those from the Indiana Cancer Pain and Depression trial.25 The present study shows that pain is highly prevalent, persistent, and dynamic in patients with cancer, and prescribing analgesics to manage pain is clearly the most important modifiable factor affecting pain severity change. In group 3, patients on non- or weak opioid at initial assessment, compared with patients on strong opioid, had two or four times higher odds of having recurrent moderate-to-severe pain at follow-up assessment. In group 1, patients with pain treatment changing from undertreatment to adequate treatment for their pain had an 80% reduction in the odds of pain worsening compared with patients with adequate treatment for pain at both visits, and two thirds of patients experienced worsening pain when their pain treatment changed from adequate to inadequate. This correlation of pain management with pain changes supports the validity of the PMI in tracking pain management in patients with cancer.
The importance of analgesic adverse effects is highlighted by the finding that among group 1 patients, approximately half were at least moderately bothered by the adverse effects of medicines prescribed to treat their symptoms. Patients who are bothered by such adverse effects are more likely to change to less potent medicines, be noncompliant, or discontinue analgesics, resulting in worse pain control. This interpretation is supported by the findings that those who were extremely bothered by adverse effects were more likely to receive undertreatment at both visits (Fig 4) and by the ORs of constipation (model 1) and bother by adverse effects related to treatment of pain or other symptoms (models 1 and 3) in the logistic models. Selecting an appropriate analgesic,26–28 understanding patient's concerns about its adverse effects,29 closely monitoring patients for the analgesic's pain control effect and its adverse effects, and familiarizing with approaches to reduce the adverse effects of opioids (eg, guideline-driven management of opioid adverse effects30 and effective psychoeducational interventions31,32) are important for the optimal use of analgesics in pain management.
An unexpected finding of our study was that improvement in pain levels varied with baseline pain levels. One possible interpretation for this observation is regression to the mean (RTM).33,34 In the SOAPP data, RTM effect was −1.54 for patients with severe pain at initial assessment; the mean change in pain score was −2.53 for these patients. However, for patients with initial moderate pain, RTM effect was −0.19, and the mean change in pain score was −0.84. Thus RTM did not fully explain the association between pain improvement and baseline pain score in group 1 patients. It is now clear that baseline pain severity is an indicator of pain management complexity10,35 and an important element to consider when designing pain intervention clinical trials to improve the assay sensitivity of these trials.
Consistent with other studies,2,35,36 neuropathic pain was associated with more difficult pain control in group 1 patients in our study. In the first analysis of the SOAPP pain data,8 minority status was found to have higher odds of inadequate pain management. In the present analysis, Hispanic ethnicity was associated with higher odds of moderate-to-severe pain in group 2 patients. There is no internationally accepted method of identifying, at the group or individual level, patients who are most difficult to treat from a pain management perspective or of quantifying their vulnerability to pain.37 Our data suggest that younger patients (model 2) and those who were unemployed (model 1) and had other comorbidities (models 1 and 3) may require more intensive pain assessment and management.
The SOAPP study was not designed specifically for assessing changes in pain. Consequently, the study had several limitations. We collected information about pain and pain management at two time points, but the reasons for changes in pain treatment were not collected at follow-up assessment. The observation period covered only 1 month; thus the pattern of changes in pain over a longer period of time remains unknown. Moreover, pain was measured by a single MD Anderson Symptom Inventory item, which may not capture the complexity of the construct of pain. Also, patients with pain scores of 9 or 10 were excluded from model 1 because of the limitation of using a numeric scale to measure pain. The sample size was relatively small for some factors (especially in models 2 and 3) and the estimated ORs for them were lack of precision. Lastly, these findings can be generalized only to patients with common solid tumors who receive care at academic and community sites associated with a cooperative US clinical group. In addition, patients included in this pain analysis were not fully representative of the whole sample in the SOAPP study (they were more likely to have nonprogressive disease, good QOL, be currently receiving treatment, and have no full-time job; see Appendix).
In conclusion, pain remains a significant concern in ambulatory oncology. Pain is not only prevalent but also persistent and dynamic. Knowing that pain management practices and baseline pain severity are key factors for change in pain severity should enable better designs of clinical trials intended to measure the impact of cancer therapeutics or supportive care measures on the short-term patient experience of pain.
Acknowledgment
We thank Dawn Chalaire (Associate Director, Department of Scientific Publications, MD Anderson Cancer Center) for editorial assistance and all patients for participating in the Eastern Cooperative Oncology Group Symptom Outcomes and Practice Patterns study.
Appendix
Study Design and Study Population for Symptom Outcomes and Practice Patterns
Symptom Outcomes and Practice Patterns (SOAPP) was a multicenter observational prospective survey study (clinicaltrials.gov identifier: NCT00303914). The primary aim of the study was to assess prevalence, severity, and interference owing to physical and psychological symptoms in patients with cancer being treated on an outpatient basis at Eastern Cooperative Oncology Group (ECOG) institutions. Eligible patients had invasive cancer of the breast, colorectal, prostate, or lung, and disease could be at any stage (no evidence of disease, locoregional, metastatic, locoregional and metastatic) and at any point in the trajectory of their care. Other eligible criteria included age ≥ 18 years, receiving care at an ECOG-affiliated institution, willing to complete the follow-up survey approximately 1 month later, and judged by the study screener to have adequate cognitive function to complete study surveys. The anticipated accrual goal was 2,310 patients; however, because of brisk accrual toward the end of the study, a final accrual of 3,123 patients was allowed so that all consented patients could participate.
Patients were registered at 38 institutions, including six academic sites and 32 community clinics. Patients treated in academic centers were enrolled from disease-site–specific clinics; patients treated in community clinics were enrolled from general oncology clinics. To reduce selection bias, each site devised an ECOG-approved recruitment algorithm that was not biased toward symptom-management issues.
Patients were recruited when they checked in for their clinic appointments. Basic clinical and demographic information, including primary site, current disease status, prior and current cancer treatment, and overall health status, was collected by study staff before the clinician's visit. Patients completed symptom assessment using the MD Anderson Symptom Inventory at the initial visit and at a follow-up visit 28 to 35 days later. Patients were asked to read the instructions at the beginning of each questionnaire and complete all items according to their experience during the preceding 24 hours. Reasons for incomplete forms were documented on an Assessment Compliance Form. Patients who were too ill to complete the follow-up questionnaire were given the option to mail the forms to the treating clinic by day 42 after the initial visit.
In addition to patients, treating clinicians (ie, treating physician, nurse, physician assistant, or resident/fellow) were also surveyed at the same time, and information about pain and pain treatment and clinician's perception of patient's overall health status were collected from them using clinician on-study form. The clinician forms must have been completed within 48 hours of the patients' completion of the baseline forms. The same clinician must have completed the follow-up forms as well.
The study protocol and case report forms are accessible on the study web site: www.ecogsoapp.org.
Factors Associated With Missing Pain Data
Of the 3,123 patients enrolled in the SOAPP study, 3,106 of them were analyzable patients. A total of 2,761 analyzable patients had pain data at both initial and follow-up visits, and 345 patients had missing pain data at one or two visits (319 patients had missing pain data at the follow-up visit, and 26 patients had missing pain data at the initial assessment).
The baseline factors that were associated with missing pain data were examined using a multivariable logistic regression model. The dependent variable was presence of pain data at both visits, coded as missing pain data = 1 and pain reported for both visits = 0. A total of 29 baseline demographic and clinical factors were examined in the regression analysis, including baseline level of pain, fatigue, disturbed sleep, dry mouth and constipation, age, race, ethnicity, years since cancer diagnosis, disease site, disease stage, disease status, liver metastasis, bone metastasis, ECOG performance status, patient-reported quality of life, history of depression, weight loss in the previous 6 months, patient reported being bothered by comorbidities, clinician reported that patient was being bothered by comorbidities, number of medicines currently taking, prior systemic therapy, prior radiotherapy, currently receiving treatment, participation in any support group, receiving any counseling service, institution type, driving in the past month, and current employment status.
The results showed that patients with disease progression (odds ratio [OR] = 1.85, 95% CI, 1.46 to 2.35; P < .001) and poor quality of life (OR = 1.54; 95% CI, 1.09 to 2.19; P = .016) were more likely to have missing pain data. Patients with advanced disease (OR = 0.78; 95% CI, 0.63 to 0.96; P = .021), currently receiving treatment (OR = 0.55; 95% CI, 0.36 to 0.85; P = .008), having part-time job or not working (OR = 0.62; 95% CI, 0.47 to 0.81; P = .002) are less likely to have missing pain data. Other factors were not statistically significant (P > .05).
Table A1.
| Categories | Variables and Coding |
|---|---|
| Pain management | Pain management (adequately treated at both visits v adequately treated at initial visit and undertreated at follow-up visit v undertreated at initial visit and adequately treated at follow-up visit v undertreated at both visits v missing data for one visit); analgesic use at initial assessment (strong opioids v weak opioids v nonopioids); patient reported bothered by side effect related to treatment of pain or other symptoms (yes v not at all) |
| Pain characteristics at initial assessment | Pain mechanism (no pain syndrome or insufficient data v neuropathic v nociceptive), incidental pain (insufficient data v yes v no), pain score at initial assessment (continuous), cause of current pain (unknown cause v psychological or other cause v comorbidity v cancer treatment v cancer) |
| Demographic characteristics | Age (< 55 v ≥ 55 years), race (white v black v others), ethnicity (non-Hispanic v Hispanic v missing), sex (male v female) |
| Disease characteristics and cancer treatment at initial assessment | Primary disease type (breast v colorectal v prostate v lung), advanced disease (yes v no), current progressive disease (yes v no), presence of bone metastasis (yes v no), presence of liver metastasis (yes v no), duration of cancer (ie, years since initial cancer diagnosis to study entry, years, continuous), prior systemic therapy (yes v no), prior radiation therapy (yes v no), current treatment time (≥ 1 year v 1 month to 1 year v within 1 month v no current treatment), institution type (community v academic) |
| Overall health status at initial assessment | ECOG performance status (1-4 v 0), patient perception of QOL (fair/poor/very poor v good/excellent), weight loss over prior 6 months (> 5% v ≤ 5%), number of medications currently taking at study entry (0-4 v ≥ 5 v missing), patient reported bothered by comorbidity (a little bit/moderately/quite a bit/extremely v not at all), clinician reported bothered by comorbidity (a little bit/moderately/quite a bit/extremely v not at all), history of depression in self (yes v no), psychological distress and addictive behavior (insufficient information v psychological distress and/or addictive behavior v no), driving in the past 4 weeks (yes v no) |
| Baseline symptoms | Baseline constipation score (≥ 5 v < 5), baseline disturbed sleep score (≥ 5 v < 5), baseline dry mouth score (≥ 5 v < 5), baseline fatigue score (≥ 5 v < 5) |
| Social and family support at initial assessment | Participating in any counseling service (yes v no), participating in any support group (yes v no), being accompanied to the visit (yes v no) |
Abbreviations: ECOG, Eastern Cooperative Oncology Group; QOL, quality of life.
Table A2.
Patient Demographic and Disease Characteristics (n = 2,761)
| Variable | No. | % |
|---|---|---|
| Age, years | ||
| Median | 61 | |
| Range | 18-93 | |
| Female sex | 1,936 | 70.1 |
| Race | ||
| White | 2,363 | 85.6 |
| Black | 315 | 11.4 |
| Other | 83 | 3.0 |
| Ethnicity, n = 2,536 | ||
| Hispanic | 253 | 10.0 |
| Non-Hispanic | 2,283 | 90.0 |
| Employment, n = 2,743 | ||
| Full time | 634 | 22.9 |
| Part time | 337 | 12.2 |
| No work | 1,772 | 64.2 |
| ECOG performance status, n = 2,748 | ||
| 0 | 1,589 | 57.6 |
| 1 | 971 | 35.2 |
| 2-4 | 188 | 6.8 |
| Patient-rated QOL, n = 2,753 | ||
| Excellent/good | 1,970 | 71.4 |
| Fair/poor/very poor | 783 | 28.4 |
| Duration of cancer, months, n = 2,718 | ||
| Median | 14 | |
| Range | 0-627 | |
| Disease site | ||
| Breast | 1,372 | 49.7 |
| Colorectal | 651 | 23.6 |
| Prostate | 285 | 10.3 |
| Lung | 453 | 16.4 |
| Advanced disease, n = 2,751 | 1,045 | 37.8 |
| Progressive disease, n = 2,745 | 374 | 13.5 |
| Metastasis to liver | 388 | 14.1 |
| Metastasis to bone | 453 | 16.4 |
| Metastatic sites | ||
| None | 1,629 | 59.0 |
| Single | 619 | 22.4 |
| Multiple | 513 | 18.6 |
| Community oncology institution | 2,489 | 90.2 |
| Prior systemic therapy | 1,676 | 60.7 |
| Prior radiation therapy, n = 2,739 | 1,140 | 41.3 |
| Patient currently receiving treatment | 2,065 | 74.8 |
| Patient currently receiving radiation therapy, n = 2,738 | 167 | 6.0 |
| No. of medicines currently taking, n = 2,496 | ||
| 0-4 | 816 | 32.7 |
| 5-9 | 1,073 | 43.0 |
| ≥10 | 607 | 24.3 |
| History of depression, n = 2,757 | 786 | 28.5 |
| Accompaniment to the visit, n = 2,747 | 1,516 | 55.2 |
| Participation in support group, n = 2,757 | 188 | 6.8 |
| Receiving counseling service, n = 2,756 | 275 | 10.0 |
| Bothered by side effects of pain and other symptom treatment, n = 2,746 | 1,596 | 58.1 |
Abbreviations: ECOG, Eastern Cooperative Oncology Group; QOL, quality of life.
Fig A1.
Change in pain severity by change in pain management between two visits in each patient group defined by pain level at initial assessment. A-A: adequately treated in both visits; A-U: adequately treated at initial, undertreated at follow-up; U-A: undertreated at initial, adequately treated at follow-up; U-U: undertreated in both visits; M: missing pain treatment data in at least one visit. Fisher's exact test was used to assess the overall association between pain management change (A-A, A-U, U-A, and U-U) and pain severity change; P < .001 for each patient group defined by initial pain level. χ2 test was used to compare the proportion of pain relief between patients with pain management of U-A and other patients (P < .001 for each patient group defined by baseline pain level) and to compare the proportion of pain worsening between patients with pain management of A-U and other patients (P < .001 for each patient group).
Footnotes
Supported in part by grants to the Eastern Cooperative Oncology Group from the National Cancer Institute of the National Institutes of Health, including Grants No. U10 CA37403 and U10 CA17145. Additional support comes from Grant No. R01 CA026582 to C.S.C. and MD Anderson Cancer Center Support Grant No. P30 CA016672 to R.A. DePinho.
Presented in part at the Annual Meeting of the Multinational Association of Supportive Care in Cancer, New York, NY, June 28-30, 2012.
The contents of this report are solely the responsibility of the authors and do not necessarily represent the official views of the National Cancer Institute or the National Institutes of Health. F.Z. and M.J.F. had full access to the data used in this analysis. F.Z. made the decision to submit the manuscript for publication.
Authors' disclosures of potential conflicts of interest and author contributions are found at the end of this article.
Clinical trial information: NCT00303914.
AUTHORS' DISCLOSURES OF POTENTIAL CONFLICTS OF INTEREST
The author(s) indicated no potential conflicts of interest.
AUTHOR CONTRIBUTIONS
Conception and design: Fengmin Zhao, James F. Cleary, Lynne I. Wagner, Michael J. Fisch
Collection and assembly of data: Fengmin Zhao, James F. Cleary, Michael J. Fisch
Data analysis and interpretation: Fengmin Zhao, Victor T. Chang, Charles Cleeland, Edith P. Mitchell, Lynne I. Wagner, Michael J. Fisch
Manuscript writing: All authors
Final approval of manuscript: All authors
REFERENCES
- 1.Cleeland CS, Gonin R, Hatfield AK, et al. Pain and its treatment in outpatients with metastatic cancer. N Engl J Med. 1994;330:592–596. doi: 10.1056/NEJM199403033300902. [DOI] [PubMed] [Google Scholar]
- 2.Fainsinger RL, Nekolaichuk C, Lawlor P, et al. An international multicentre validation study of a pain classification system for cancer patients. Eur J Cancer. 2010;46:2896–2904. doi: 10.1016/j.ejca.2010.04.017. [DOI] [PubMed] [Google Scholar]
- 3.Wilson KG, Chochinov HM, Allard P, et al. Prevalence and correlates of pain in the Canadian National Palliative Care Survey. Pain Res Manag. 2009;14:365–370. doi: 10.1155/2009/251239. [DOI] [PMC free article] [PubMed] [Google Scholar]
- 4.Breivik H, Cherny N, Collett B, et al. Cancer-related pain: A pan-European survey of prevalence, treatment, and patient attitudes. Ann Oncol. 2009;20:1420–1433. doi: 10.1093/annonc/mdp001. [DOI] [PubMed] [Google Scholar]
- 5.van den Beuken-van Everdingen MH, de Rijke JM, Kessels AG, et al. Prevalence of pain in patients with cancer: A systematic review of the past 40 years. Ann Oncol. 2007;18:1437–1449. doi: 10.1093/annonc/mdm056. [DOI] [PubMed] [Google Scholar]
- 6.Apolone G, Corli O, Caraceni A, et al. Pattern and quality of care of cancer pain management: Results from the Cancer Pain Outcome Research Study Group. Br J Cancer. 2009;100:1566–1574. doi: 10.1038/sj.bjc.6605053. [DOI] [PMC free article] [PubMed] [Google Scholar]
- 7.Deandrea S, Montanari M, Moja L, et al. Prevalence of undertreatment in cancer pain. A review of published literature. Ann Oncol. 2008;19:1985–1991. doi: 10.1093/annonc/mdn419. [DOI] [PMC free article] [PubMed] [Google Scholar]
- 8.Fisch MJ, Lee JW, Weiss M, et al. Prospective, observational study of pain and analgesic prescribing in medical oncology outpatients with breast, colorectal, lung, or prostate cancer. J Clin Oncol. 2012;30:1980–1988. doi: 10.1200/JCO.2011.39.2381. [DOI] [PMC free article] [PubMed] [Google Scholar]
- 9.Zhu J, Davis RB, Stuver SO, et al. A longitudinal study of pain variability and its correlates in ambulatory patients with advanced stage cancer. Cancer. 2012;118:6278–6286. doi: 10.1002/cncr.27673. [DOI] [PubMed] [Google Scholar]
- 10.Wang HL, Kroenke K, Wu J, et al. Cancer-related pain and disability: A longitudinal study. J Pain Symptom Manage. 2011;42:813–821. doi: 10.1016/j.jpainsymman.2011.02.019. [DOI] [PMC free article] [PubMed] [Google Scholar]
- 11.Gaskin DJ, Richard P. The economic costs of pain in the United States. J Pain. 2012;13:715–724. doi: 10.1016/j.jpain.2012.03.009. [DOI] [PubMed] [Google Scholar]
- 12.Wagner-Johnston ND, Carson KA, Grossman SA. High outpatient pain intensity scores predict impending hospital admissions in patients with cancer. J Pain Symptom Manage. 2010;39:180–185. doi: 10.1016/j.jpainsymman.2009.06.012. [DOI] [PubMed] [Google Scholar]
- 13.Fortner BV, Okon TA, Portenoy RK. A survey of pain-related hospitalizations, emergency department visits, and physician office visits reported by cancer patients with and without history of breakthrough pain. J Pain. 2002;3:38–44. doi: 10.1054/jpai.2002.27136. [DOI] [PubMed] [Google Scholar]
- 14.Dworkin RH, Turk DC, Peirce-Sandner S, et al. Considerations for improving assay sensitivity in chronic pain clinical trials: IMMPACT recommendations. Pain. 2012;153:1148–1158. doi: 10.1016/j.pain.2012.03.003. [DOI] [PubMed] [Google Scholar]
- 15.Patrick DL, Ferketich SL, Frame PS, et al. National Institutes of Health State-of-the-Science Conference Statement: Symptom Management in Cancer—Pain, Depression, and Fatigue, July 15-17, 2002. J Natl Cancer Inst. 2003;95:1110–1117. doi: 10.1093/jnci/djg014. [DOI] [PubMed] [Google Scholar]
- 16.Farrar JT, Young JP, LaMoreaux L, et al. Clinical importance of change in chronic pain intensity measured on an 11-point numerical pain rating scale. Pain. 2001;94:149–158. doi: 10.1016/S0304-3959(01)00349-9. [DOI] [PubMed] [Google Scholar]
- 17.Anderson KO. Role of cutpoints: Why grade pain intensity? Pain. 2005;113:5–6. doi: 10.1016/j.pain.2004.10.024. [DOI] [PubMed] [Google Scholar]
- 18.Farrar JT. Cut-points for the measurement of pain: The choice depends on what you want to study. Pain. 2010;149:163–164. doi: 10.1016/j.pain.2010.03.013. [DOI] [PubMed] [Google Scholar]
- 19.Serlin RC, Mendoza TR, Nakamura Y, et al. When is cancer pain mild, moderate or severe? Grading pain severity by its interference with function. Pain. 1995;61:277–284. doi: 10.1016/0304-3959(94)00178-H. [DOI] [PubMed] [Google Scholar]
- 20.Fainsinger RL, Nekolaichuk CL, Lawlor PG, et al. A multicenter study of the revised Edmonton Staging System for classifying cancer pain in advanced cancer patients. J Pain Symptom Manage. 2005;29:224–237. doi: 10.1016/j.jpainsymman.2004.05.008. [DOI] [PubMed] [Google Scholar]
- 21.Agresti A. Categorical Data Analysis. New York, NY: Wiley; 1990. [Google Scholar]
- 22.Armitage P. Tests for linear trends in proportions and frequencies. Biometrics. 1955;11:375–386. [Google Scholar]
- 23.Williams RL. A note on robust variance estimation for cluster-correlated data. Biometrics. 2000;56:645–646. doi: 10.1111/j.0006-341x.2000.00645.x. [DOI] [PubMed] [Google Scholar]
- 24.Yennurajalingam S, Kang JH, Hui D, et al. Clinical response to an outpatient palliative care consultation in patients with advanced cancer and cancer pain. J Pain Symptom Manage. 2012;44:340–350. doi: 10.1016/j.jpainsymman.2011.09.014. [DOI] [PubMed] [Google Scholar]
- 25.Wang HL, Kroenke K, Wu J, et al. Predictors of cancer-related pain improvement over time. Psychosom Med. 2012;74:642–647. doi: 10.1097/PSY.0b013e3182590904. [DOI] [PMC free article] [PubMed] [Google Scholar]
- 26.Fukshansky M, Are M, Burton AW. The role of opioids in cancer pain management. Pain Pract. 2005;5:43–53. doi: 10.1111/j.1533-2500.2005.05106.x. [DOI] [PubMed] [Google Scholar]
- 27.Ripamonti CI, Bandieri E, Roila F. Management of cancer pain: ESMO Clinical Practice Guidelines. Ann Oncol. 2011;22(suppl 6):vi69–vi77. doi: 10.1093/annonc/mdr390. [DOI] [PubMed] [Google Scholar]
- 28.World Health Organization. Cancer Pain Relief. ed 2. Geneva, Switzerland: WHO office of Publication; 1996. [Google Scholar]
- 29.Ward SE, Goldberg N, Miller-McCauley V, et al. Patient-related barriers to management of cancer pain. Pain. 1993;52:319–324. doi: 10.1016/0304-3959(93)90165-L. [DOI] [PubMed] [Google Scholar]
- 30.Caraceni A, Hanks G, Kaasa S, et al. Use of opioid analgesics in the treatment of cancer pain: Evidence-based recommendations from the EAPC. Lancet Oncol. 2012;13:e58–e68. doi: 10.1016/S1470-2045(12)70040-2. [DOI] [PubMed] [Google Scholar]
- 31.Rustøen T, Valeberg BT, Kolstad E, et al. The PRO-SELF pain control program improves patients' knowledge of cancer pain management. J Pain Symptom Manage. 2012;44:321–330. doi: 10.1016/j.jpainsymman.2011.09.015. [DOI] [PubMed] [Google Scholar]
- 32.Miaskowski C, Dodd M, West C, et al. Randomized clinical trial of the effectiveness of a self-care intervention to improve cancer pain management. J Clin Oncol. 2004;22:1713–1720. doi: 10.1200/JCO.2004.06.140. [DOI] [PubMed] [Google Scholar]
- 33.Bland JM, Altman DG. Statistic Notes: Regression towards the mean. BMJ. 1994;308:1499. doi: 10.1136/bmj.308.6942.1499. [DOI] [PMC free article] [PubMed] [Google Scholar]
- 34.Barnett A, van den Plos JC, Dobson AJ. Regression to the mean: What it is and how to deal with it. Int J Epidemiol. 2005;34:215–220. doi: 10.1093/ije/dyh299. [DOI] [PubMed] [Google Scholar]
- 35.Fainsinger RL, Fairchild A, Nekolaichuk C, et al. Is pain intensity a predictor of the complexity of cancer pain management? J Clin Oncol. 2009;27:585–590. doi: 10.1200/JCO.2008.17.1660. [DOI] [PubMed] [Google Scholar]
- 36.Torrance N, Ferguson JA, Afolabi E, et al. Neuropathic pain in the community: More under-treated than refractory? Pain. 2013;154:690–699. doi: 10.1016/j.pain.2012.12.022. [DOI] [PMC free article] [PubMed] [Google Scholar]
- 37.Fainsinger RL, Nekolaichuk CL. Cancer pain assessment: Can we predict the need for specialist input? Eur J Cancer. 2008;44:1072–1077. doi: 10.1016/j.ejca.2008.02.038. [DOI] [PubMed] [Google Scholar]