

Abstract
Background/Aims
The associations between major depression and chronic kidney disease (CKD) in patients with diabetes are incompletely characterized. Depressed patients with diabetes are known to have worse diabetes self-care, but it is not known whether this mediates the association between depression and CKD in this population.
Methods
We conducted a cross-sectional study of the associations between major depressive symptoms and CKD in the Pathways Study (N = 4,082), an observational cohort of ambulatory diabetic patients from a managed care setting. Depression status was ascertained using the Patient Health Questionnaire-9 (PHQ-9). Stepwise logistic regression models examined the associations between depression and impaired eGFR (<60 ml/min/1.73 m2) or microalbuminuria, after adjustment for demographics, CKD risk factors, and diabetes self-care variables.
Results
Clinically significant depression symptoms (PHQ-9 ≥10) were associated with a greater risk of microalbuminuria after adjustment for demographic variables (OR 1.54, 95% CI 1.21-1.95) and traditional CKD risk factors (OR 1.36, 95% CI 1.04-1.77); this association persisted after additional adjustment for diabetes self-care (OR 1.34, 95% CI 1.02-1.75). Depression was not associated with impaired eGFR in any of the models.
Conclusion
In this cohort of diabetic subjects, clinically significant depression symptoms were associated with microalbuminuria, which could not be entirely explained by differences in diabetes self-care.
Keywords: CKD, depression, diabetes mellitus, self-care
Introduction
Major depression is the most common psychiatric disorder in patients with end-stage renal disease (ESRD), with an estimated prevalence ranging from 20 to 25% [1]. Depression is associated with a 30-48% increased risk of mortality in ESRD after adjustment for age, race, socioeconomic status, and medical comorbidities [2, 3]. Similarly, in patients with earlier stages of chronic kidney disease (CKD), depression is common [4, 5] and associated with adverse outcomes including hospitalizations [6, 7], incident ESRD [6], and cardiovascular [7] or all-cause death [8]. However, the mechanisms by which depression is associated with adverse renal outcomes are not well characterized.
Patients with diabetes are twice as likely to be depressed compared to their nondiabetic counterparts [9]. Comorbid depression with diabetes is associated with poorer glycemic control [10], physical functioning [11], and medication adherence [11-13]. Furthermore, depression is associated with worse diabetes self-care including unhealthy diet and lack of exercise [11-13]. Since diabetes self-care is an essential component of diabetes management to prevent end-organ complications [14-17], poor self-care is a potential mechanism by which depression may be associated with CKD in this population, but this has not been examined in previous studies. The objective of this study is to assess the associations between major depression symptoms and CKD in an outpatient diabetic cohort and to determine whether these associations can be explained by differences in diabetes self-care.
Materials and Methods
Study Population
We performed a cross-sectional analysis of baseline data from the Pathways Study, which has been described previously [18, 19]. In brief, the Pathways Study is an epidemiologic survey of the prevalence and impact of depression on patients with diabetes at Group Health (GH), a large nonprofit health maintenance organization (HMO) in Washington and Idaho, USA. The study protocol was approved by the GH and University of Washington institutional review. 9,064 potential candidates for the study were identified from the GH diabetes registry of selected primary care clinics. Between 2001-2002, surveys were sent to these patients regarding demographics, diabetes history, and depression symptoms. 1,222 patients were ineligible for the study due to no diabetes, gestational diabetes, cognitive impairment, severe illness, deceased, disenrollment from GH, or language/hearing problems (Figure 1). 4,839 of the 7,842 eligible patients (61.7%) returned the survey of which 4,467 (92.3%) gave permission to link survey results with GH automated data. The current study excluded subjects with baseline end-stage renal disease (ESRD) (n = 67), missing baseline creatinine (n = 679), or missing depression status (n = 11), leaving 4,082 total subjects.
Figure 1.
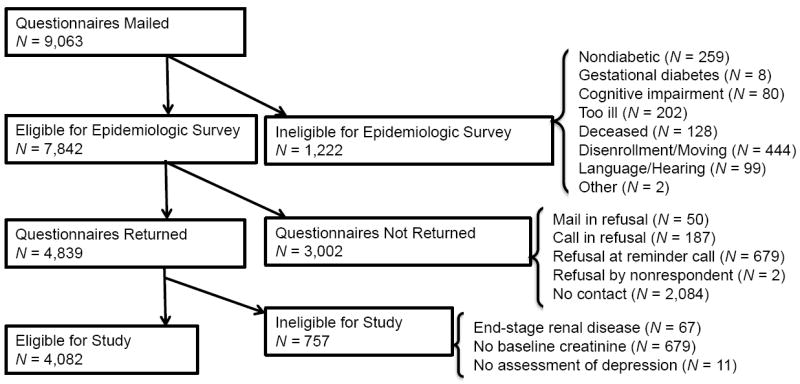
Pathways Study subject recruitment.
Measurements
Depression symptoms were ascertained using the Patient Health Questionnaire-9 (PHQ-9), which has been used in patients with CKD [20, 21]. Based on our previous research which showed that over 70% of primary care patients with diabetes and PHQ-9 scores ≥10 were ill with depressive symptoms for at least two years [22], we considered subjects with PHQ-9 scores ≥10, including a cardinal symptom of depression (depressed mood or anhedonia), to have probable major depression.
Sociodemographic information and diabetes history were self-reported on the baseline survey. Hypertension was identified by International Classification of Diseases, Ninth Revision diagnosis codes [23]. Body mass index (BMI) was calculated from self-reported height and weight (kg/m2). Laboratory test results were obtained from automated GH data. Given the high frequency of missing low-density lipoprotein (LDL) values (33.7%), multiple imputation for missing values (using age, sex, race/ethnicity, education, smoking, CKD stage, hypertension, hemoglobin A1c, and BMI) was used for adjustment in regression models. Estimated glomerular filtration rate (eGFR) was estimated from CKD-EPI equations [24].
Diabetes self-care was assessed using the modified Summary of Diabetes Self-Care Activities (SDSCA), a brief questionnaire that asks how many days per week an activity was performed [25]. Each self-care domain is given a score based on the average of two questions regarding that domain (Table 1). Scores range from 0 to 7 with higher scores indicating greater compliance with that activity. The SDSCA has been shown to be a reliable and valid measure of adherence to diabetes self-care in observational and interventional studies [26].
Table 1.
Selected questions from the Summary of Diabetes Self-Care Activities (SDSCA)
| Self-care domain | SDSCA Question |
|---|---|
| General diet | On how many of the last SEVEN DAYS have you followed a healthful eating plan? |
| Think about the PAST MONTH. How may days PER WEEK, ON AVERAGE, have you followed your eating plan? | |
| Special diet | On how many of the last SEVEN DAYS did you eat five or more servings of fruits and vegetables? |
| On how many of the last SEVEN DAYS did you eat high fat foods such as red meat or whole-fat dairy products? | |
| Exercise | On how many of the last SEVEN DAYS did you participate in at least 30 minutes of physical activity? (This means 30 minutes of continuous activity, including walking). |
| On how many of the last SEVEN DAYS did you participate in a specific exercise session (such as swimming, walking, biking) other than what you do around the house or as part of your work? | |
| Blood glucose testing | On how many of the last SEVEN DAYS did you test your blood sugar? |
| On how many of the last SEVEN DAYS did you test your blood sugar the number of times recommended by your health care provider? | |
| Foot care | On how many of the last SEVEN DAYS did you check your feet? |
| On how many of the last SEVEN DAYS did you inspect the inside of your shoes? |
Outcomes
Primary outcomes were differences by depression status in the baseline prevalence of impaired eGFR (<60 ml/min/1.73 m2) or microalbuminuria (urine albumin to creatinine ratio (UACR) >30 mg/g).
Statistical Analyses
Statistical analyses were performed using Stata version 12 (StataCorp, College Station, TX, USA). Significant differences were determined using independent t tests for continuous variables and χ2 tests for categorical variables. Due to skewed distributions, medians for UACR and diabetes duration were compared using the Mann-Whitney test. Stepwise logistic regression models were used to determine associations between major depression and each outcome. Model 1 adjusted for demographic variables selected a priori (age, sex, and race/ethnicity) or on the basis of being a potential confounder due to its associations with the primary predictor and outcomes (marital status). Model 2 additionally adjusted for established traditional CKD risk factors (smoking, BMI, hemoglobin A1c, and LDL); hypertension was not included as a covariate as this variable was based on ICD-9 codes only and could not discriminate between differing degrees of blood pressure control. Model 3 included the addition of self-care variables based on SDSCA scores. Interactions between depression, age, and sex were explored but were not significant (P >0.05). Sensitivity analyses in the subset of subjects with type 2 diabetes yielded similar results as in the entire cohort, therefore results are presented for the whole cohort. Furthermore, linear regression models with eGFR as the primary outcome also yielded similar results to our original analyses.
Results
Pathways Cohort Characteristics
Of the 4,082 total subjects, 474 (11.6%) had symptoms of major depression. Depressive symptoms were associated with younger age, female sex, unmarried status, smoking, type 1 diabetes, obesity, higher mean hemoglobin A1c (8.2 ± 1.7 versus 7.8 ± 1.5%, P <0.001), and higher PHQ-9 scores (17.2 ± 3.9 versus 4.3 ± 3.8, P <0.001); there was no difference in LDL levels or prevalence of hypertension by depression status (Table 2). Based on SDSCA scores, depressed subjects were less adherent with recommended diet (3.7 ± 2.1 versus 4.8 ± 2.0 days per week of following a general diet, P <0.001; 3.4 ± 1.6 versus 4.0 ± 1.6 days per week of following a specific diet, P <0.001) and exercise (2.0 ± 2.0 versus 2.8 ± 2.2 days per week, P <0.001) than nondepressed subjects. There was no difference between groups in adherence to home blood glucose monitoring or foot care.
Table 2.
Pathways Study cohort characteristics by depression status.
| Major Depression (N = 474) | No Major Depression (N = 3,608) | P | |
|---|---|---|---|
| Age (years) | 59.7 (13.7) | 64.4 (13.0) | <0.001 |
| Male (%) | 193 (40.7) | 1,884 (52.2) | <0.001 |
| Race | 0.06 | ||
| Non-Hispanic White (%) | 355 (74.9) | 2,769 (76.8) | |
| Non-Hispanic Black (%) | 49 (10.3) | 293 (8.1) | |
| Asian (%) | 31 (6.5) | 316 (8.8) | |
| Other (%) | 39 (8.2) | 230 (6.4) | |
| Married (%) | 269 (57.5) | 2,385 (66.8) | <0.001 |
| >High school education (%) | 331 (71.0) | 2,674 (75.3) | 0.05 |
| >20K salary (%) | 213 (53.8) | 1,610 (56.6) | 0.3 |
| Smoker (%) | 71 (15.2) | 265 (7.5) | <0.001 |
| Type 1 diabetes (%) | 67 (14.2) | 385 (10.7) | 0.02 |
| Duration diabetes (years) | 7 (3-13) | 7 (3-13) | 0.4 |
| Hemoglobin A1c (%) | 8.2 (1.7) | 7.8 (1.5) | <0.001 |
| Creatinine (mg/dL) | 1.02 (0.44) | 1.03 (0.39) | 0.5 |
| eGFR (mL/min/1.73 m2) | 76.7 (23.7) | 73.7 (22.0) | 0.01 |
| UACR (mg/g) | 18 (6-66) | 13 (5-43) | 0.01 |
| Microalbuminuria (%) | 139 (39.6) | 827 (32.1) | 0.005 |
| eGFR <60 (%) | 116 (24.5) | 1,008 (27.9) | 0.1 |
| eGFR <60 or microalbuminuria (%) | 220 (46.4) | 1,558 (43.2) | 0.2 |
| Hypertension (%) | 216 (47.6) | 1,531 (44.7) | 0.2 |
| ACE inhibitor (%) | 284 (62.6) | 2,107 (61.5) | 0.7 |
| LDL (mg/dL) | 114.2 (35.7) | 110.7 (34.8) | 0.1 |
| Body mass index (kg/m2) | 34.6 (9.1) | 30.7 (6.8) | <0.001 |
| PHQ-9 score | 17.2 (3.9) | 4.3 (3.8) | <0.001 |
| SDSCA score | |||
| General diet | 3.7 (2.1) | 4.8 (2.0) | <0.001 |
| Special diet | 3.4 (1.6) | 4.0 (1.6) | <0.001 |
| Exercise | 2.0 (2.0) | 2.8 (2.2) | <0.001 |
| Blood glucose testing | 4.4 (2.7) | 4.2 (2.8) | 0.4 |
| Foot care | 3.3 (2.3) | 3.4 (2.4) | 0.6 |
Data are mean (standard deviation), median (interquartile range), or N (%).
eGFR = estimated glomerular filtration rate; UACR = urine albumin to creatinine ratio; ACE = angiotensin-converting enzyme; LDL = low-density lipoprotein; PHQ-9 = Patient Health Questionnaire-9; SDSCA = Summary of Diabetes Self-Care Activities.
eGFR <60 ml/min/1.73 m2
Although mean eGFR tended to be higher in subjects with major depression symptoms (76.7 ± 23.7 versus 73.7 ± 22.0 mL/min/1.73 m2, P = 0.01), the proportion of subjects with eGFR <60 mL/min/1.73 m2 was comparable between groups (24.5 versus 27.9%, P = 0.1). There was no association between major depression symptoms and impaired eGFR <60 mL/min/1.73 m2 in any of the logistic regression models (Table 3).
Table 3.
Logistic regression models for predictors of eGFR <60 mL/min/1.73 m2.
| Variable | Unadjusted | Model 1a | Model 2b | Model 3c | ||||
|---|---|---|---|---|---|---|---|---|
| OR (95% CI) | P | OR (95% CI) | P | OR (95% CI) | P | OR (95% CI) | P | |
| Major depression | 0.84 (0.67-1.04) | 0.1 | 1.24 (0.96-1.60) | 0.1 | 1.13 (0.86-1.50) | 0.4 | 1.07 (0.80-1.43) | 0.7 |
| Age (year) | 1.10 (1.09-1.11) | <0.001 | 1.11 (1.10-1.12) | <0.001 | 1.11 (1.09-1.12) | <0.001 | ||
| Female sex | 1.13 (0.96-1.33) | 0.2 | 1.10 (0.92-1.31) | 0.3 | 1.02 (0.85-1.23) | 0.8 | ||
| Race | 0.1 | 0.1 | 0.2 | |||||
| Non-Hispanic Black | 1.12 (0.84-1.51) | 1.09 (0.79-1.40) | 1.12 (0.80-1.56) | |||||
| Asian | 0.83 (0.61-1.12) | 0.81 (0.58-1.14) | 0.88 (0.62-1.24) | |||||
| Other | 0.66 (0.75-1.05) | 0.65 (0.42-1.01) | 0.65 (0.42-1.02) | |||||
| Married | 0.88 (0.75-1.05) | 0.2 | 0.89 (0.74-1.07) | 0.2 | 0.86 (0.71-1.04) | 0.1 | ||
| Smoker | 1.00 (0.71-1.44) | 0.9 | 0.95 (0.66-1.37) | 0.8 | ||||
| Body mass index (kg/m2) | 1.01 (1.00-1.03) | 0.04 | 1.01 (0.99-1.02) | 0.5 | ||||
| Hemoglobin A1c (%) | 1.01 (0.95-1.07) | 0.7 | 0.99 (0.93-1.05) | 0.8 | ||||
| LDL (mg/dL) | 1.00 (1.00-1.00) | 0.4 | 1.00 (1.00-1.00) | 0.7 | ||||
| General diet* | 1.05 (1.00-1.10) | 0.04 | ||||||
| Special diet* | 0.96 (0.91-1.02) | 0.2 | ||||||
| Exercise* | 0.90 (0.86-0.94) | <0.001 | ||||||
| Blood glucose testing* | 1.06 (1.02-1.09) | 0.001 | ||||||
| Foot care* | 1.03 (0.99-1.07) | 0.1 | ||||||
OR = odds ratio; LDL = low-density lipoprotein.
ORs for self-care variables are for each additional point on the Summary of Diabetes Self-Care Activities score, which corresponds with one additional day per week that the self-care activity was performed.
Adjusted for age, sex, race/ethnicity, and marital status.
Adjusted for age, sex, race/ethnicity, marital status, smoking, body mass index, hemoglobin A1c, and LDL.
Adjusted for age, sex, race/ethnicity, marital status, smoking, body mass index, hemoglobin A1c, LDL, and Summary of Diabetes Self-Care Activities scores.
Microalbuminuria
Depressive symptoms were associated with a greater prevalence of microalbuminuria (39.6 versus 32.1%, P = 0.005). In unadjusted logistic regression (Table 4), major depression symptoms were associated with 39% increased odds of microalbuminuria (95% CI 1.10-1.75); this association persisted after adjustment for demographic variables (OR 1.54, 95% CI 1.21-1.95), traditional CKD risk factors (OR 1.36, 95% CI 1.04-1.77), and diabetes self-care (OR 1.34, 95% CI 1.02-1.75).
Table 4.
Logistic regression models for predictors of microalbuminuria.**
| Variable | Unadjusted | Model 1a | Model 2b | Model 3c | ||||
|---|---|---|---|---|---|---|---|---|
| OR (95% CI) | P | OR (95% CI) | P | OR (95% CI) | P | OR (95% CI) | P | |
| Major depression | 1.39 (1.10-1.75) | 0.005 | 1.54 (1.21-1.95) | <0.001 | 1.36 (1.04-1.77) | 0.02 | 1.34 (1.02-1.75) | 0.04 |
| Age (year) | 1.02 (1.01-1.03) | <0.001 | 1.03 (1.02-1.04) | <0.001 | 1.03 (1.02-1.03) | <0.001 | ||
| Female sex | 0.79 (0.67-0.94) | 0.006 | 0.75 (0.62-0.90) | 0.002 | 0.72 (0.60-0.87) | 0.001 | ||
| Race | 0.3 | 0.1 | 0.1 | |||||
| Non-Hispanic Black | 1.16 (0.88-1.52) | 1.13 (0.84-1.54) | 1.08 (0.79-1.47) | |||||
| Asian | 1.09 (0.83-1.43) | 1.35 (1.00-1.82) | 1.37 (1.01-1.86) | |||||
| Other | 1.30 (0.96-1.77) | 1.33 (0.95-1.87) | 1.33 (0.94-1.86) | |||||
| Married | 0.82 (0.69-0.97) | 0.02 | 0.85 (0.70-1.02) | 0.09 | 0.85 (0.70-1.02) | 0.08 | ||
| Smoker | 1.06 (0.79-1.44) | 0.7 | 1.06 (0.79-1.44) | 0.7 | ||||
| Body mass index (kg/m2) | 1.03 (1.01-1.04) | <0.001 | 1.02 (1.01-1.04) | 0.001 | ||||
| Hemoglobin A1c (%) | 1.24 (1.18-1.31) | <0.001 | 1.23 (1.17-1.30) | <0.001 | ||||
| LDL (mg/dL) | 1.00 (1.00-1.00) | 0.7 | 1.00 (1.00-1.00) | 0.6 | ||||
| General diet* | 1.00 (0.95-1.05) | 0.9 | ||||||
| Special diet* | 1.01 (0.95-1.07) | 0.8 | ||||||
| Exercise* | 0.98 (0.94-1.02) | 0.3 | ||||||
| Blood glucose testing* | 1.02 (0.99-1.05) | 0.2 | ||||||
| Foot care* | 1.04 (1.01-1.08) | 0.03 | ||||||
OR = odds ratio; LDL = low-density lipoprotein.
ORs for self-care variables are for each additional point on the Summary of Diabetes Self-Care Activities score, which corresponds with one additional day per week that the self-care activity was performed.
Microalbuminuria was defined as a urine albumin to creatinine ratio >30 mg/g.
Adjusted for age, sex, race/ethnicity, and marital status.
Adjusted for age, sex, race/ethnicity, marital status, smoking, body mass index, hemoglobin A1c, and LDL.
Adjusted for age, sex, race/ethnicity, marital status, smoking, body mass index, hemoglobin A1c, LDL, and Summary of Diabetes Self-Care Activities scores.
Discussion
The current study found that in this primary care cohort of predominantly type 2 diabetic subjects, depressive symptoms were associated with a greater prevalence of microalbuminuria, but not impaired eGFR <60 mL/min/1.73 m2, after adjustment for traditional CKD risk factors. Furthermore, the association between depression symptoms and microalbuminuria persisted after adjustment for diabetes self-care activities, suggestive of other mediating pathways between depression and microalbuminuria besides diabetes self-care.
To our knowledge, this is the first study to evaluate the associations between major depression symptoms and CKD in a diabetic cohort. Our finding that depression symptoms are associated with microalbuminuria has not been previously reported, however other studies have established an association between depression and CKD based on impaired eGFR. Hedayati, et al found a 21% point prevalence of major depression amongst veterans with eGFR <90 mL/min/1.73 m2[4]. Similarly, the prevalence of at least moderate depressive symptoms was 26% amongst subjects with hypertensive CKD in the African American Study of Kidney Disease and Hypertension Cohort Study [5]. The Cardiovascular Health Study found that in their community-based cohort of elderly subjects, those with depressive symptoms had 19% greater odds of impaired eGFR (95% CI 1.01-1.40) compared to those without, after adjustment for demographics, clinical variables, and health behaviors [27]. Unlike the previous studies, we did not find that depression symptoms were associated with low eGFR, which may be related to the differing demographics between our community-based cohort and the other studies, or because of differences in the association between depression and diabetes-related CKD versus nondiabetic CKD.
Our study is also the first to examine the role of diabetes self-care as a potential mediator of depression and CKD. Diabetes self-care activities such as diet and exercise [15, 28, 29], blood glucose monitoring [16], and foot care [17] are associated with reductions in diabetes-related morbidity and mortality. Since depression is associated with poorer diabetes self-care [11-13], this may be a mediator between depression and CKD; however our results suggest that this is not the only mechanism by which depression affects CKD risk since depression symptoms remained predictive of microalbuminuria even after adjustment for multiple diabetes self-care variables.
There are several potential mechanisms besides diabetes self-care by which depression may be associated with CKD risk. Although we attempted to adjust for common cardiovascular risk factors, our models did not account for high blood pressure or medication nonadherence, both of which are known to be associated with depression [11-13, 30]. Depression is also associated with proinflammatory cytokines [31] and this proinflammatory state has been linked with an increased risk of diabetic complications including diabetic nephropathy [32]. Furthermore, depression is associated with hyperactivity of the hypothalamic-pituitary-adrenocortical axis and sympathetic nervous system, resulting in decreased insulin sensitivity [33]. Whether these biological mechanisms explain the link between depression and CKD in diabetes remains to be determined.
The strengths of this study include its large sample size and the assessment of multiple clinical and diabetes self-care variables. However, there are several limitations of this study to consider. Depression was assessed by a self-rated questionnaire, which may overestimate the presence of depression compared to the clinical interview [1]. Due to the cross-sectional nature of this study, unmeasured or residual confounding remains an issue. As previously mentioned, we did not have blood pressure results; although we did have access to ICD-9 codes for hypertension, the value of this variable is questionable since we could not differentiate between treated and untreated hypertension or well versus poorly controlled blood pressure. We used self-reported measures of diabetes self-care rather than objective measurements; although the SDSCA has been shown to be a reliable and valid measure of diabetes self-management [25], there may be systematic differences in how depressed subjects report self-care compared to nondepressed subjects. Furthermore, incomplete capture of diabetes self-care may account for the lack of attenuation when adjusting for these variables. Finally, the direction of the association between depression and microalbuminuria cannot be determined by this study. Our assumption is that depression is a risk factor for microalbuminuria, however the association may be bidirectional or depression and microalbuminuria may be consequences of another factor; in that regard, a longitudinal study is needed to better characterize these relationships.
Conclusions
In this cross-sectional study of diabetic subjects from a primary care setting, major depression symptoms were associated with microalbuminuria, but not impaired eGFR. This association could not be explained by differences in diabetes self-care. Our results suggest that alternative behavioral or biological mechanisms may play a role in mediating the association between depression and microalbuminuria in this population.
Acknowledgments
This study was supported by grants from the National Institutes of Health (RO1 DK 079745, T32 DK007467, MH41739, MH01643) and the American Kidney Fund Clinical Scientist in Nephrology Fellowship Program. We also thank Dr. Noel Weiss for reviewing this manuscript and the other investigators of the Pathways Study, without whom this research would not be possible.
References
- 1.Palmer S, Vecchio M, Craig JC, Tonelli M, Johnson DW, Nicolucci A, Pellegrini F, Saglimbene V, Logroscino G, Fishbane S, Strippoli GF. Prevalence of depression in chronic kidney disease: systematic review and meta-analysis of observational studies. Kidney Int. 2013 doi: 10.1038/ki.2013.77. [DOI] [PubMed] [Google Scholar]
- 2.Kimmel PL, Peterson RA, Weihs KL, Simmens SJ, Alleyne S, Cruz I, Veis JH. Multiple measurements of depression predict mortality in a longitudinal study of chronic hemodialysis outpatients. Kidney Int. 2000;57:2093–2098. doi: 10.1046/j.1523-1755.2000.00059.x. [DOI] [PubMed] [Google Scholar]
- 3.Lopes AA, Bragg J, Young E, Goodkin D, Mapes D, Combe C, Piera L, Held P, Gillespie B, Port FK. Depression as a predictor of mortality and hospitalization among hemodialysis patients in the United States and Europe. Kidney Int. 2002;62:199–207. doi: 10.1046/j.1523-1755.2002.00411.x. [DOI] [PubMed] [Google Scholar]
- 4.Hedayati SS, Minhajuddin AT, Toto RD, Morris DW, Rush AJ. Prevalence of major depressive episode in CKD. Am J Kidney Dis. 2009;54:424–432. doi: 10.1053/j.ajkd.2009.03.017. [DOI] [PMC free article] [PubMed] [Google Scholar]
- 5.Fischer MJ, Kimmel PL, Greene T, Gassman JJ, Wang X, Brooks DH, Charleston J, Dowie D, Thornley-Brown D, Cooper LA, Bruce MA, Kusek JW, Norris KC, Lash JP. Sociodemographic factors contribute to the depressive affect among African Americans with chronic kidney disease. Kidney Int. 2010;77:1010–1019. doi: 10.1038/ki.2010.38. [DOI] [PMC free article] [PubMed] [Google Scholar]
- 6.Hedayati SS, Minhajuddin AT, Afshar M, Toto RD, Trivedi MH, Rush AJ. Association between major depressive episodes in patients with chronic kidney disease and initiation of dialysis, hospitalization, or death. Jama. 2010;303:1946–1953. doi: 10.1001/jama.2010.619. [DOI] [PMC free article] [PubMed] [Google Scholar]
- 7.Fischer MJ, Kimmel PL, Greene T, Gassman JJ, Wang X, Brooks DH, Charleston J, Dowie D, Thornley-Brown D, Cooper LA, Bruce MA, Kusek JW, Norris KC, Lash JP. Elevated depressive affect is associated with adverse cardiovascular outcomes among African Americans with chronic kidney disease. Kidney Int. 2011;80:670–678. doi: 10.1038/ki.2011.153. [DOI] [PMC free article] [PubMed] [Google Scholar]
- 8.Young BA, Von Korff M, Heckbert SR, Ludman EJ, Rutter C, Lin EH, Ciechanowski PS, Oliver M, Williams L, Himmelfarb J, Katon WJ. Association of major depression and mortality in Stage 5 diabetic chronic kidney disease. Gen Hosp Psychiatry. 2010;32:119–124. doi: 10.1016/j.genhosppsych.2009.11.018. [DOI] [PMC free article] [PubMed] [Google Scholar]
- 9.Anderson RJ, Freedland KE, Clouse RE, Lustman PJ. The prevalence of comorbid depression in adults with diabetes: a meta-analysis. Diabetes Care. 2001;24:1069–1078. doi: 10.2337/diacare.24.6.1069. [DOI] [PubMed] [Google Scholar]
- 10.Lustman PJ, Anderson RJ, Freedland KE, de Groot M, Carney RM, Clouse RE. Depression and poor glycemic control: a meta-analytic review of the literature. Diabetes Care. 2000;23:934–942. doi: 10.2337/diacare.23.7.934. [DOI] [PubMed] [Google Scholar]
- 11.Ciechanowski PS, Katon WJ, Russo JE. Depression and diabetes: impact of depressive symptoms on adherence, function, and costs. Arch Intern Med. 2000;160:3278–3285. doi: 10.1001/archinte.160.21.3278. [DOI] [PubMed] [Google Scholar]
- 12.Lin EH, Katon W, Von Korff M, Rutter C, Simon GE, Oliver M, Ciechanowski P, Ludman EJ, Bush T, Young B. Relationship of depression and diabetes self-care, medication adherence, and preventive care. Diabetes Care. 2004;27:2154–2160. doi: 10.2337/diacare.27.9.2154. [DOI] [PubMed] [Google Scholar]
- 13.Gonzalez JS, Safren SA, Cagliero E, Wexler DJ, Delahanty L, Wittenberg E, Blais MA, Meigs JB, Grant RW. Depression, self-care, and medication adherence in type 2 diabetes: relationships across the full range of symptom severity. Diabetes Care. 2007;30:2222–2227. doi: 10.2337/dc07-0158. [DOI] [PMC free article] [PubMed] [Google Scholar]
- 14.Standards of medical care in diabetes--2012. Diabetes Care. 2012;35(Suppl 1):S11–63. doi: 10.2337/dc12-s011. [DOI] [PMC free article] [PubMed] [Google Scholar]
- 15.Hu FB, Stampfer MJ, Solomon C, Liu S, Colditz GA, Speizer FE, Willett WC, Manson JE. Physical activity and risk for cardiovascular events in diabetic women. Ann Intern Med. 2001;134:96–105. doi: 10.7326/0003-4819-134-2-200101160-00009. [DOI] [PubMed] [Google Scholar]
- 16.Martin S, Schneider B, Heinemann L, Lodwig V, Kurth HJ, Kolb H, Scherbaum WA. Self-monitoring of blood glucose in type 2 diabetes and long-term outcome: an epidemiological cohort study. Diabetologia. 2006;49:271–278. doi: 10.1007/s00125-005-0083-5. [DOI] [PubMed] [Google Scholar]
- 17.Singh N, Armstrong DG, Lipsky BA. Preventing foot ulcers in patients with diabetes. Jama. 2005;293:217–228. doi: 10.1001/jama.293.2.217. [DOI] [PubMed] [Google Scholar]
- 18.Katon W, Von Korff M, Lin E, Simon G, Ludman E, Bush T, Walker E, Ciechanowski P, Rutter C. Improving primary care treatment of depression among patients with diabetes mellitus: the design of the pathways study. Gen Hosp Psychiatry. 2003;25:158–168. doi: 10.1016/s0163-8343(03)00013-6. [DOI] [PubMed] [Google Scholar]
- 19.Young BA, Katon WJ, Von Korff M, Simon GE, Lin EH, Ciechanowski PS, Bush T, Oliver M, Ludman EJ, Boyko EJ. Racial and ethnic differences in microalbuminuria prevalence in a diabetes population: the pathways study. J Am Soc Nephrol. 2005;16:219–228. doi: 10.1681/ASN.2004030162. [DOI] [PubMed] [Google Scholar]
- 20.Odden MC, Whooley MA, Shlipak MG. Depression, stress, and quality of life in persons with chronic kidney disease: the Heart and Soul Study. Nephron Clin Pract. 2006;103:c1–7. doi: 10.1159/000090112. [DOI] [PMC free article] [PubMed] [Google Scholar]
- 21.Watnick S, Wang PL, Demadura T, Ganzini L. Validation of 2 depression screening tools in dialysis patients. Am J Kidney Dis. 2005;46:919–924. doi: 10.1053/j.ajkd.2005.08.006. [DOI] [PubMed] [Google Scholar]
- 22.Katon WJ, Von Korff M, Lin EH, Simon G, Ludman E, Russo J, Ciechanowski P, Walker E, Bush T. The Pathways Study: a randomized trial of collaborative care in patients with diabetes and depression. Archives of general psychiatry. 2004;61:1042–1049. doi: 10.1001/archpsyc.61.10.1042. [DOI] [PubMed] [Google Scholar]
- 23.L S, editor. Physician ICD-9-CM. Salt Lake City, UT: Medicode Publications; 1999. [Google Scholar]
- 24.Levey AS, Stevens LA, Schmid CH, Zhang YL, Castro AF, 3rd, Feldman HI, Kusek JW, Eggers P, Van Lente F, Greene T, Coresh J. A new equation to estimate glomerular filtration rate. Ann Intern Med. 2009;150:604–612. doi: 10.7326/0003-4819-150-9-200905050-00006. [DOI] [PMC free article] [PubMed] [Google Scholar]
- 25.Toobert DJ, Hampson SE, Glasgow RE. The summary of diabetes self-care activities measure: results from 7 studies and a revised scale. Diabetes Care. 2000;23:943–950. doi: 10.2337/diacare.23.7.943. [DOI] [PubMed] [Google Scholar]
- 26.Carey MP, Jorgensen RS, Weinstock RS, Sprafkin RP, Lantinga LJ, Carnrike CL, Jr, Baker MT, Meisler AW. Reliability and validity of the appraisal of diabetes scale. Journal of behavioral medicine. 1991;14:43–51. doi: 10.1007/BF00844767. [DOI] [PubMed] [Google Scholar]
- 27.Kop WJ, Seliger SL, Fink JC, Katz R, Odden MC, Fried LF, Rifkin DE, Sarnak MJ, Gottdiener JS. Longitudinal association of depressive symptoms with rapid kidney function decline and adverse clinical renal disease outcomes. Clin J Am Soc Nephrol. 2011;6:834–844. doi: 10.2215/CJN.03840510. [DOI] [PMC free article] [PubMed] [Google Scholar]
- 28.Gregg EW, Gerzoff RB, Caspersen CJ, Williamson DF, Narayan KM. Relationship of walking to mortality among US adults with diabetes. Arch Intern Med. 2003;163:1440–1447. doi: 10.1001/archinte.163.12.1440. [DOI] [PubMed] [Google Scholar]
- 29.Wing RR. Long-term effects of a lifestyle intervention on weight and cardiovascular risk factors in individuals with type 2 diabetes mellitus: four-year results of the Look AHEAD trial. Arch Intern Med. 2010;170:1566–1575. doi: 10.1001/archinternmed.2010.334. [DOI] [PMC free article] [PubMed] [Google Scholar]
- 30.Zhang J, Zhou B, Wang C, Li C, Zhao W, Li M, Lou T. Depression is associated with non-dipping blood pressure in patients with chronic kidney disease. Heart. 2012;98:E278. [Google Scholar]
- 31.Stewart JC, Rand KL, Muldoon MF, Kamarck TW. A prospective evaluation of the directionality of the depression-inflammation relationship. Brain, behavior, and immunity. 2009;23:936–944. doi: 10.1016/j.bbi.2009.04.011. [DOI] [PMC free article] [PubMed] [Google Scholar]
- 32.Goldberg RB. Cytokine and cytokine-like inflammation markers, endothelial dysfunction, and imbalanced coagulation in development of diabetes and its complications. J Clin Endocrinol Metab. 2009;94:3171–3182. doi: 10.1210/jc.2008-2534. [DOI] [PubMed] [Google Scholar]
- 33.Musselman DL, Betan E, Larsen H, Phillips LS. Relationship of depression to diabetes types 1 and 2: epidemiology, biology, and treatment. Biological psychiatry. 2003;54:317–329. doi: 10.1016/s0006-3223(03)00569-9. [DOI] [PubMed] [Google Scholar]