

Abstract
The effect of mouse resistin on hepatic insulin resistance in vivo and in vitro, and its possible molecular mechanism were examined. Focusing on liver glycogen metabolism and gluconeogenesis, which are important parts of glucose metabolism, in primary cultures of rat hepatocytes we found that glycogen content was significantly lower (P<0.05) after treatment with recombinant murine resistin only in the presence of insulin plus glucose stimulation. Protein levels of factors in the insulin signaling pathway involved in glycogen synthesis were examined by Western blot analysis, with the only significant change observed being the level of phosphorylated (at Ser 9) glycogen synthase kinase-3β (GSK-3β) (P<0.001). No differences in the protein levels for the insulin receptor β (IRβ), insulin receptor substrates (IRS1 and IRS2), phosphatidylinositol 3-kinase (PI3K), protein kinase B (Akt) or their phosphorylated forms were observed between control and resistin treated primary rat hepatocytes. In a mouse model with high liver-specific expression of resistin, fasting blood glucose levels and liver glycogen content changed. Fasting blood glucose levels were significantly higher (P<0.001) in the model mice, compared to the control mice, while the glycogen content of the liver tissue was about 60% of that of the control mice (P<0.05). The gluconeogenic response was not altered between the experimental and control mice. The level of phosphorylated GSK-3β in the liver tissue was also decreased (P<0.05) in the model mice, consistent with the results from the primary rat hepatocytes. Our results suggests that resistin reduces the levels of GSK-3β phosphorylated at Ser 9 leading to impaired hepatic insulin action in primary rat hepatocytes and in a mouse model with high liver-specific expression of resistin.
Keywords: Resistin, Insulin resistance, Glycogen synthase kinase-3β (GSK-3β), Liver
1. Introduction
Insulin resistance characterizes type 2 diabetes and the risk of developing this disease increases with obesity (Kawano et al. 1992). Resistin, a hormone secreted primarily by adipocytes in rodents, is a potential link between obesity and type 2 diabetes. Serum resistin levels are elevated in diet-induced and genetically obese mice (Steppan et al. 2001). Treatment of normal mice with recombinant resistin impairs both glucose tolerance and insulin action; conversely, administration of anti-resistin antibody decreases blood sugar levels and improves insulin action in mice with diet-induced obesity. Resistin antagonize several insulin actions in vitro, resulting in decreased basal and insulin-stimulated glucose uptake, oxidation and glycogen synthesis. For example, recombinant resistin attenuates insulin-stimulated glucose uptake by inducing the expression of SOCS3 in 3T3-L1 adipocytes (Steppan et al. 2001; Steppan et al. 2005). Basal and insulin-stimulated glucose uptake, oxidation and glycogen synthesis in L6 rat skeletal muscle cells were also decreased in the presence of resistin (Palanivel et al. 2006). In addition, resistin has been shown to impair glucose-induced insulin secretion and induce insulin resistance in the islet β-cells of mice, by increasing SOCS3 expression and decreasing the phosphorylation level of Akt (Nakata et al. 2007). Resistin has also been observed to reduce insulin action in human hepatocytes where human resistin impairs intracellular insulin signaling (Zhou et al. 2007; Sheng et al. 2008; Costandi et al. 2011).
The liver is an important organ in the regulation of plasma glucose homeostasis, with hepatic insulin resistance playing an essential role in the development of type 2 diabetes (Taniguchi et al. 2005). The aim of our study, using in vitro and in vivo approaches, was to determine whether resistin induces hepatic insulin resistance. To examine this we focused on liver glycogen metabolism and gluconeogenesis, which are important parts of glucose metabolism, and the levels of proteins, and their phosphorylated forms, involved in insulin signaling. First, we treated primary rat hepatocytes with high concentrations of recombinant murine resistin to determine the effect of resistin on liver glycogen synthesis and gluconeogenesis and insulin signaling pathway protein levels. Second, we constructed a mouse model that expresses high levels of resistin in liver to investigate the in vivo actions of resistin on liver glucose metabolism.
2. Materials and Methods
2.1 Materials
Collagenase Type IV (17104-019) and Dulbecco’s Modified Eagle Medium (DMEM, 12100-046) were obtained from Life Technologies. Rat Tail Collagen Type I (08-115) was from Millipore. Certified Foetal Bovine Serum (04-001-1A) was obtained from Biological Industries. DMEM without glucose or sodium pyruvate (D5030) and insulin (15500) were from Sigma. The recombinant murine resistin (450-28) was purchased from PeproTech. EnzyChromTM Glucose Assay Kit (EBGL-100) was from BioAssay Systems. Bovine serum albumin (BSA, fraction V) (0332) was purchased from Amresco. Primary antibodies were from Cell Signaling Technology, Santa Cruz biotechnology and Abcam. Horseradish peroxidase conjugated secondary antibodies were purchased from ZSGB-BIO (China).
2.2 Cell culture
Hepatocytes were isolated from male Sprague Dawley rats (180~220 g) by the two-step in situ collagenase perfusion method (Seglen 1976). Isolated hepatocytes were grown in Dulbecco’s Modified Eagle Medium (DMEM) supplemented with 20% (v/v) FBS and 1% antibiotic solution (100 units/ml penicillin, 100μg/ml streptomycin) in a humidified atmosphere of 5% CO2 at 37°C for 5 h, as previously described (Aiston et al. 2001). After cells attached to the plates, media was changed to DMEM containing recombinant resistin (50 nM) for 24 h, then treated with 100 nM insulin, with or without 30 mM glucose, for 30 min. Cell lysates were prepared and analyzed by Western blot as described below.
2.3 Detection of glycogen content
Primary rat hepatocytes were treated with resistin for 24 h before the addition of insulin, with or without glucose stimulation, for 30 min as previously described (Yang et al. 2009). The glycogen content of the hepatocytes was determined by the anthrone-reagent method (Carroll et al. 1956). First, incubation media was discarded and hepatocytes were washed 3 times to remove all traces of extracellular glucose. Cells were lysed with 30% KOH, incubated in boiling water for 20 min, and then the lysates were centrifuged at 4000×g for 15 min, with the supernatants discarded. Distilled water, 0.5 mL, and 1 mL of 0.2% anthrone were added to the pellets, which were then boiled again for 20 min. The optical density of the solution was measured at 620 nm in a spectrophotometer for the blue compound generated by the reaction.
The same method was used for the detection of glycogen content for liver tissue from the mouse model with high liver-specific expression of resistin. About 100 mg of liver tissues was used in the assay. Liver tissue was acquired from mice 48 h after injection with the recombinant murine resistin plasmid as described below.
2.4 Resistin over-expression vector construction
The mouse resistin coding sequence was obtained by PCR amplification from cDNA. Sense (GTGAATTCGGAGCTAATACCCAGAAC) and anti-sense (CTGGTACCTCAACTGACCGACATGA) primers containing KpnI and EcoRI restriction endonuclease sites, respectively, were designed based on the RefSeq sequence (NM_022984.4; GenBank). The sequence generated by PCR was confirmed by sequencing. The PCR product was digested with EcoRI and KpnI and subcloned into the corresponding sites of the expression plasmid pCAG-GFP (Addgene, #11150) and the resulting recombinant murine resistin plasmid was named pCAG-GFP-Res. To confirm that the pCAG-GFP-Res plasmid produced secreted resistin, we transfected HepG2 cells and detected secreted resistin in the media by Western blot (results not shown).
2.5 Western blot analysis
To prepare lysates for immunoblotting, hepatocytes were lysed in a buffer containing 50 mM Tris-HCL (pH 8.0), 150 mM NaCl, 1 mM EDTA, 0.1% SDS, 1% TritonX-100, and 100 mg/ml PMSF. Protein concentration was measured using the Bradford reagent (Bradford 1976). Samples were diluted 1:1 (v/v) with 2×SDS sample buffer (62.5 mM Tris-HCL [pH 6.8], 20% glycerol, 2% SDS, 10% β Mercaptoethanol and 0.1% Bromophenol blue). Equal amounts of liver proteins were resolved by SDS-PAGE (8%), and transferred to PVDF membranes. Membranes were blocked with 5% non-fat dry milk in TBST (50 mM Tris-Base, pH 7.5, 150 mM NaCl and 0.1% Tween-20) for 2 h, and then incubated with primary antibodies in 5% BSA (IRβ at 1:1000 dilution, IRS1, IRS2, PI3Kp85, Akt, SOCS3 at 1:1000 dilution; phospho-IR β-Tyr1150/1151, phospho-IRS1-S307, phospho-Akt-S473 1:500; phospho-GSK-3β 1:2000) overnight at 4°C. Membranes were then washed three times with TBST, and incubated with goat anti-rabbit HRP-conjugated secondary antibodies at a 1:1000 dilution for 2 h at room temperature, with the secondary antibodies detected using the enhanced ECL chemiluminescence method. Images were generated and quantified by Chemi DOC XRS (BIO-RAD, USA).
2.6 Construction of a mouse model with high liver-specific expression of resistin
BALB/c mice (~20 g), male, were injected with the pCAG-GFP or pCAG-GFP-Res plasmid in 2 ml saline volume, with the solution injected within 5 s. Liver tissues were excised from the mice at 8, 24, 48, and 72 hours after injection with the plasmid. Liver tissue (100 mg) was used for the analysis of protein levels of insulin receptor signaling pathway factors by Western blot. Fasting blood glucose levels were measured 48 h after injection of the plasmid.
2.7 Measurement of gluconeogenesis in a mouse model with high liver-specific expression of resistin using the pyruvate tolerance test
Each experimental group contained 6 mice of the same ages and sex. Mice were fasted for 18 hours, starting 30 h after the tail vein injection with the recombinant plasmid. Blood glucose levels were measured at the end of the fast (48 h after injection with the plasmid) using a glucose meter. This time point was considered to be 0 min for the subsequent tests. Mice were allowed to rest for 30 min, and then given an intraperitoneal injection of a sodium pyruvate solution (0.01 ml, 20% sodium pyruvate solution per g body weight). Blood glucose levels were determined 15, 30, 60, 90, and 120 min after sodium pyruvate injection.
2.8 Statistical analysis
Data are expressed as means±SEM of three to six different experiments. One-way analysis of variance (ANOVA) was used to evaluate the significance of the differences between the control and experimental groups. Significance levels are indicated in the figures, with P < 0.05 being considered statistically significant.
3. Results
3.1 Recombinant murine resistin induces insulin resistance in primary rat hepatocytes
Rat hepatocytes were treated with resistin (50 nM) for 24 h followed by incubation with insulin (100 nM), with or without glucose (30 mM), for 30 min. To investigate whether resistin induces insulin resistance we determined the glycogen content of the cells. The results show that resistin did not change the glycogen content of cells under basal or insulin-stimulated condition (Fig. 1). In contrast, when cells were exposed to both insulin and glucose stimulation a significant reduction in hepatic glycogen content after treatment with resistin, compared to resistin-untreated cells, was observed (decreased by 25% relative to control, P<0.05).
Fig. 1. Effect of resistin on the glycogen content of primary rat hepatocytes.
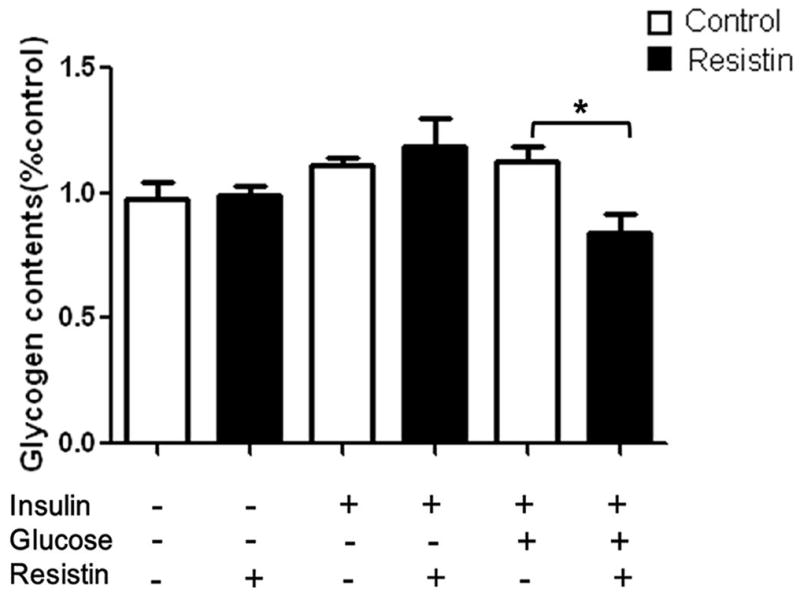
Cultured hepatocytes were treated with resistin (50 nM) for 24 h prior to adding glucose (30 mM), with or without insulin (100 nM), for 30 min. Glycogen content was measured by the anthrone-reagent method and are expressed relative to the level seen in the untreated cells (column 1). Data represent the means±S.E. (n=6). *p<0.05 vs. resistin untreated cells.
The amount of glucose secreted into the media by hepatocytes cultured in serum-free DMEM, without glucose or pyruvate supplement, with 50 nM resistin for 0.5, 1, 2, 4, and 16 h was evaluated using the glucose-oxidase method, however, no change was observed in the resistin-treated or control cells (data not shown). We also examined the expression of the gene PCK1 at the protein level and found no change (data not shown).
3.2 Recombinant murine resistin impairs insulin sensitivity in rat hepatocytes
Since glycogen synthesis is stimulated by insulin in hepatic cells, and having determined the effect of resistin on glycogen content, we next investigated the effect of recombinant murine resistin on the levels of several protein factors in the insulin signaling pathway. Western blot analysis showed that no change in the protein level of insulin receptor β was observed in resistin-treated cells compared to untreated cells. As expected, insulin or insulin plus glucose causes a significant (P<0.05) increase in the levels of phosphorylated insulin receptor β, compared to basal condition, but the addition of resistin did not result in any further changes (Fig. 2A). No change in the levels of IRS1, IRS1 phosphorylated at residue S307, IRS2, or PI3Kp85 was noted between the resistin-treated and untreated groups under basal or insulin-stimulated conditions (Fig. 2A). Treatment with resistin, however, caused a decrease in the levels of phosphorylated Akt, without changing the levels of total Akt protein, in the presence of insulin plus glucose stimulation (phosphorylated Akt decreased by 43% relative to the control, P=0.062), although this change did not achieve statistical significance (Fig. 2A and B). In contrast, as shown in Fig. 2A and C, the levels of phosphorylated GSK-3β, a key downstream factor involved in glycogen synthesis, decreased sharply with resistin treatment in the presence of insulin plus glucose treatment (decrease of 30% relative to the control, P<0.001). SOCS3, which may mediate cytokine-induced insulin resistance, was not affected by resistin under basal or insulin-stimulated conditions (Fig. 2A).
Fig. 2. The effects of resistin on the protein levels of key factors in the insulin signaling pathway in rat hepatocytes.
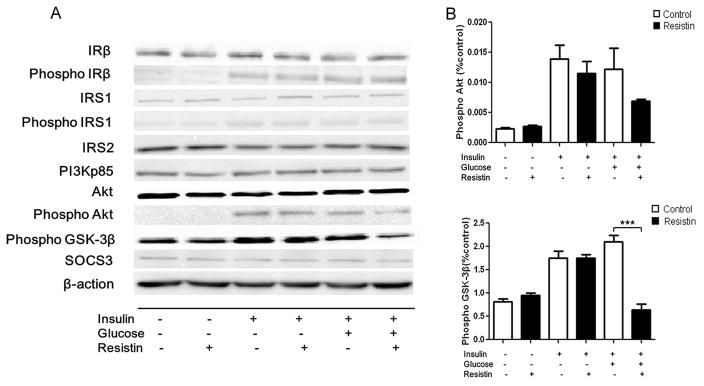
Total protein was isolated from hepatocytes cultured for 24 h with 50 nM resistin and then for 30 min with 30 mM glucose, with or without 100 nM insulin. Cells were harvested and cell lysates were analyzed by Western blot. (A) Protein levels of IRβ; Phosphorylated IRβ; IRS1; Phosphorylated IRS1; IRS2; PI3Kp85; Akt; Phosphorylated Akt; Phosphorylated GSK-3β and SOCS3. (B) Quantification of the Western blot analysis: Phosphorylated Akt; Phosphorylated GSK-3β. Data represent the means±S.E. (n=3). Data are expressed relative to the levels seen in the control cells (column 1). ***p<0.001 vs. cells treated without resistin.
3.3 Insulin resistance observed in the livers of a mouse model with high liver-specific expression of resistin
Systemic administration by intravenous hydrodynamic-based injection of a recombinant murine resistin expression plasmid resulted in high liver tissue-specific expression of resistin 48 h after injection (Fig. 3A and B). The fasting blood glucose levels in the mouse model with high liver tissue-specific high expression of resistin were found to be significantly higher than those of control mice (Fig. 3C, increased by 30% relative to control, P<0.001). In addition, we also measured the liver tissue glycogen content and a significant reduction in glycogen content was seen in mice injected with the pCAG-GFP-Res plasmid (Fig. 3D). Glycogen content of the resistin-injected mouse group was 27% and 34% lower than those injected with an empty-vector or the negative control groups, respectively (P<0.05) (Fig. 3D). Gluconeogenesis activity was examined using the pyruvate tolerance test. While fasting blood glucose levels were higher in the mice with high liver-specific expression of resistin, increase in gluconeogenesis was still observed (Fig. 3E). Elevated blood glucose levels were seen at both 0 and 15 min after pyruvate uptake in our resistin expressing mouse model, compared to control mice (P<0.01), which would agree with their elevated fasting blood glucose levels (Fig. 3C), while at subsequent time points (30, 60, 90, and 120 min) no significant difference was seen among the three groups (Fig. 3E).
Fig. 3. Glucose metabolism in a mouse model with high liver tissue-specific expression of resistin.

(A and B): Construction of the mouse model with high liver tissue-specific expression of resistin. (A) BALB/c mice were injected with pCAG-GFP-Res plasmid in 2 ml saline within 5 s. Organs were excised 48 h after injection, homogenized, and analyzed by Western blot. Data represent the means±S.E. (n=6) and is expressed relative to the level seen in the liver. (B) Liver tissue were excised, homogenized, and analyzed by Western blot 8 h, 24 h, 48 h, and 72 h after injection with the pCAG-GFP-Res plasmid. Data represent the means±S.E. (n=6) and is expressed relative to the level seen at 8 h. (C and D) Fasting blood glucose levels and glycogen content of the liver tissue were measured 48 h after injection. Data represent the means±S.E. (n=6). (C) ***p<0.001 vs. Contol and pCAG-GFP group; (D) *p<0.05 vs. Contol and pCAG-GFP group; (E) An 18 h fast was initiated 30 h after tail vein injection with the recombinant plasmid pCAG-GFP-Res. Blood glucose levels were measured at the end of the fast (time = 0) using glucose meter. Mice were allowed to rest for 30 min, and then given an intraperitoneal injection of sodium pyruvate solution (0.01 ml, 20% sodium pyruvate solution per g body weight). Blood glucose levels were determined 15, 30, 60, 90, and 120 min after injection with sodium pyruvate. Data represent the means±S.E. (n=6). ***p<0.001 vs. control and pCAG-GFP group at 0 min; **p<0.001 vs. control and pCAG-GFP group at 15 min.
3.4 Impaired insulin signaling in the liver tissue of a mouse model with high liver-specific expression of resistin
To examine the effects of high liver-specific expression of resistin in mice, we conducted a Western blot analysis of components of the insulin signaling pathway. Western blots of liver extracts showed no change in the protein levels for IRβ, PI3Kp85, and Akt between the resistin-expressing and control mice (Fig. 4A). In contrast, the level of phosphorylated GSK-3β was significantly lower in the resistin-expressing mouse model compared to the control groups (Fig. 4B, decreased by 50% relative to the control, P<0.05).
Fig. 4. Protein levels of insulin signaling proteins in the liver of a mouse model with high liver tissue-specific expression of resistin.
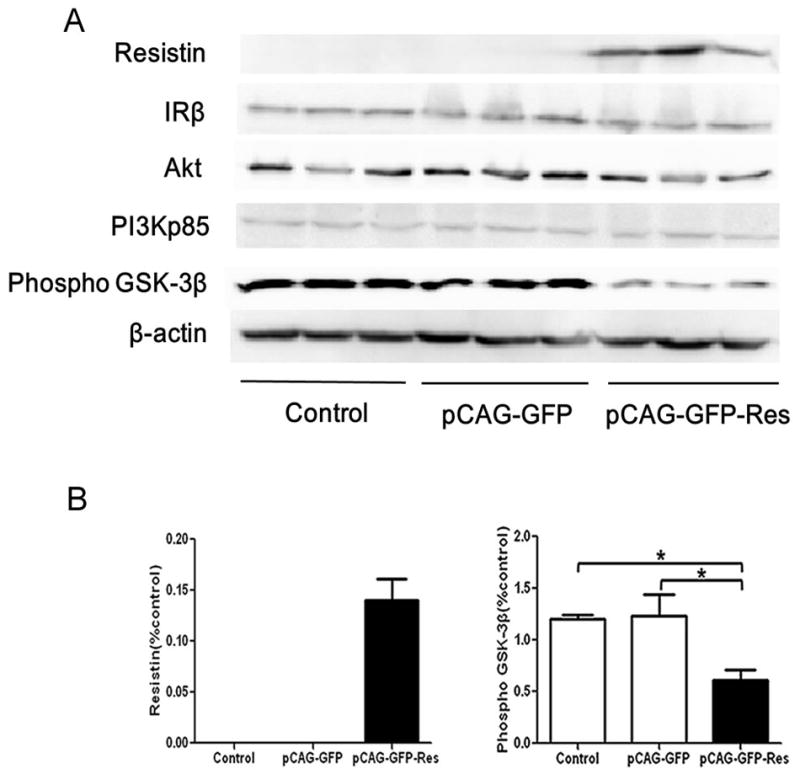
(A) 48 h after tail vein injection of recombinant plasmid pCAG-GFP and pCAG-GFP-Res, expression of Resistin; IRβ; PI3Kp85; Akt; Phosphorylated GSK-3β in liver tissue were analyzed by Western blot; (B) Quantification of the Western blot analysis: Resistin and Phosphorylated GSK-3β. Data represent the means±S.E. (n=3) and are expressed relative to the levels seen with the pCAG-GFP-Res construct. *p<0.05 vs. control and pCAG-GFP group.
4. Discussion
The prevalence of obesity and type 2 diabetes are rising worldwide. Resistin has been implicated as a critical factor in the pathogenesis of obesity-mediated insulin resistance and type 2 diabetes (Keller 2006) and previous studies have shown that the exposure of rodents, or their cells, to resistin results in a decrease in their response to insulin (Di Simone et al. 2009; Jorgensen et al. 2009; Qatanani et al. 2009). The liver is a major target organ for insulin and plays an essential role in maintaining plasma glucose levels (Klover and Mooney 2004). Here, we studied the relationship between resistin and liver glucose metabolism to examine the effect of resistin on insulin sensitivity.
It has been reported that resistin inhibits insulin-stimulated glycogen synthesis but has no effect in the absence of insulin in muscle cells (Pravenec et al. 2003). Other studies, however, suggested that basal and insulin-stimulated glycogen synthesis was decreased in L6 rat skeletal muscle cells treated with resistin (Palanivel et al. 2006; Niederwanger et al. 2007). In our research, we first explored the effect of recombinant murine resistin on liver glycogen content. Our results demonstrate that resistin causes a significant reduction in hepatic glycogen content only in the presence of insulin plus high concentrations of glucose (Fig. 1). Basal and insulin–stimulated glycogen content did not change with resistin treatment (Fig. 1). High glucose and insulin stimulation exacerbate insulin resistance, contributing significantly to the pathogenesis of type 2 diabetes (Zierath et al. 2000; Huang et al. 2002; Buren et al. 2003) which may explain the phenomenon observed here. Resistin, thus, may influence glycogen content as a consequence of antagonizing insulin function, but only under a combined hyperinsulinemia hyperglycemia situation.
Both hepatic glycogen metabolism and gluconeogenesis play essential roles in maintaining glucose homeostasis. Previous work had shown that resistin stimulates hepatic glucose output to exert its glucose-regulatory effect (Banerjee et al. 2004; Rangwala et al. 2004). However our results show that resistin did not change glucose output in primary rat hepatocytes at five different time points. Differences in the level of PCK1, a rate limiting enzyme in hepatic gluconeogenesis (Beale et al. 2007), was not found between resistin-treated and control cells (data not shown). We conclude that resistin does not alter glucose output in primary cultures of rat hepatocytes. Previous studies have also reported that resistin plays a causative role in the development of diet-induced hepatic insulin resistance in mice (Muse et al. 2004). Moreover, hypothalamic resistin antagonizes insulin sensitivity in rats (Muse et al. 2007). Systemic administration by intravenous hydrodynamics-based injection in animals of plasmid DNA is a method that induces high liver-specific expression of recombinant genes (Liu et al. 1999). To further investigate the physiological effects of murine resistin we generated a recombinant resistin expression vector with a mouse resistin cDNA was used to generate a resistin-GFP fusion protein. Mice that express high liver-specific levels of resistin were generated and used as model system to determine the in vivo effects of resistin on glucose metabolism and insulin resistance (Fig. 3Aand B), however this approach differs from the use of recombinant resistin, since the protein is synthesized within cells and thus may also have intracellular effects. Significantly increased levels of fasting blood glucose were observed in our model compared to control mice (Fig. 3C). The finding that hepatic gluconeogenesis is enhanced within 15 min after injection with sodium pyruvate solution (Fig. 3E) likely explains the increased fasting glucose levels in these model mice. Hepatic glycogen content in the model mouse with high liver tissue-specific expression of resistin is lower than those of control mice (Fig. 3D). Mice with high levels of expression of resistin in adipocytes have previously been shown to have abnormal glucose metabolism in skeletal muscle, even if plasma resistin levels are within the normal range, this phenomenon suggests that resistin induces abnormal skeletal muscle metabolism by increasing other adipocyte cytokines, which could impair insulin sensitivity (Pravenec et al. 2003).
Here we demonstrated that resistin induced insulin resistance both in primary cultures of rat hepatocytes and in the liver of a mouse model with high liver-specific expression of resistin. Since impaired insulin sensitivity and hepatic glycogen storage were seen in our research, we therefore investigated the effect of resistin on key proteins in the insulin-signaling cascade involved in the regulation of glycogen synthesis, including insulin receptor β (IRβ), insulin receptor substrates 1 and 2 (IRS1 and IRS2) phosphatidylinositol 3-kinase (PI3K), protein kinase B (PKB/Akt), and glycogen synthase kinase-3β (GSK-3β), to identify protein factors that potentially contribute to the effect of resistin. A decrease in the amount of receptors can also lead to an impairment of insulin signaling. The levels of neither insulin receptor β nor its phosphorylated form were altered by treatment of rat hepatocytes with resistin (Fig. 2), results which are similar to those previously observed in muscle L6 cells (Palanivel et al. 2006). IRS1 and IRS2 are two major insulin receptor effectors that contribute to the signaling that regulates glucose homeostasis (Thirone et al. 2006), while tumor necrosis factor-alpha (TNFα) is an important mediator of insulin resistance in obesity and diabetes, as it induces insulin resistance at the level of the IRS proteins (Ishizuka et al. 2007; Lorenzo et al. 2008; Nieto-Vazquez et al. 2008). IRS-1 primarily functions in skeletal muscle and adipose tissues (Sesti et al. 2001; Thirone et al. 2006), while IRS2 contributes to hepatic insulin sensitivity and resistance in the liver (Sesti et al. 2001; Dominici et al. 2002; Thirone et al. 2006). IRS1, however, might cooperate with IRS2 in the regulation of insulin signaling in the liver (Thirone et al. 2006). Our results did not show a significant change in the protein levels of IRS1 or IRS2 upon resistin treatment (Fig. 2), or on the levels of IRS1 phosphorylated at S307, indicating that the mechanism of resistin action in rat hepatocytes in vitro does not involve an alteration of IRS protein levels.
The PI3K/Akt signaling pathway is important for the metabolic effects of insulin (Huang et al. 2008) and several studies have demonstrated that impaired insulin-stimulated activation of PI3-kinase results in reduced insulin sensitivity (Nadler et al. 2001; Kruszynska et al. 2002). The activation of PI3K by insulin is mediated by the p85 regulatory subunit binding to tyrosine-phosphorylated insulin receptor substrate (IRS) proteins (Backer et al. 1992; Myers et al. 1992). Akt, a downstream target of PI3-kinase, has been reported to mediate insulin-induced glycogen synthase activation and glucose uptake, and is activated mainly at two regulatory sites, Thr 308 and Ser 473 (Palanivel et al. 2006). We examined the effect of resistin on the protein levels of PI3Kp85 and Akt and no change in the protein level of PI3Kp85 was detected between experimental and control cells, however, resistin treatment of hepatocytes lead to a decrease in the level of Akt phosphorylated at S473 under high insulin (100 nM) and glucose (30 mM) stimulation (Fig. 2). No change in total Akt protein levels was seen under these conditions, indicating that the only a change was in phosphorylation status. Akt phosphorylates glycogen synthase kinase (GSK) thereby inactivating GSK (Fang et al. 2000). Glycogen synthase kinase 3 (GSK-3), the rate limiting enzyme in glycogen synthesis (Cohen et al. 1986), plays an important role in the regulation of insulin action (Henriksen and Dokken 2006) and, as shown in Fig. 2B, a decrease in the level of GSK-3β was observed after resistin treatment under the insulin plus glucose stimulated condition. We hypothesize that resistin decrease phosphorylated GSK-3β levels as a consequence of its down regulation of phosphorylated Akt, which would be in agreement with a previous study demonstrating that insulin-stimulated hepatic Akt and GSK-3 phosphorylation were enhanced by antisense-mediated knockdown of circulating resistin level (Muse et al. 2004).
SOCS3 is a member of the suppressors of cytokine signaling (SOCS) family, which is a recently discovered family of proteins associated with the inhibition of insulin receptor signaling (Senn et al. 2003). Several reports have demonstrated that ectopic expression of SOCS3 may lead to insulin resistance (Senn et al. 2003; Steppan et al. 2005; Ye et al. 2012; Jorgensen et al. 2013). As shown in Fig. 2A, resistin did not affect the protein levels of SOCS3 under basal or insulin-stimulated conditions, thus it is likely that SOCS3 does not mediate the inhibitory action of resistin in the insulin signaling transduction pathway in rat hepatocytes. Taken together, our results suggest that resistin impairs glycogen synthesis via the inhibition of the protein levels of phosphorylated GSK-3β, a key protein involved in the insulin signaling cascade, and this inhibitory effect may lead to the induction of insulin resistance in primary cultures of rat hepatocytes.
Animal models with high expression of resistin show decreased glucose uptake by skeletal muscle and impaired insulin signaling, including reduced levels of IRS1, IRS2, and phosphorylated Akt (Satoh et al. 2004). To explore the molecular mechanism involved in the decrease in hepatic glycogen content we generated a mouse model with high liver-specific expression of resistin, a model that show that a decrease in the phosphorylation levels of GSK-3β, independent of changes in IRβ, PI3K and Akt may lead to a decrease in glycogen synthesis and an increase in fasting blood glucose levels. Our study demonstrated that resistin represses insulin action in primary rat hepatocytes, by reducing the levels of phosphorylated GSK-3β, independent of ectopic expression of SOCS3. The change GSK-3β levels may lead to a decrease in glycogen synthesis and glycogen content. In a mouse model with high liver-specific expression of resistin, we observed an increase in fasting blood glucose levels and decreased hepatic glycogen content along with a reduction in the levels of phosphorylated GSK-3β in their liver tissue. GSK-3β may explain the changes seen in both isolate hepatocytes and in the mouse model. These findings should contribute to the development of novel strategies for the treatment of insulin resistance and type 2 diabetes.
Acknowledgments
This study was supported by grants from the National Natural Science Foundation of China (NSFC) Grant Number 30772603, National Key Technologies R&D Program (Grant Numbers 2006BAF07B01, 2009BAK61B01, 2009BAK61B04, 2012BAK25B01), and a grant from the National Science Foundation of China –Canadian Institutes of Health Research (NSFC-CIHR) China-Canada Joint Health Research Initiative (Grant Numbers 81061120525 and CCI-109605).
Abbreviations
- IRβ
insulin receptor β
- IRS
insulin receptor substrate
- PI3K
phosphoinositide 3-kinase
- Akt
protein kinase B
- GSK-3β
glycogen synthase kinase-3β
- PEPCK (also called PCK1)
phosphoenolpyruvatecarboxykinase
- SOCS
suppressors of cytokine signaling
- TNFα
tumor necrosis factor alpha
References
- Aiston S, Hampson L, Gomez-Foix AM, Guinovart JJ, Agius L. Hepatic glycogen synthesis is highly sensitive to phosphorylase activity: evidence from metabolic control analysis. The Journal of biological chemistry. 2001;276:23858–23866. doi: 10.1074/jbc.M101454200. [DOI] [PubMed] [Google Scholar]
- Backer JM, Myers MG, Jr, Shoelson SE, Chin DJ, Sun XJ, Miralpeix M, Hu P, Margolis B, Skolnik EY, Schlessinger J, et al. Phosphatidylinositol 3′-kinase is activated by association with IRS-1 during insulin stimulation. The EMBO journal. 1992;11:3469–3479. doi: 10.1002/j.1460-2075.1992.tb05426.x. [DOI] [PMC free article] [PubMed] [Google Scholar]
- Banerjee RR, Rangwala SM, Shapiro JS, Rich AS, Rhoades B, Qi Y, Wang J, Rajala MW, Pocai A, Scherer PE, et al. Regulation of fasted blood glucose by resistin. Science. 2004;303:1195–1198. doi: 10.1126/science.1092341. [DOI] [PubMed] [Google Scholar]
- Beale EG, Harvey BJ, Forest C. PCK1 and PCK2 as candidate diabetes and obesity genes. Cell biochemistry and biophysics. 2007;48:89–95. doi: 10.1007/s12013-007-0025-6. [DOI] [PubMed] [Google Scholar]
- Bradford MM. A rapid and sensitive method for the quantitation of microgram quantities of protein utilizing the principle of protein-dye binding. Analytical biochemistry. 1976;72:248–254. doi: 10.1006/abio.1976.9999. [DOI] [PubMed] [Google Scholar]
- Buren J, Liu HX, Lauritz J, Eriksson JW. High glucose and insulin in combination cause insulin receptor substrate-1 and -2 depletion and protein kinase B desensitisation in primary cultured rat adipocytes: possible implications for insulin resistance in type 2 diabetes. European journal of endocrinology/European Federation of Endocrine Societies. 2003;148:157–167. doi: 10.1530/eje.0.1480157. [DOI] [PubMed] [Google Scholar]
- Carroll NV, Longley RW, Roe JH. The determination of glycogen in liver and muscle by use of anthrone reagent. The Journal of biological chemistry. 1956;220:583–593. [PubMed] [Google Scholar]
- Cohen P, Holmes CF, Poulter L, Gibson B, Williams DH. Identification of the C-terminus of rabbit skeletal muscle glycogen synthase. Biochemical and biophysical research communications. 1986;137:542–545. doi: 10.1016/0006-291x(86)91244-1. [DOI] [PubMed] [Google Scholar]
- Costandi J, Melone M, Zhao A, Rashid S. Human resistin stimulates hepatic overproduction of atherogenic ApoB-containing lipoprotein particles by enhancing ApoB stability and impairing intracellular insulin signaling. Circulation research. 2011;108:727–742. doi: 10.1161/CIRCRESAHA.110.238949. [DOI] [PubMed] [Google Scholar]
- Di Simone N, Di Nicuolo F, Marzioni D, Castellucci M, Sanguinetti M, D’Lppolito S, Caruso A. Resistin modulates glucose uptake and glucose transporter-1 (GLUT-1) expression in trophoblast cells. Journal of cellular and molecular medicine. 2009;13:388–397. doi: 10.1111/j.1582-4934.2008.00337.x. [DOI] [PMC free article] [PubMed] [Google Scholar]
- Dominici FP, Hauck S, Argentino DP, Bartke A, Turyn D. Increased insulin sensitivity and upregulation of insulin receptor, insulin receptor substrate (IRS)-1 and IRS-2 in liver of Ames dwarf mice. The Journal of endocrinology. 2002;173:81–94. doi: 10.1677/joe.0.1730081. [DOI] [PubMed] [Google Scholar]
- Fang X, Yu SX, Lu Y, Bast RC, Jr, Woodgett JR, Mills GB. Phosphorylation and inactivation of glycogen synthase kinase 3 by protein kinase A. Proceedings of the National Academy of Sciences of the United States of America. 2000;97:11960–11965. doi: 10.1073/pnas.220413597. [DOI] [PMC free article] [PubMed] [Google Scholar]
- Henriksen EJ, Dokken BB. Role of glycogen synthase kinase-3 in insulin resistance and type 2 diabetes. Current drug targets. 2006;7:1435–1441. doi: 10.2174/1389450110607011435. [DOI] [PubMed] [Google Scholar]
- Huang C, Somwar R, Patel N, Niu W, Torok D, Klip A. Sustained exposure of L6 myotubes to high glucose and insulin decreases insulin-stimulated GLUT4 translocation but upregulates GLUT4 activity. Diabetes. 2002;51:2090–2098. doi: 10.2337/diabetes.51.7.2090. [DOI] [PubMed] [Google Scholar]
- Huang TT, Du M, Kuluz JW, Li Y, Ma H. Postreceptor crosstalk on PI3K/Akt between GH and insulin in non-catch-up growth rats born small for gestational age. Hormone research. 2008;70:29–35. doi: 10.1159/000129675. [DOI] [PubMed] [Google Scholar]
- Ishizuka K, Usui I, Kanatani Y, Bukhari A, He J, Fujisaka S, Yamazaki Y, Suzuki H, Hiratani K, Ishiki M, et al. Chronic tumor necrosis factor-alpha treatment causes insulin resistance via insulin receptor substrate-1 serine phosphorylation and suppressor of cytokine signaling-3 induction in 3T3-L1 adipocytes. Endocrinology. 2007;148:2994–3003. doi: 10.1210/en.2006-1702. [DOI] [PubMed] [Google Scholar]
- Jorgensen SB, Honeyman J, Oakhill JS, Fazakerley D, Stockli J, Kemp BE, Steinberg GR. Oligomeric resistin impairs insulin and AICAR-stimulated glucose uptake in mouse skeletal muscle by inhibiting GLUT4 translocation. American journal of physiology Endocrinology and metabolism. 2009;297:E57–66. doi: 10.1152/ajpendo.90744.2008. [DOI] [PubMed] [Google Scholar]
- Jorgensen SB, O’Neill HM, Sylow L, Honeyman J, Hewitt KA, Palanivel R, Fullerton MD, Oberg L, Balendran A, Galic S, et al. Deletion of skeletal muscle SOCS3 prevents insulin resistance in obesity. Diabetes. 2013;62:56–64. doi: 10.2337/db12-0443. [DOI] [PMC free article] [PubMed] [Google Scholar]
- Kawano K, Hirashima T, Mori S, Saitoh Y, Kurosumi M, Natori T. Spontaneous long-term hyperglycemic rat with diabetic complications. Otsuka Long-Evans Tokushima Fatty (OLETF) strain. Diabetes. 1992;41:1422–1428. doi: 10.2337/diab.41.11.1422. [DOI] [PubMed] [Google Scholar]
- Keller U. From obesity to diabetes. International journal for vitamin and nutrition research Internationale Zeitschrift fur Vitamin- und Ernahrungsforschung Journal international de vitaminologie et de nutrition. 2006;76:172–177. doi: 10.1024/0300-9831.76.4.172. [DOI] [PubMed] [Google Scholar]
- Klover PJ, Mooney RA. Hepatocytes: critical for glucose homeostasis. The international journal of biochemistry & cell biology. 2004;36:753–758. doi: 10.1016/j.biocel.2003.10.002. [DOI] [PubMed] [Google Scholar]
- Kruszynska YT, Worrall DS, Ofrecio J, Frias JP, Macaraeg G, Olefsky JM. Fatty acid-induced insulin resistance: decreased muscle PI3K activation but unchanged Akt phosphorylation. The Journal of clinical endocrinology and metabolism. 2002;87:226–234. doi: 10.1210/jcem.87.1.8187. [DOI] [PubMed] [Google Scholar]
- Liu F, Song Y, Liu D. Hydrodynamics-based transfection in animals by systemic administration of plasmid DNA. Gene therapy. 1999;6:1258–1266. doi: 10.1038/sj.gt.3300947. [DOI] [PubMed] [Google Scholar]
- Lorenzo M, Fernandez-Veledo S, Vila-Bedmar R, Garcia-Guerra L, De Alvaro C, Nieto-Vazquez I. Insulin resistance induced by tumor necrosis factor-alpha in myocytes and brown adipocytes. Journal of animal science. 2008;86:E94–104. doi: 10.2527/jas.2007-0462. [DOI] [PubMed] [Google Scholar]
- Muse ED, Lam TK, Scherer PE, Rossetti L. Hypothalamic resistin induces hepatic insulin resistance. The Journal of clinical investigation. 2007;117:1670–1678. doi: 10.1172/JCI30440. [DOI] [PMC free article] [PubMed] [Google Scholar]
- Muse ED, Obici S, Bhanot S, Monia BP, McKay RA, Rajala MW, Scherer PE, Rossetti L. Role of resistin in diet-induced hepatic insulin resistance. The Journal of clinical investigation. 2004;114:232–239. doi: 10.1172/JCI21270. [DOI] [PMC free article] [PubMed] [Google Scholar]
- Myers MG, Jr, Backer JM, Sun XJ, Shoelson S, Hu P, Schlessinger J, Yoakim M, Schaffhausen B, White MF. IRS-1 activates phosphatidylinositol 3′-kinase by associating with src homology 2 domains of p85. Proceedings of the National Academy of Sciences of the United States of America. 1992;89:10350–10354. doi: 10.1073/pnas.89.21.10350. [DOI] [PMC free article] [PubMed] [Google Scholar]
- Nadler ST, Stoehr JP, Rabaglia ME, Schueler KL, Birnbaum MJ, Attie AD. Normal Akt/PKB with reduced PI3K activation in insulin-resistant mice. American journal of physiology Endocrinology and metabolism. 2001;281:E1249–1254. doi: 10.1152/ajpendo.2001.281.6.E1249. [DOI] [PubMed] [Google Scholar]
- Nakata M, Okada T, Ozawa K, Yada T. Resistin induces insulin resistance in pancreatic islets to impair glucose-induced insulin release. Biochemical and biophysical research communications. 2007;353:1046–1051. doi: 10.1016/j.bbrc.2006.12.134. [DOI] [PubMed] [Google Scholar]
- Niederwanger A, Kranebitter M, Ciardi C, Tatarczyk T, Patsch JR, Pedrini MT. Resistin impairs basal and insulin-induced glycogen synthesis by different mechanisms. Molecular and cellular endocrinology. 2007;263:112–119. doi: 10.1016/j.mce.2006.09.007. [DOI] [PubMed] [Google Scholar]
- Nieto-Vazquez I, Fernandez-Veledo S, Kramer DK, Vila-Bedmar R, Garcia-Guerra L, Lorenzo M. Insulin resistance associated to obesity: the link TNF-alpha. Archives of physiology and biochemistry. 2008;114:183–194. doi: 10.1080/13813450802181047. [DOI] [PubMed] [Google Scholar]
- Palanivel R, Maida A, Liu Y, Sweeney G. Regulation of insulin signalling, glucose uptake and metabolism in rat skeletal muscle cells upon prolonged exposure to resistin. Diabetologia. 2006;49:183–190. doi: 10.1007/s00125-005-0060-z. [DOI] [PubMed] [Google Scholar]
- Pravenec M, Kazdova L, Landa V, Zidek V, Mlejnek P, Jansa P, Wang J, Qi N, Kurtz TW. Transgenic and recombinant resistin impair skeletal muscle glucose metabolism in the spontaneously hypertensive rat. The Journal of biological chemistry. 2003;278:45209–45215. doi: 10.1074/jbc.M304869200. [DOI] [PubMed] [Google Scholar]
- Qatanani M, Szwergold NR, Greaves DR, Ahima RS, Lazar MA. Macrophage-derived human resistin exacerbates adipose tissue inflammation and insulin resistance in mice. The Journal of clinical investigation. 2009;119:531–539. doi: 10.1172/JCI37273. [DOI] [PMC free article] [PubMed] [Google Scholar]
- Rangwala SM, Rich AS, Rhoades B, Shapiro JS, Obici S, Rossetti L, Lazar MA. Abnormal glucose homeostasis due to chronic hyperresistinemia. Diabetes. 2004;53:1937–1941. doi: 10.2337/diabetes.53.8.1937. [DOI] [PubMed] [Google Scholar]
- Satoh H, Nguyen MT, Miles PD, Imamura T, Usui I, Olefsky JM. Adenovirus-mediated chronic “hyper-resistinemia” leads to in vivo insulin resistance in normal rats. The Journal of clinical investigation. 2004;114:224–231. doi: 10.1172/JCI20785. [DOI] [PMC free article] [PubMed] [Google Scholar]
- Seglen PO. Preparation of isolated rat liver cells. Methods in cell biology. 1976;13:29–83. doi: 10.1016/s0091-679x(08)61797-5. [DOI] [PubMed] [Google Scholar]
- Senn JJ, Klover PJ, Nowak IA, Zimmers TA, Koniaris LG, Furlanetto RW, Mooney RA. Suppressor of cytokine signaling-3 (SOCS-3), a potential mediator of interleukin-6-dependent insulin resistance in hepatocytes. The Journal of biological chemistry. 2003;278:13740–13746. doi: 10.1074/jbc.M210689200. [DOI] [PubMed] [Google Scholar]
- Sesti G, Federici M, Hribal ML, Lauro D, Sbraccia P, Lauro R. Defects of the insulin receptor substrate (IRS) system in human metabolic disorders. FASEB journal : official publication of the Federation of American Societies for Experimental Biology. 2001;15:2099–2111. doi: 10.1096/fj.01-0009rev. [DOI] [PubMed] [Google Scholar]
- Sheng CH, Di J, Jin Y, Zhang YC, Wu M, Sun Y, Zhang GZ. Resistin is expressed in human hepatocytes and induces insulin resistance. Endocrine. 2008;33:135–143. doi: 10.1007/s12020-008-9065-y. [DOI] [PubMed] [Google Scholar]
- Steppan CM, Bailey ST, Bhat S, Brown EJ, Banerjee RR, Wright CM, Patel HR, Ahima RS, Lazar MA. The hormone resistin links obesity to diabetes. Nature. 2001;409:307–312. doi: 10.1038/35053000. [DOI] [PubMed] [Google Scholar]
- Steppan CM, Wang J, Whiteman EL, Birnbaum MJ, Lazar MA. Activation of SOCS-3 by resistin. Molecular and cellular biology. 2005;25:1569–1575. doi: 10.1128/MCB.25.4.1569-1575.2005. [DOI] [PMC free article] [PubMed] [Google Scholar]
- Taniguchi CM, Ueki K, Kahn R. Complementary roles of IRS-1 and IRS-2 in the hepatic regulation of metabolism. The Journal of clinical investigation. 2005;115:718–727. doi: 10.1172/JCI23187. [DOI] [PMC free article] [PubMed] [Google Scholar] [Retracted]
- Thirone AC, Huang C, Klip A. Tissue-specific roles of IRS proteins in insulin signaling and glucose transport. Trends in endocrinology and metabolism: TEM. 2006;17:72–78. doi: 10.1016/j.tem.2006.01.005. [DOI] [PubMed] [Google Scholar]
- Yang Y, Xiao M, Mao Y, Li H, Zhao S, Gu Y, Wang R, Yu J, Zhang X, Irwin DM, et al. Resistin and insulin resistance in hepatocytes: resistin disturbs glycogen metabolism at the protein level. Biomedicine & pharmacotherapy = Biomedecine & pharmacotherapie. 2009;63:366–374. doi: 10.1016/j.biopha.2008.06.033. [DOI] [PubMed] [Google Scholar]
- Ye J, Zheng R, Wang Q, Liao L, Ying Y, Lu H, Cianflone K, Ning Q, Luo X. Downregulating SOCS3 with siRNA ameliorates insulin signaling and glucose metabolism in hepatocytes of IUGR rats with catch-up growth. Pediatric research. 2012;72:550–559. doi: 10.1038/pr.2012.123. [DOI] [PubMed] [Google Scholar]
- Zhou L, Sell H, Eckardt K, Yang Z, Eckel J. Conditioned medium obtained from in vitro differentiated adipocytes and resistin induce insulin resistance in human hepatocytes. FEBS letters. 2007;581:4303–4308. doi: 10.1016/j.febslet.2007.07.076. [DOI] [PubMed] [Google Scholar]
- Zierath JR, Krook A, Wallberg-Henriksson H. Insulin action and insulin resistance in human skeletal muscle. Diabetologia. 2000;43:821–835. doi: 10.1007/s001250051457. [DOI] [PubMed] [Google Scholar]