

Abstract
Evidence is mounting that vitamin D deficiency is intimately involved in autism. We report on autism prevalence by US state for those aged 6–17 y in 2010 with respect to indices of solar UV-B (UVB) doses. We calculated autism prevalence rates for white, black and Asian Americans by using total prevalence and relative populations of minors for each ethnic group by state. Analyses omit AK and HI (considered extreme cases), WY (no data), along with AZ and ND for black Americans (low numbers) and DC, ME, MT, ND and SD for Asian Americans (low numbers). For white Americans, the regression coefficient for solar UVB doses and autism prevalence ranged from -0.52 in January to -0.57 in October. For black Americans, the regression coefficient for latitude was 0.61, whereas those for solar UVB ranged from -0.55 to -0.61. For Asian Americans, the values for solar UVB ranged from -0.28 to -0.38. The inverse correlation between solar UVB and autism prevalence is similar to that for many types of cancer in the US. The journal literature indicates that adverse effects on fetal brain development during pregnancy due to vitamin D deficiency can explain these findings. However, we cannot rule out a role of vitamin D deficiency in early life. These results add to the evidence that vitamin D deficiency may be an important risk factor for autism and suggest that pregnant women and autistic individuals raise their serum 25-hydroxyvitamin D concentrations above 30 ng/ml.
Keywords: autism, vitamin D, 25(OH)D, ultraviolet-B, ecological, African American, Asian American, pregnancy, serum 25-hydroxyvitamin D
Introduction
Evidence is mounting that vitamin D deficiency is a risk factor for autism. Cannell1 [2008] first proposed and later extended2 [2010] the UV-B (UVB)-vitamin D-autism hypothesis. Kinney and colleagues3 reviewed the autism and vitamin D connection and suggested that “Vitamin D plays important roles in repairing DNA damage and protecting against oxidative stress—a key cause of DNA damage.” Mostafa and Al-Ayadhi recently studied autistic children and found a strong correlation between better autism rating scales and higher 25(OH)D levels and between higher anti-neural antibodies and lower 25(OH)D levels.4 Kočovská and colleagues5 reviewed the evidence supporting this hypothesis and called for “urgent research” into vitamin D and autism. Despite the mounting evidence, the working hypothesis has not been accepted among autism researchers. .
A map of autism rates by state for children aged 6–17 y in the Los Angeles Times in December 20116 prompted this ecological study. The map showed highest rates in the Northeast and on the West Coast and lowest among the Southern and Plains states. The trend of high rates in the Northeast and lowest rates in the Southern states is similar to that of many types of cancer,7 which were linked to solar UVB doses for July.8,9 Thus, we thought that the data, when analyzed in greater detail, might show an inverse correlation between solar UVB doses and prevalence of autism.
Results
Table 1 gives the regression results for solar UVB doses for several different months as well as latitude. For white and Asian Americans, the regression fits for UVB in March, July and October were similar and stronger than those for UVB in January or latitude. However, for black Americans, the results for latitude were similar to those for UVB. The regression fits for black Americans were slightly stronger than for white Americans.
Table 1. Regression results, autism aged 6–17 y in the US in 2010 by state.
| Race, states | Factor | Linear fit (r, adjusted R2, p) | Power law fit (r) |
|---|---|---|---|
| White Americans (AK, HI, WY omitted) |
UVB-vit D, Oct | -0.57, 0.31, * | 0.60 |
| UVB-vit D Mar | -0.55, 0.29, * | 0.58 | |
| UVB Jul | -0.55, 0.28, * | 0.57 | |
| UVB-vit D, Jul | -0.54, 0.28, * | 0.60 | |
| UVB-vit D, Jan | -0.52, 0.25, * | 0.52 | |
| Latitude | 0.48, 0.22, * | 0.48 | |
| Black Americans (AK, AZ, HI, ND, WY omitted) | Latitude × latitude | 0.63, 0.38, * | 0.63 |
| Latitude | 0.61, 0.36, * | 0.63 | |
| UVB-vit D, Oct | -0.61, 0.36, * | 0.69 | |
| UVB-vit D Mar | -0.59, 0.33, * | 0.62 | |
| UVB Jul | -0.57, 0.31, * | 0.60 | |
| UVB-vit D, Jan | -0.56, 0.31, * | 0.65 | |
| UVB-vit D, Jul | -0.55, 0.29, * | 0.63 | |
| Asian Americans (AK, DC, HI, ME, MT, ND, SD, WY omitted) | UVB-vit D, Jul | -0.38, 0.13, 0.01 | 0.38 |
| UVB Jul | -0.36, 0.11, 0.02 | 0.35 | |
| UVB-vit D, Oct | -0.32, 0.08, 0.04 | 0.33 | |
| UVB-vit D Mar | -0.30, 0.07, 0.06 | 0.30 | |
| Latitude × latitude | 0.29, 0.06, 0.06 | 0.27 | |
| Latitude | 0.28, 0.05, 0.08 | 0.27 | |
| UVB-vit D, Jan | -0.28, 0.05, 0.08 | 0.34 |
No significant correlations emerged for other possible risk-modifying factors such as air pollution, alcohol consumption, obesity, poverty, or smoking.
Figures 1–3 are scatter plots of the autism prevalence data with respect to solar UVB doses. Figure 1 shows the results for white Americans with respect to October UVB vitamin D production with both linear and power-law fits to the data. Figure 2 does the same for black Americans. Figure 3 shows the results for Asian Americans with respect to July UVB vitamin D production. The linear regression fits to the data show ratios for low to high UVB of 2.4 for white Americans, 3.6 for black Americans and 1.7 for Asian Americans. In all three cases, prevalence of autism with respect to changes in solar UVB decreases faster at lower UVB doses than at higher doses.
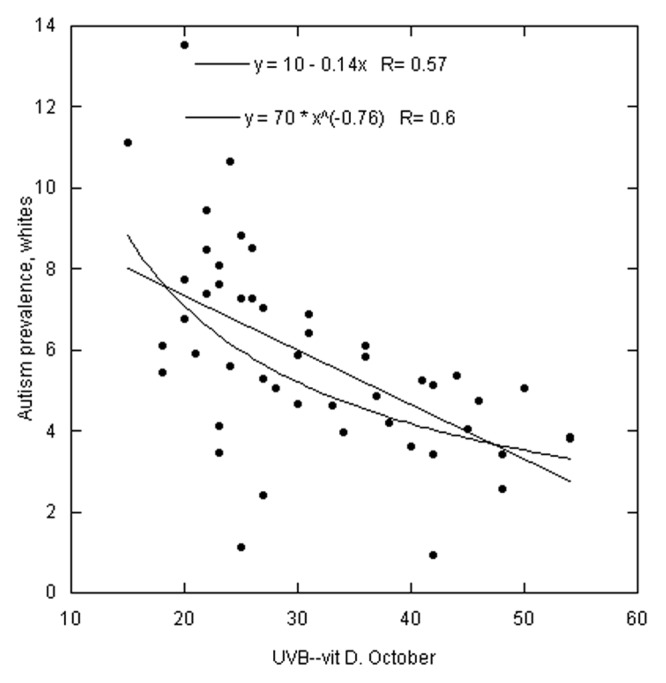
Figure 1. Scatter plot of autism prevalence for white Americans vs. solar UVB doses for October13 with linear and power-law fits to the data. Prevalence data are in arbitrary units. Omitted states: AK, HI and WY.
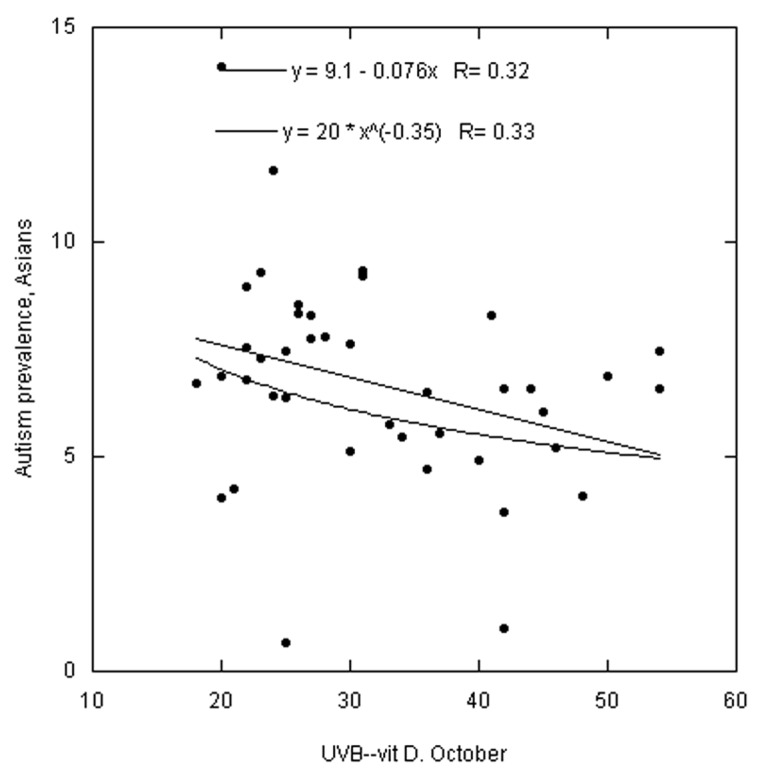
Figure 3. Same as Figure 1 but for Asian Americans. Omitted states: AK, DC, HI, ME, MT, ND, SD and WY.
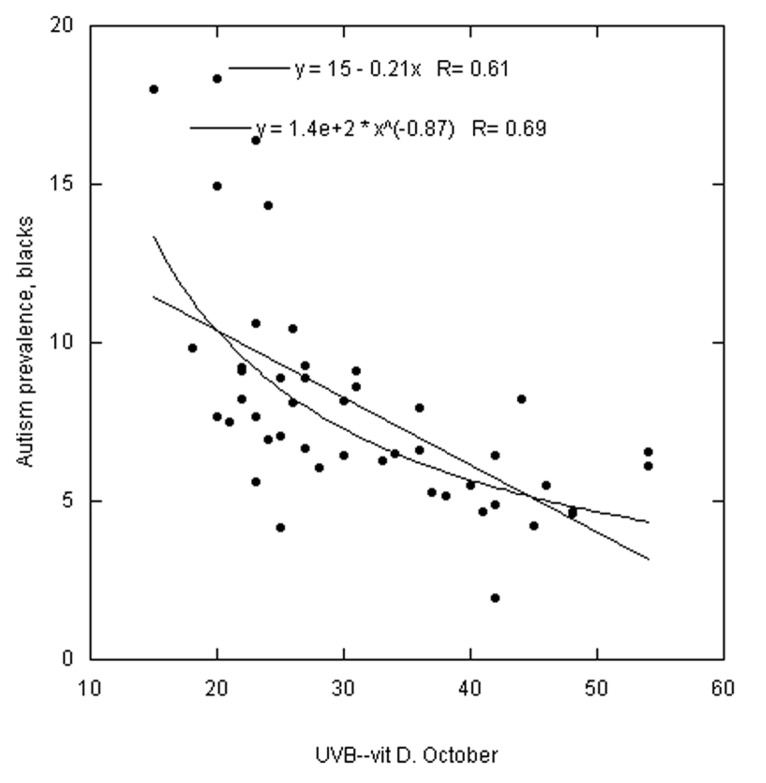
Figure 2. Same as Figure 1 but for black Americans. Omitted states: AK, AZ, HI, ND and WY.
Discussion
The finding that, for both white and Asian Americans, solar UVB doses for March, July and October are much stronger than UVB doses in January or latitude suggests that vitamin D’s effect is associated with vitamin D production from solar UVB when doses are relatively high. This finding is similar to those for many types of cancer.8,9 Other ecological studies directly correlated multiple sclerosis prevalence rates with latitude.10,11 The latitudinal dependence in the United States is considered an index of wintertime solar UVB doses12 because summertime solar UVB doses are highly asymmetrical, being highest in the Southwest and lowest in the Northeast.13 Low serum 25(OH)D concentrations in winter are associated with infectious diseases such as influenza,14 which peaks in winter. However, for black Americans, the results for latitude are comparable to those for UVB.
If we assume that solar UVB production of vitamin D is an important factor in reducing risk of autism, an important question is how vitamin D deficiency before and during pregnancy and in early life affects risk. Reasonable evidence exists that autism is due in part to genetic factors. For example, evidence indicates that vitamin D status affects both male and female fertility,15 which could be due to potential genetic effects on the fetus. In addition, monozygotic twins are more likely to be concordant for autism than dizygotic twins.16 Good evidence also exists that vitamin D deficiency during pregnancy leads to adverse birth outcomes. Maternal metabolic conditions during pregnancy (diabetes, hypertension and obesity) are associated with increased risk of offspring diagnosed with autism by age 5 y.17 Vitamin D deficiency is a risk factor for diabetes,18 and obesity is associated with lower serum 25(OH)D concentrations.19 Animal model studies have documented adverse effects on fetal brain development for vitamin D-deficient mothers.20 Although prompted by an interest in schizophrenia, Sullivan and colleagues21 associated family history of schizophrenia with increased risk of autism.
A study in Australia “found that the risk of women with vitamin D insufficiency (≤46 nmol/L) during pregnancy having a child with clinically significant language difficulties was increased close to twofold compared with women with vitamin D levels >70 nmol/L.”22 A study in the UK found that there were excess birth rates in April for several immune-mediated diseases found to be related to vitamin D deficiency in other studies, thereby providing evidence that vitamin D deficiency during fetal development is a risk factor for these diseases.23
Season of birth (or conception) affects risk of autism. In the 1980s and 1990s, excess birth rates for autism occurred around March.24,25 However, Zerbo and colleagues26 associated wintertime conception with increased risk of autism. Maternal infection during pregnancy is associated with increased risk of autism,3,27 as is elevated maternal temperature. See Edwards29 for an explanation of how infection through increasing body temperature, is a risk factor for adverse birth outcomes.
Vitamin D reduces risk of both bacterial and viral infection.30 Lower respiratory infections are relatively common during pregnancy.31 Influenza infection during pregnancy is associated with increased risk of schizophrenia in offspring.32 Vitamin D may reduce the risk of influenza32,33 as well as that of other acute respiratory infections.34
A study in Denmark found significantly increased risk of epilepsy for those born to mothers who experienced elevated temperature during pregnancy associated with infections.35 Both epilepsy and autism have elevated birth rates in winter and lower birth rates in summer or fall.24,36
Although the journal literature supports the evidence for vitamin D deficiency before or during pregnancy as an important risk factor for autism, this ecological study cannot determine whether vitamin D status after birth plays a role although Mostafa and Al-Ayadhi’s recent study indicates such a connection.4 Both genetics and environment affect risk of autism.16 However, separating genetic from environmental factors is difficult.37
Since differences were found for those with different skin pigmentation, there might be some effects of solar irradiance other than vitamin D production involved in the link between solar UVB doses and prevalence of autism. A number of papers have reviewed the neuroendocrinology of the skin.38-41 For example, keratinocytes stimulated by UVR can produce and secrete a number of cytokines.38 A recent study found that children with autism were “more likely to have decreased levels of both T helper-1(Th-1)-like cytokines (i.e. IFN-γ) and Th-2like cytokines (i.e. IL-4, IL-10).”42 Since darker pigmentation reduces the effect of UVR on keratinocytes, those with darker skin should produce fewer cytokines. Certainly more research is needed in this area.
UVA can increase serotonin production and reduce melatonin concentrations.43 “Low maternal plasma serotonin may be a risk factor for autism through effects on fetal brain development..”44 Those with autism may have a deficit of melatonin since supplementing them with melatonin improves sleep patterns.45 Since dark skin reduces the production of serotonin and degradation of melatonin, those with lighter skin have an decreased risk of autism and a recent review showed the opposite.46 Obviously, more work needs to be done in this area.
There is some evidence that UVR contributed to regulation of the hypothalamic-pituitary-adrenal (HPA) axis and the inflammatory response system and that they may have systemic effects.41 Prenatal stressors should increase the risk of autism and maternal stress during pregnancy is weakly associated with raised maternal cortisol.47 Thus, more research is needed in this area.
Vitamin D recommendations
The Institute of Medicine determined that pregnant women require only 600 IU/d (15 µg/day) of vitamin D3 (recommending the same for a 300-pound professional football lineman) and opine that a serum 25(OH)D concentration of 20 ng/ml is adequate.48 In the US, serum 25(OH)D concentrations during pregnancy are already low,49,50 and black Americans have much lower serum 25(OH)D concentrations than white Americans in general.51 The optimal serum 25(OH)D concentration during pregnancy is above 30 ng/ml based on a number of observational studies. Representative studies reporting that levels above 30 ng/ml are optimal include those related to pregnancy outcomes such as bacterial vaginosis,52 birth weight,53 primary Cesarean section delivery,54 and pre-eclampsia.55 In addition, gestational 25(OH)D concentrations are associated with normal fetal brain development20,56 and levels above 30 ng/ml are associated with reduced risk of childhood neuropsychological impairments,57 and development language difficulties.58
There is also evidence that serum 25(OH)D concentrations above 40 ng/ml might be considered optimal during pregnancy since optimal production of 1,25-dihydroxyvitamin D was achieved above this value in a randomized controlled trial with pregnant women.59,60 No adverse effects on calcium metabolism or other parameters were apparent in pregnant women taking 4000 IU/d of vitamin D3.60 A recent study of 25(OH)D levels in women living a traditional life style near the equator found mean serum 25(OH)D levels of nearly 60 ng/ml in pregnancy, approximately triple that of pregnant women in more developed poleward countries who putatively live and work indoors.61
The optimum 25(OH)D levels for children with autism are unknown although Mostafa and Al-Ayadhi found a strong negative correlation between autism rating scales and 25(OH)D levels in children with autism.4 They did not report a flattening of the association with higher vitamin D levels and improved autism scores although their study was limited by both the sample size and the low number of children with higher vitamin D levels. They also found autistic children have lower 25(OH)D levels than do control children although both groups reported similar time outdoors.
Mean “natural” 25(OH)D levels (as opposed to “normal” 25(OH)D levels) are around 46 ng/ml, as recently discovered by Luxwolda et al. who studied 25(OH)D levels of hunter-gatherers in equatorial Tanzania.62 Such “natural” 25(OH)D levels were common among tanned lifeguards in Missouri.63
Conclusion
This ecological study finds that autism prevalence among those aged 6–17 y in 2010 was significantly inversely correlated with solar UVB doses. Taken together, these results and other findings strongly implicate vitamin D deficiency as an important risk factor for developing autism. Maternal vitamin D deficiency appears to play an important role although we cannot discount a role of vitamin D deficiency in early life. Further studies should evaluate the UVB-vitamin D-autism hypothesis in both pregnant women and children with autism.
Methods
WBG obtained prevalence data from the Data Accountability Center associated with the Individuals with Disabilities Education Act data. The numbers of children by state with autism in 2010 are from Part B, Child Count (https://www.ideadata.org/PartBChildCount.asp (accessed Dec 16, 2011). Data used included the number of children with autism aged 6–17 y; those aged 6–21 y; and number of Asian, black and white children aged 6–21 y with autism. The data for those aged 6–17 y were not separated by race. WBG used the data by race for those aged 6–21 y with autism to estimate the number by race of those aged 6–17 y.
The data for total population aged 6–17 y by state are from Part C, Population and Enrollment Data, Table C-4, Number of and percentage change in estimated resident population ages 6–17, by state: 2001, 2009 and 2010 (https://www.ideadata.org/PopulationData.asp#2010 [accessed Dec 16, 2011]).
WBG calculated the estimated population by race and state for children aged 6–17 y, he calculated numbers of autism children for each race and state. WBG obtained racial populations by state for children aged 5–17 y in 2009 from the US. Census Bureau (http://www.census.gov/compendia/statab/cats/population/estimates_and_projections_by_age_sex_raceethnicity.html [accessed Dec 18, 2011]). The fractions for single races were as follows: white (including Hispanics), 0.760; black, 0.151; and Asian, 0.043. WBG used these values to apportion the population by state into the three racial categories to calculate autism rates by race and state.
The independent variables used in this ecological study were solar UVB doses and latitude. WBG used two sets of data for UVB doses. One was DNA-weighted surface UVB doses from the Total Ozone Mapping Spectrometer (TOMS) for noon for July 1992.64 Grant and Garland9 used these data in an ecological study of cancer mortality rates. The other data set was monthly solar UVB doses weighted for vitamin D production from TOMS, validated using ground-based measurements and averaged over the period 1980–1990 for 12:00–12:59 p.m. local time.13 Solar UVB doses in the US in summer are highly asymmetric, with levels highest in the Southwest, lowest in the Northeast. The reasons for this asymmetry include that surface elevations are higher in the West, whereas stratospheric ozone column contents are lower. In addition, the Northeast has greater aerosol loading and cloud cover. For both sets of data, WBG estimated the UVB dose for each state from the maps in an effort to weight it by each state’s population distribution. A problem with the data maps from Fioletov and colleagues is that the contours are closely spaced in the Southwest, making this graphical approach less reliable for those states.
Latitude is an index for wintertime solar UVB dose and vitamin D production because solar zenith angle is much more important in winter than is surface elevation and stratospheric ozone column content. WBG chose latitude data to be near the center of population for each state. The second-order regression with latitude yielded the best model for multiple sclerosis prevalence among veterans of World War II and the Korean War in the US10 Scientists have linked multiple sclerosis to the Epstein-Barr virus, and other diseases linked to this virus have peak rates in March.65
This report omits data for AK and HI because those states are at the extreme latitudes and were not used in other ecological studies such as those regarding solar UVB and cancer.8 No data were available for Wyoming. In addition, some states have few Asians and/or blacks with autism, yielding poor estimates of autism rates. For black Americans, analyses omitted AZ and ND. For Asian Americans, DC, ME, MT, ND and SD were also omitted.
The analyses also used data for several possible risk-modifying factors, as has been done for cancer.9 These factors included alcohol consumption, lung cancer mortality rates for females, obesity, fraction of population living below poverty level and particulate air pollution concentrations.
WBG conducted linear regression analyses with the SPSS 20.0 statistical package (IBM/SPSS, Chicago, IL) and power law regression analyses with KaleidaGraph version 4.02 (Synergy Software, Reading, PA). Graphs were prepared using KaleidaGraph.
Disclosure of Potential Conflicts of Interest
W.B.G. receives funding from the UV Foundation (McLean, VA), Bio-Tech Pharmacal (Fayetteville, AR), the Vitamin D Council (San Luis Obispo, CA), the Vitamin D Society (Canada) and the Sunlight Research Forum (Veldhoven). J.J.C. is president of the Vitamin D Council and receives remuneration from Purity Products, Inc.
Footnotes
Previously published online: www.landesbioscience.com/journals/dermatoendocrinology/article/22942
References
- 1.Cannell JJ. Autism and vitamin D. Med Hypotheses. 2008;70:750–9. doi: 10.1016/j.mehy.2007.08.016. [DOI] [PubMed] [Google Scholar]
- 2.Cannell JJ. On the aetiology of autism. Acta Paediatr. 2010;99:1128–30. doi: 10.1111/j.1651-2227.2010.01883.x. [DOI] [PMC free article] [PubMed] [Google Scholar]
- 3.Kinney DK, Barch DH, Chayka B, Napoleon S, Munir KM. Environmental risk factors for autism: do they help cause de novo genetic mutations that contribute to the disorder? Med Hypotheses. 2010;74:102–6. doi: 10.1016/j.mehy.2009.07.052. [DOI] [PMC free article] [PubMed] [Google Scholar]
- 4.Mostafa GA, Al-Ayadhi LY. Reduced serum concentrations of 25-hydroxy vitamin D in children with autism: relation to autoimmunity. J Neuroinflammation. 2012;9:201. doi: 10.1186/1742-2094-9-201. [DOI] [PMC free article] [PubMed] [Google Scholar]
- 5.Kočovská E, Fernell E, Billstedt E, Minnis H, Gillberg C. Vitamin D and autism: clinical review. Res Dev Disabil. 2012;33:1541–50. doi: 10.1016/j.ridd.2012.02.015. [DOI] [PubMed] [Google Scholar]
- 6.Los Angeles Times Autism rates by state, December 9, 2011; Credits: Interactivity: Pesce A. | Research: Poindexter S, Smith D, Zarembo A. [http://graphics.latimes.com/usmap-autism-rates-state/, accessed July 3, 2012]
- 7.Devesa SS, Grauman DJ, Blot WJ, Pennello GA, Hoover RN, Fraumeni JF Jr. Atlas of Cancer Mortality in the United States, 1950-1994. NIH Publication No. 99-4564, 1999. [Google Scholar]
- 8.Grant WB. An estimate of premature cancer mortality in the U.S. due to inadequate doses of solar ultraviolet-B radiation. Cancer. 2002;94:1867–75. doi: 10.1002/cncr.10427. [DOI] [PubMed] [Google Scholar]
- 9.Grant WB, Garland CF. The association of solar ultraviolet B (UVB) with reducing risk of cancer: multifactorial ecologic analysis of geographic variation in age-adjusted cancer mortality rates. Anticancer Res. 2006;26(4A):2687–99. [PubMed] [Google Scholar]
- 10.Kurtzke JF. Epidemiologic evidence for multiple sclerosis as an infection. Clin Microbiol Rev. 1993;6:382–427. doi: 10.1128/cmr.6.4.382. [DOI] [PMC free article] [PubMed] [Google Scholar]
- 11.Grant WB, Holick MF. Benefits and requirements of vitamin D for optimal health: a review. Altern Med Rev. 2005;10:94–111. [PubMed] [Google Scholar]
- 12.Grant WB. Hypothesis--ultraviolet-B irradiance and vitamin D reduce the risk of viral infections and thus their sequelae, including autoimmune diseases and some cancers. Photochem Photobiol. 2008;84:356–65. doi: 10.1111/j.1751-1097.2007.00266.x. [DOI] [PubMed] [Google Scholar]
- 13.Fioletov VE, McArthur LJ, Mathews TW, Marrett L. Estimated ultraviolet exposure levels for a sufficient vitamin D status in North America. J Photochem Photobiol B. 2010;100:57–66. doi: 10.1016/j.jphotobiol.2010.05.002. [DOI] [PubMed] [Google Scholar]
- 14.Cannell JJ, Vieth R, Umhau JC, Holick MF, Grant WB, Madronich S, et al. Epidemic influenza and vitamin D. Epidemiol Infect. 2006;134:1129–40. doi: 10.1017/S0950268806007175. [DOI] [PMC free article] [PubMed] [Google Scholar]
- 15.Lerchbaum E, Obermayer-Pietsch B. Vitamin D and fertility: a systematic review. Eur J Endocrinol. 2012;166:765–78. doi: 10.1530/EJE-11-0984. [DOI] [PubMed] [Google Scholar]
- 16.Hallmayer J, Cleveland S, Torres A, Phillips J, Cohen B, Torigoe T, et al. Genetic heritability and shared environmental factors among twin pairs with autism. Arch Gen Psychiatry. 2011;68:1095–102. doi: 10.1001/archgenpsychiatry.2011.76. [DOI] [PMC free article] [PubMed] [Google Scholar]
- 17.Krakowiak P, Walker CK, Bremer AA, Baker AS, Ozonoff S, Hansen RL, et al. Maternal metabolic conditions and risk for autism and other neurodevelopmental disorders. Pediatrics. 2012;129:e1121–8. doi: 10.1542/peds.2011-2583. [DOI] [PMC free article] [PubMed] [Google Scholar]
- 18.Pittas AG, Nelson J, Mitri J, Hillmann W, Garganta C, Nathan DM, et al. Diabetes Prevention Program Research Group Plasma 25-hydroxyvitamin D and progression to diabetes in patients at risk for diabetes: an ancillary analysis in the Diabetes Prevention Program. Diabetes Care. 2012;35:565–73. doi: 10.2337/dc11-1795. [DOI] [PMC free article] [PubMed] [Google Scholar]
- 19.Drincic AT, Armas LA, Van Diest EE, Heaney RP. Volumetric dilution, rather than sequestration best explains the low vitamin D status of obesity. Obesity (Silver Spring) 2012;20:1444–8. doi: 10.1038/oby.2011.404. [DOI] [PubMed] [Google Scholar]
- 20.Eyles D, Burne T, McGrath J. Vitamin D in fetal brain development. Semin Cell Dev Biol. 2011;22:629–36. doi: 10.1016/j.semcdb.2011.05.004. [DOI] [PubMed] [Google Scholar]
- 21.Sullivan PF, Magnusson C, Reichenberg A, Boman M, Dalman C, Davidson M, et al. Family history of schizophrenia and bipolar disorder as risk factors for autism. Arch Gen Psychiatry. 2012:1–5. doi: 10.1001/archgenpsychiatry.2012.730. [DOI] [PMC free article] [PubMed] [Google Scholar]
- 22.Whitehouse AJ, Holt BJ, Serralha M, Holt PG, Kusel MM, Hart PH. Maternal serum vitamin D levels during pregnancy and offspring neurocognitive development. Pediatrics. 2012;129:485–93. doi: 10.1542/peds.2011-2644. [DOI] [PubMed] [Google Scholar]
- 23.Disanto G, Chaplin G, Morahan JM, Giovannoni G, Hypponen E, Ebers GC, et al. Month of birth, vitamin D and risk of immune mediated disease: a case control study. BMC Med. 2012;10:69. doi: 10.1186/1741-7015-10-69. [DOI] [PMC free article] [PubMed] [Google Scholar]
- 24.Gillberg C. Do children with autism have March birthdays? Acta Psychiatr Scand. 1990;82:152–6. doi: 10.1111/j.1600-0447.1990.tb01373.x. [DOI] [PubMed] [Google Scholar]
- 25.Grant WB, Soles CM. Epidemiologic evidence supporting the role of maternal vitamin D deficiency as a risk factor for the development of infantile autism. Dermatoendocrinol. 2009;1:223–8. doi: 10.4161/derm.1.4.9500. [DOI] [PMC free article] [PubMed] [Google Scholar]
- 26.Zerbo O, Iosif AM, Delwiche L, Walker C, Hertz-Picciotto I. Month of conception and risk of autism. Epidemiology. 2011;22:469–75. doi: 10.1097/EDE.0b013e31821d0b53. [DOI] [PMC free article] [PubMed] [Google Scholar]
- 27.Brown AS. Epidemiologic studies of exposure to prenatal infection and risk of schizophrenia and autism. Dev Neurobiol. 2012;72:1272–6. doi: 10.1002/dneu.22024. [DOI] [PMC free article] [PubMed] [Google Scholar]
- 28.Zerbo O, Iosif AM, Walker C, Ozonoff S, Hansen RL, Hertz-Picciotto I. Is maternal influenza or fever during pregnancy associated with autism or developmental delays? Results from the CHARGE (CHildhood Autism Risks from Genetics and Environment) Study. J Autism Dev Disord. 2012 doi: 10.1007/s10803-012-1540-x. In press. [DOI] [PMC free article] [PubMed] [Google Scholar]
- 29.Edwards MJ. Review: Hyperthermia and fever during pregnancy. Birth Defects Res A Clin Mol Teratol. 2006;76:507–16. doi: 10.1002/bdra.20277. [DOI] [PubMed] [Google Scholar]
- 30.Gombart AF. The vitamin D-antimicrobial peptide pathway and its role in protection against infection. Future Microbiol. 2009;4:1151–65. doi: 10.2217/fmb.09.87. [DOI] [PMC free article] [PubMed] [Google Scholar]
- 31.Lim U, Freedman DM, Hollis BW, Horst RL, Purdue MP, Chatterjee N, et al. A prospective investigation of serum 25-hydroxyvitamin D and risk of lymphoid cancers. Int J Cancer. 2009;124:979–86. doi: 10.1002/ijc.23984. [DOI] [PMC free article] [PubMed] [Google Scholar]
- 32.McGrath JJ, Welham JL. Season of birth and schizophrenia: a systematic review and meta-analysis of data from the Southern Hemisphere. Schizophr Res. 1999;35:237–42. doi: 10.1016/S0920-9964(98)00139-X. [DOI] [PubMed] [Google Scholar]
- 33.Urashima M, Segawa T, Okazaki M, Kurihara M, Wada Y, Ida H. Randomized trial of vitamin D supplementation to prevent seasonal influenza A in schoolchildren. Am J Clin Nutr. 2010;91:1255–60. doi: 10.3945/ajcn.2009.29094. [DOI] [PubMed] [Google Scholar]
- 34.Sabetta JR, DePetrillo P, Cipriani RJ, Smardin J, Burns LA, Landry ML. Serum 25-hydroxyvitamin d and the incidence of acute viral respiratory tract infections in healthy adults. PLoS ONE. 2010;5:e11088. doi: 10.1371/journal.pone.0011088. [DOI] [PMC free article] [PubMed] [Google Scholar]
- 35.Sun Y, Vestergaard M, Christensen J, Olsen J. Prenatal exposure to elevated maternal body temperature and risk of epilepsy in childhood: a population-based pregnancy cohort study. Paediatr Perinat Epidemiol. 2011;25:53–9. doi: 10.1111/j.1365-3016.2010.01143.x. [DOI] [PubMed] [Google Scholar]
- 36.Torrey EF, Miller J, Rawlings R, Yolken RH. Seasonal birth patterns of neurological disorders. Neuroepidemiology. 2000;19:177–85. doi: 10.1159/000026253. [DOI] [PubMed] [Google Scholar]
- 37.Anderson GM. Twin studies in autism: what might they say about genetic and environmental influences. J Autism Dev Disord. 2012;42:1526–7. doi: 10.1007/s10803-012-1552-6. [DOI] [PubMed] [Google Scholar]
- 38.Slominski A, Wortsman J. Neuroendocrinology of the skin. Endocr Rev. 2000;21:457–87. doi: 10.1210/er.21.5.457. [DOI] [PubMed] [Google Scholar]
- 39.Slominski A, Tobin DJ, Shibahara S, Wortsman J. Melanin pigmentation in mammalian skin and its hormonal regulation. Physiol Rev. 2004;84:1155–228. doi: 10.1152/physrev.00044.2003. [DOI] [PubMed] [Google Scholar]
- 40.Slominski A. Neuroendocrine activity of the melanocyte. Exp Dermatol. 2009;18:760–3. doi: 10.1111/j.1600-0625.2009.00892.x. [DOI] [PMC free article] [PubMed] [Google Scholar]
- 41.Slominski AT, Zmijewski MA, Skobowiat C, Zbytek B, Slominski RM, Steketee JD. Sensing the environment: regulation of local and global homeostasis by the skin’s neuroendocrine system. Adv Anat Embryol Cell Biol. 2012;212:v–, vii, 1-115. doi: 10.1007/978-3-642-19683-6_1. [DOI] [PMC free article] [PubMed] [Google Scholar]
- 42.Abdallah MW, Larsen N, Mortensen EL, Atladóttir HÓ, Nørgaard-Pedersen B, Bonefeld-Jørgensen EC, et al. Neonatal levels of cytokines and risk of autism spectrum disorders: an exploratory register-based historic birth cohort study utilizing the Danish Newborn Screening Biobank. J Neuroimmunol. 2012;252:75–82. doi: 10.1016/j.jneuroim.2012.07.013. [DOI] [PubMed] [Google Scholar]
- 43.Gambichler T, Bader A, Vojvodic M, Bechara FG, Sauermann K, Altmeyer P, et al. Impact of UVA exposure on psychological parameters and circulating serotonin and melatonin. BMC Dermatol. 2002;2:6. doi: 10.1186/1471-5945-2-6. [DOI] [PMC free article] [PubMed] [Google Scholar]
- 44.Connors SL, Matteson KJ, Sega GA, Lozzio CB, Carroll RC, Zimmerman AW. Plasma serotonin in autism. Pediatr Neurol. 2006;35:182–6. doi: 10.1016/j.pediatrneurol.2006.02.010. [DOI] [PubMed] [Google Scholar]
- 45.Doyen C, Mighiu D, Kaye K, Colineaux C, Beaumanoir C, Mouraeff Y, et al. Melatonin in children with autistic spectrum disorders: recent and practical data. Eur Child Adolesc Psychiatry. 2011;20:231–9. doi: 10.1007/s00787-011-0162-8. [DOI] [PubMed] [Google Scholar]
- 46.Dealberto MJ. Prevalence of autism according to maternal immigrant status and ethnic origin. Acta Psychiatr Scand. 2011;123:339–48. doi: 10.1111/j.1600-0447.2010.01662.x. [DOI] [PubMed] [Google Scholar]
- 47.O’Donnell K, O’Connor TG, Glover V. Prenatal stress and neurodevelopment of the child: focus on the HPA axis and role of the placenta. Dev Neurosci. 2009;31:285–92. doi: 10.1159/000216539. [DOI] [PubMed] [Google Scholar]
- 48.Ross AC, Manson JE, Abrams SA, Aloia JF, Brannon PM, Clinton SK, et al. The 2011 report on dietary reference intakes for calcium and vitamin D from the Institute of Medicine: what clinicians need to know. J Clin Endocrinol Metab. 2011;96:53–8. doi: 10.1210/jc.2010-2704. [DOI] [PMC free article] [PubMed] [Google Scholar]
- 49.Bodnar LM, Simhan HN, Powers RW, Frank MP, Cooperstein E, Roberts JM. High prevalence of vitamin D insufficiency in black and white pregnant women residing in the northern United States and their neonates. J Nutr. 2007;137:447–52. doi: 10.1093/jn/137.2.447. [DOI] [PMC free article] [PubMed] [Google Scholar]
- 50.Ginde AA, Sullivan AF, Mansbach JM, Camargo CA., Jr. Vitamin D insufficiency in pregnant and nonpregnant women of childbearing age in the United States. Am J Obstet Gynecol. 2010;202:436–, e1-8. doi: 10.1016/j.ajog.2009.11.036. [DOI] [PMC free article] [PubMed] [Google Scholar]
- 51.Ginde AA, Liu MC, Camargo CA., Jr. Demographic differences and trends of vitamin D insufficiency in the US population, 1988-2004. Arch Intern Med. 2009;169:626–32. doi: 10.1001/archinternmed.2008.604. [DOI] [PMC free article] [PubMed] [Google Scholar]
- 52.Bodnar LM, Krohn MA, Simhan HN. Maternal vitamin D deficiency is associated with bacterial vaginosis in the first trimester of pregnancy. J Nutr. 2009;139:1157–61. doi: 10.3945/jn.108.103168. [DOI] [PMC free article] [PubMed] [Google Scholar]
- 53.Bodnar LM, Catov JM, Zmuda JM, Cooper ME, Parrott MS, Roberts JM, et al. Maternal serum 25-hydroxyvitamin D concentrations are associated with small-for-gestational age births in white women. J Nutr. 2010;140:999–1006. doi: 10.3945/jn.109.119636. [DOI] [PMC free article] [PubMed] [Google Scholar]
- 54.Merewood A, Mehta SD, Chen TC, Bauchner H, Holick MF. Association between vitamin D deficiency and primary cesarean section. J Clin Endocrinol Metab. 2009;94:940–5. doi: 10.1210/jc.2008-1217. [DOI] [PMC free article] [PubMed] [Google Scholar]
- 55.Bodnar LM, Catov JM, Simhan HN, Holick MF, Powers RW, Roberts JM. Maternal vitamin D deficiency increases the risk of preeclampsia. J Clin Endocrinol Metab. 2007;92:3517–22. doi: 10.1210/jc.2007-0718. [DOI] [PMC free article] [PubMed] [Google Scholar]
- 56.Harms LR, Burne TH, Eyles DW, McGrath JJ. Vitamin D and the brain. Best Pract Res Clin Endocrinol Metab. 2011;25:657–69. doi: 10.1016/j.beem.2011.05.009. [DOI] [PubMed] [Google Scholar]
- 57.Morales E, Guxens M, Llop S, Rodríguez-Bernal CL, Tardón A, Riaño I, et al. INMA Project Circulating 25-hydroxyvitamin D3 in pregnancy and infant neuropsychological development. Pediatrics. 2012;130:e913–20. doi: 10.1542/peds.2011-3289. [DOI] [PubMed] [Google Scholar]
- 58.Whitehouse AJ, Holt BJ, Serralha M, Holt PG, Kusel MM, Hart PH. Maternal serum vitamin D levels during pregnancy and offspring neurocognitive development. Pediatrics. 2012;129:485–93. doi: 10.1542/peds.2011-2644. [DOI] [PubMed] [Google Scholar]
- 59.Hollis BW, Wagner CL. Vitamin D requirements and supplementation during pregnancy. Curr Opin Endocrinol Diabetes Obes. 2011;18:371–5. doi: 10.1097/MED.0b013e32834b0040. [DOI] [PMC free article] [PubMed] [Google Scholar]
- 60.Hollis BW, Johnson D, Hulsey TC, Ebeling M, Wagner CL. Vitamin D supplementation during pregnancy: double-blind, randomized clinical trial of safety and effectiveness. J Bone Miner Res. 2011;26:2341–57. doi: 10.1002/jbmr.463. [DOI] [PMC free article] [PubMed] [Google Scholar]
- 61.Luxwolda MF, Kuipers RS, Kema IP, van der Veer E, Dijck-Brouwer DA, Muskiet FA. Vitamin D status indicators in indigenous populations in East Africa. Eur J Nutr. 2012 doi: 10.1007/s00394-012-0421-6. In press. [DOI] [PubMed] [Google Scholar]
- 62.Luxwolda MF, Kuipers RS, Kema IP, Janneke Dijck-Brouwer DA, Muskiet FA. Traditionally living populations in East Africa have a mean serum 25-hydroxyvitamin D concentration of 115 nmol/l. Br J Nutr. 2012;108:1557–61. doi: 10.1017/S0007114511007161. [DOI] [PubMed] [Google Scholar]
- 63.Haddad JG, Chyu KJ. Competitive protein-binding radioassay for 25-hydroxycholecalciferol. J Clin Endocrinol Metab. 1971;33:992–5. doi: 10.1210/jcem-33-6-992. [DOI] [PubMed] [Google Scholar]
- 64.Leffell DJ, Brash DE. Sunlight and skin cancer. Sci Am. 1996;275:52–3, 56-9. doi: 10.1038/scientificamerican0796-52. [DOI] [PubMed] [Google Scholar]
- 65.Douglas AS, Brown T, Reid D. Infectious mononucleosis and Hodgkin’s disease--a similar seasonality. Leuk Lymphoma. 1996;23:323–31. doi: 10.3109/10428199609054835. [DOI] [PubMed] [Google Scholar]