

Abstract
Often, high sensitivity, point of care, clinical tests, such as HIV viral load, require large volumes of plasma. Although centrifuges are ubiquitously used in clinical laboratories to separate plasma from whole blood, centrifugation is generally inappropriate for on-site testing. Suitable alternatives are not readily available to separate the relatively large volumes of plasma from milliliters of blood that may be needed to meet stringent limit-of-detection specifications for low abundance target molecules. We report on a simple to use, low-cost, pump-free, membrane-based, sedimentation-assisted plasma separator capable of separating a relatively large volume of plasma from undiluted whole blood within minutes. This plasma separator consists of an asymmetric, porous, polysulfone membrane housed in a disposable chamber. The separation process takes advantage of both gravitational sedimentation of blood cells and size exclusion-based filtration. The plasma separator demonstrated a “blood in-plasma out” capability, consistently extracting 275 ±33.5 μL of plasma from 1.8 mL of undiluted whole blood in less than 7 min. The device was used to separate plasma laden with HIV viruses from HIV virus-spiked whole blood with recovery efficiencies of 95.5% ± 3.5%, 88.0% ± 9.5%, and 81.5% ± 12.1% for viral loads of 35,000, 3,500 and 350 copies/mL, respectively. The separation process is self-terminating to prevent excessive hemolysis. The HIV-laden plasma was then injected into our custom-made microfluidic chip for nucleic acid Testing And Was Successfully Subjected To Reverse Transcriptase Loop mediated isothermal amplification (RT-LAMP), demonstrating that the plasma is sufficiently pure to support high efficiency nucleic acid amplification.
Introduction
Over two-thirds of the estimated 34 million people living with HIV/AIDS worldwide reside in developing countries, and nearly three-fourths of the 2.5 million new HIV infections in 2011 occurred in these countries.1,2 HIV viral load testing plays a critical role in clinical decisions on when and whether to switch to second-line treatment; in optimizing the duration of first-line treatment by detecting occult non-adherence; in diagnosing HIV infection in babies under 18 months of age, born to HIV-infected mothers, in whom the presence of HIV antibodies is not indicative of the disease; and in detecting early newly-infected individuals during the seroconversion window period when antibodies are present at undetectable concentrations.3-7 Although a standard practice in developed countries, HIV viral load determination is not widely used in low and middle income countries because of technical constraints, lack of testing facilities, lack of trained personnel, and cost. There is an urgent need to develop an affordable, simple, easy to use point-of-care (POC) diagnosis technology for HIV viral load testing in resource-constrained settings. 8-11
Usually, plasma separation from raw whole blood is required for HIV viral load testing since the presence of blood cells and components in the sample, such as hemoglobin and lactoferrin, may inhibit DNA polymerase and lead to low amplification efficiency, inaccurate quantification, and even amplification failure.12 Additionally, prevailing HIV viral load standards are based on the number of virus copies in a unit volume of plasma – not whole blood. In clinical laboratories, plasma separation is typically carried out with a bench-top centrifuge. Separation of relatively large volumes of plasma from whole blood remains a challenge in resource-constrained settings due to lack of laboratory infrastructure.13-15
Various microfluidic approaches have been developed to separate plasma from whole blood at the point of care,16-26 including capillary imbibition,16,17 blood cell sedimentation,18,19 cross-flow filtration,20-22 and on-chip centrifugation.23,24 VanDelinder et al.21 reported on a poly(dimethylsiloxane) (PDMS)-based microfluidic device for separation of plasma from whole human blood by size exclusion in a cross-flow. The device can operate for at least 1 h, extracting ∼8% of the blood volume as plasma at an average rate of 0.65 μL/min. Shim et al.16 demonstrated a heterogeneous packed bed filter, where small beads filter the whole blood and larger beads prevent the smaller beads from leaving the separation device. Capillary forces drive the plasma through a microchannel with a cross-section of 100 μm × 100 μm at a flow rate of 0.19 μL/min. Dimov et al.19 presented a self-powered, integrated microfluidic blood analysis system (SIMBAS) with nearly 100% blood cell filtration efficiency for low blood flow rates (<50 μL/h). All the above devices work with minute volumes of blood and plasma, which are insufficient for conventional nucleic acid-based molecular diagnostics such as PCR. 27
To overcome the shortcomings of the above devices, Amasia and Madou23 developed a compact disk (CD)-like device. This centrifugation approach requires a high speed spinner and electrical power, which may not be readily available in resource limited settings. Membrane-based separation provides an attractive alternative to centrifugation. Recently, several membrane-based plasma separation devices have been developed and tested.28-33 Homsy et al.29 described a microfluidic blood filtration element (BFE), operating with a Vivid™ plasma separation membrane, capable of extracting 12 μL of plasma from 100 μL of undiluted, whole blood within about 10 min. The device used an external vacuum pump to provide negative pressure for plasma extraction. Wang et al.30 reported on a similar microfluidic-based plasma separation chip with an embedded 2-μm pore size membrane filter for plasma and HIV virus separation. To avoid the use of a pump, Wang et al.30 extracted plasma containing HIV virus from 40 μL of whole blood by washing it with 300 μLPBS buffer. Such extensive dilution may, however, adversely affect the limit-of-detection, which is critical in viral load detection.
In this article, we describe a simple to manufacture and use, disposable, pump-free, membrane-based, sedimentation-assisted, plasma separation device for large-volume, relatively rapid plasma extraction from raw, whole blood. In addition to the membrane-based filtration, our separator takes advantage of gravitational sedimentation of blood cells to reduce membrane clogging and to enable the extraction of relatively large plasma volumes directly with a pipette without a pump and/or excessive wash. Our separator provides “blood in-plasma out” for preprocessing samples for nucleic acid-based testing. We demonstrated extraction of 275 ±33.5 μL plasma from 1.8 mL undiluted whole blood in 7 minutes. The utility of this membrane-based, sedimentation-assisted, plasma separator for diagnostics was tested by separating plasma containing HIV virus from whole blood spiked with HIV. The HIV-laden plasma was then inserted into a microfluidic chip that carried out nucleic acid extraction and amplification, demonstrating that the virus was retained in the plasma, potential polymerase inhibitors were successfully removed, and the plasma was of sufficient purity for polymerase activity. The plasma separator described herein can be used as a stand-alone module to separate plasma from whole blood. In this mode of operation, the device is suitable for use for onsite testing in resource-poor regions of the world, where funds, trained personnel, and laboratory facilities are in short supply and in settings lacking electrical power. While our primary motivation for developing the plasma separator described herein is HIV viral load testing, our plasma separator is likely to be useful in many other critical applications.
Experimental Section
Large-volume plasma separator
The plasma separator consists of a 21 mm wide × 11 mm thick × 40 mm tall polymethyl methacrylate) (PMMA) chamber whose wide side walls are covered with plasma separation membranes (Fig. 1). The plasma separator chamber is comprised of two bonded, machined PMMA compartments (items L and R in Fig. 1A). Each PMMA compartment was machined from a 5.5 mm (0.216”) thick PMMA slab. A 38 mm tall × 15 mm wide × 2.5 mm deep depression was milled into each of the slabs with a precision, computer numerical control (CNC) milling machine (HAAS Automation Inc.).34 An array of micropillars, each 300 μm long, 300 μm wide, and 100 μm deep, with a pitch of 800 μm was milled into the floor of the depression. Alternatively, the pillar array can be hot-embossed as we have previously done for another purpose.35 The micropillar array serves as a support for the plasma separation membrane. The space outside the pillars is connected to a 500 μL wide and 200 μm deep horizontal plasma collection trench located at the bottom of the PMMA compartment. The bottom of the pillar array region connects to the collection trench with a 500 μm diameter, vertical vias. The collection trench was covered with transparent tape (Polyvinyl Films, Inc., Sutton, MA). The main plasma collection conduit was machined at the back of the right compartment (Fig. 1A and Fig. S1 in the Supporting Information). At its top, the plasma collection conduit terminated with a 1.0 mm diameter exit port. The size of the exit port was designed to match tightly the outer diameter of a 200 μL pipette tip that is used to collect the plasma. The bottom of the plasma collection conduit was connected to the collection trench.
Fig. 1.
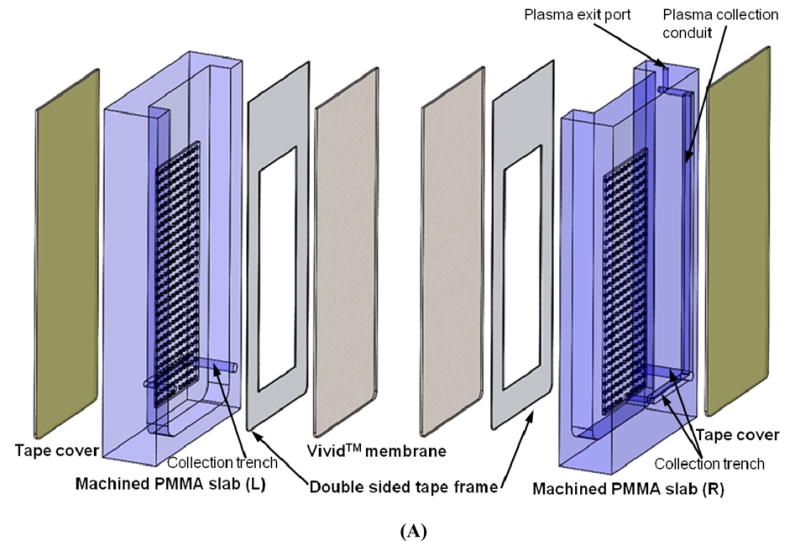

(A) An exploded view of the pump-free, membrane-based, sedimentation-assisted, plasma separator. The device consists of two machined PMMA compartments, two Vivid™ plasma separation membranes, two double-sided adhesive tape frames, and two transparent tape covers. (B) A photograph of a membrane-based, sedimentation-assisted, plasma separator shown next to a US dime coin.
An asymmetric polysulfone membrane (Vivid™ GR, Pall Life Sciences, East Hills, NY) was cut to 38 mm length × 15 mm width with a CO2 laser machine (Universal Laser Systems). A double sided adhesive tape (McMaster-Carr, New Brunswick, NJ) was cut with the laser to the same external dimensions as the membrane. A rectangular window 20 mm long × 10 mm wide (an area of 2 cm2) was then removed from the adhesive tape center to leave a rectangular frame. The adhesive frame was then attached to the plasma separation membrane. The resulting laminate was placed on top of the pillar array and pasted to the frame surrounding the pillar array to entirely cover the pillar array. The two PMMA compartments were then solvent-bonded with acetonitrile (Sigma-Aldrich) at room temperature to form the plasma separator shown in the photograph in Fig. 1B.
When the plasma separator's chamber was filled with blood, the separator allowed plasma to filter through the plasma separation membrane into the space among the pillars, drain to the bottom of the pillar array and into the collection trench. The exposed area of each membrane available for plasma filtration was approximately 2 cm2, providing a total filtration area of approximately 4 cm2.
Sample preparation and device testing
De-identified whole blood samples from healthy donors were collected by the Penn Center for AIDS Research (CFAR) with the approval of the Institutional Review Board (protocol: 814752) and stored in 10 mL Vacutainer® (Becton-Dickinson) blood collection tubes containing ethylenediaminetetraacetic acid (EDTA) anticoagulant. All fresh blood samples were handled without any dilution. The blood samples were spiked with intact HIV-1 virus (AcroMetrix® HIV-1 High Control, Benicia, CA) to concentrations of 3.5 × 10⁴, 3.5 × 10³, and 3.5 × 10² copies/mL.
The 1.8 mL volume of the EDTA anticoagulated whole blood spiked with the virus was manually loaded into the plasma separation chamber with a 1.0 mL pipette (Fig. 2A). The blood was left to sediment for 5 minutes. During this time interval, blood cells settled towards the bottom of the separation chamber (Fig. 2B). After 5 minutes at room temperature (20-25 C), the tip of a 200-μL Eppendorf pipette (Brinkman Instruments, Inc., Westbury, NY) was inserted into the plasma exit port forming a seal between the pipette tube and the port (Fig. 2C). A negative pressure was then applied with the pipette. The plasma containing virus filtered through the Vivid™ plasma separation membrane while the red blood cells (RBCs) and white blood cells (WBCs) were retained in the chamber since their sizes exceeded the membrane's pore size. Downstream of the plasma separation membrane, the plasma entered the pillar array region, and emptied into the main plasma collection conduit through the plasma collection trenches. The plasma from the main collection conduit was then collected by the pipette (Fig. 2D) and its volume was measured with the pipette.
Fig. 2.

A sequence of images illustrating the plasma separation process. (A) A 1.8 mL blood sample spiked with HIV-1 virus was loaded into the plasma separator with a 1-mL pipette. (B) The blood was allowed to sediment for several minutes (i.e., 5 min). (C) After blood cell sedimentation, a 200-μL pipette was used to collect the plasma through the plasma exit port. (D) The plasma was directly collected through a negative pressure provided by a 200-μL pipette, eliminating the need of any external vacuum pump.
We quantified the concentration of hemoglobin in the extracted plasma with relative units, using a sample of lysed whole blood as a reference. Relative hemoglobin concentrations were evaluated with a ND-1000 spectrophotometer (NanoDrop Technologies, Wilmington, DE) as previously described.21
Our separator's recovery efficiency for HIV virus was evaluated by comparing its performance with that of standard laboratory procedures. To establish a reference, anticoagulated whole blood samples containing intact HIV virus at various concentrations were centrifuged at full speed for 10 minutes with a bench-top centrifuge at room temperature (Labnet International Inc., Woodbridge, NJ). Both HIV-laden plasma extracted with our plasma separator and centrifuged plasma were analyzed by standard quantitative PCR at the Molecular Pathology Laboratory (the Hospital of the University of Pennsylvania) to determine the viral load. The viral loads of the plasma separated with our device and that of the centrifuged plasma were then compared.
Nucleic acid testing
The extracted plasma containing the HIV virus was subsequently amplified in our custom-made microfluidic chip (Fig. 3). The chip and its performance were previously described.36,37 Briefly, the chip contains three independent, multifunctional, 5.0 mm long, 1.0 mm wide, 3.0 mm deep, and ∼15.0 μL in volume amplification reactors. Each of these reactors is equipped with a flow-through Qiagen™ silica membrane (QIAamp Viral RNA Mini Kit) at its entry port. The 140 μL of plasma collected with our plasma separator was mixed with 560 μL of lysis buffer (QIAamp Viral RNA Mini Kit, Qiagen, Valencia, CA) and inserted into one of the amplification reactors. The nucleic acids bound to the Qiagen™ silica membrane in the presence of high chaotrophic salts (such as guanidinium chloride) and low pH.38 Subsequent to the sample introduction, 500 μL of Qiagen wash buffer 1 (AW1), containing chaotropic salt and ethanol, was pipetted into the chip to remove any remaining amplification inhibitors. Then, the silica membrane was washed with 500 μL of wash buffer 2 (AW2) containing 70% ethanol, followed by air-drying for 30 seconds. Next, 22 μL of RT-LAMP master mixture, which contains all the reagents necessary for the RT-LAMP36,39, 0.5 × EvaGreen@ fluorescence dye (Biotium, Hayward, CA), and 8 Units of RNase inhibitor (Life Technologies), was injected into each reaction chamber through the inlet port. Subsequently, the inlet and outlet ports were sealed using transparent tape (Scotch tape, 3 M, St Paul, MN) to minimize evaporation during the amplification process. The nucleic acid chip was placed on a heater and heated to 63 °C for about 60 minutes. The fluorescence excitation and detection were carried out with a minute, portable ESE optical detection system (Qiagen ESE GmbH, Stockach, Germany). 36
Fig. 3.

A photograph of our custom-made microfluidic chip for nucleic acid testing. Inset: a schematic illustration of the flow-through operation for nucleic acid extraction.
Results and Discussions
Plasma Separation
Membranes provide a convenient and effective means to separate plasma from whole blood without a need for centrifugation. The 330 μm thick Pall Vivid™ asymmetric polysulfone membrane has a mean pore size of about 100 μm on its upstream surface and about 2 μm on its downstream surface.40 The asymmetric structure of the membrane allows for a gentle capture of the cellular components without lysing them while providing sufficiently fine pores to prevent any passage of intact cells. We selected the Pall GR Vivid™ plasma separation membrane grade since, in contrast to glass fiber media, the Vivid™ membrane does not shear and lyse cells (which may lead to the contamination of the plasma) and it can handle higher whole blood volume per surface area (40-50 μL/cm2) than other commercially available membranes.29 Minimizing cell lysis is particularly important for the HIV viral load testing since clinical standards are based on viral load in plasma and exclude HIV cDNA that might be present in cells. The total working area of the membrane in our plasma separator is ∼4.0 cm2.
Typically, in membrane-based plasma separators, the membrane is placed horizontally at the bottom of the sample introduction chamber, allowing for blood cells to sediment directly onto the membrane.29,30 Although this arrangement exposes the membrane to spatially uniform cell concentration, the membrane eventually clogs. For example, Homsy et al.29 reported a device, equipped with a horizontally-placed Vivid™ GR separation membrane with an area of 3.14 cm2, capable of extracting 12 μL of plasma from 100 μL of whole blood within about 10 min, when subjected to a relatively strong negative pressure provided by a pressure pump. However, this plasma volume is insufficient for applications involving low abundance analytes. Under such operating conditions, to extract 275 μL of plasma, a membrane with an area of 72 cm2 and a whole blood volume of 2.3 mL would be needed. Such a large membrane would present a challenge for point of on-site devices. The smaller area of our membrane also is likely to reduce nonspecific binding of target analytes. In addition, a relatively strong negative pressure operation is likely to result in substantial hemolysis,29 and also incompatible with plasma separators that are intended to be an integral part of a point of care device.
In contrast, in our plasma separator, the membrane is positioned vertically. The vertical configuration allows for gravitational sedimentation of blood cells in a direction that is parallel to the membrane surface rather than directly onto the membrane, as in existing designs.29,30 This arrangement reduces membrane blockage by blood cells and increases the membrane's ability to handle larger volumes of blood without excessive hemolysis.
Fig. 2 and video-S1 in Supporting Information illustrate the operation of the plasma separator. First, undiluted, fresh or anticoagulated whole blood was introduced into the plasma separator's chamber (Fig. 2A). The blood was left to sediment gravitationally for about five minutes (Fig. 2B). Since the blood cells are approximately 10% denser than the plasma in which they are suspended,41 the blood cells sink to the bottom of the chamber. At the conclusion of the five minute sedimentation period, the fluid at the top of the chamber is much clearer than the fluid next to the bottom. After five minutes, a pipette was inserted into the plasma exit port (Fig. 2C). The good fit between the pipette tube and the collection conduit provides a hermetic seal. When a gentle negative pressure was applied to the pipette (Fig. 2D), the resulting pressure difference across the membrane induced plasma flow through the membrane while the blood cells were left behind. The micropillar array provided a substantial mechanical support for the separation membrane, preventing the membrane from deforming and compromising the separation between the blood and plasma sides of the membrane.
It is likely that most of the plasma that transfused through the membrane came from the upper layer of the separator's chamber, where the blood cells were most diluted, allowing the membrane to purify a much greater volume of plasma than it would have if it were horizontally positioned. The plasma collection self-terminates once the blood level drops beneath the level of the pillar array exposing the upstream side of the membrane to air. With appropriate design, this self-termination is achieved before the Vivid™ membrane clogs with cells, minimizing the risk of hemolysis. We designed our device to separate up to 300 μL of plasma.
The optimal sedimentation time (Ts) for efficient plasma recovery was five minutes. Fig. 4 depicts the volume of the extracted plasma (μL) as a function of the sedimentation time (Ts, min). The error bars correspond to the scatter of the extracted plasma volume obtained in three different experiments. In the range of sedimentation intervals 0<Ts<5 min, as the sedimentation time increased so did the extracted plasma volume. When the sedimentation time was 5 minutes, the volume of the extracted plasma was 275 ±33.5 μL, which is more than twice the volume (130 ± 23.1 μL) extracted without any waiting period after the filling of the separator's chamber with whole blood. In the latter case, some sedimentation had still occurred during the filling of the chamber with whole blood. Increasing Ts beyond 5 minutes led to diminishing returns as 275 μL was quite close to our separator's maximum capacity of 300 μL, which is achieved at 5 min<Ts<10 min.
Fig. 4.
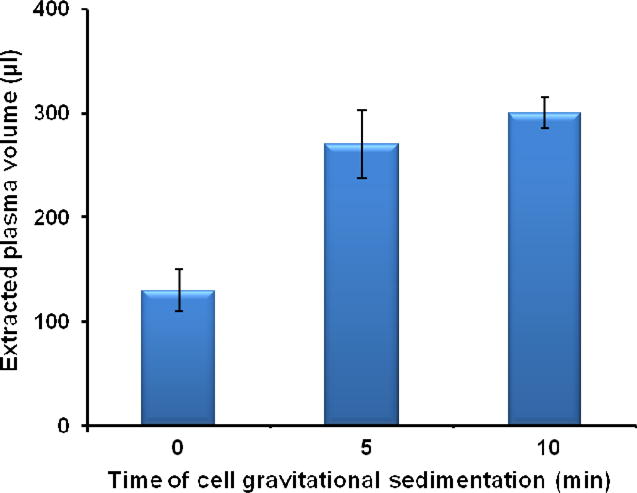
The volume of the extracted plasma by our membrane-based, sedimentation-assisted, plasma separator from undiluted whole blood as a function of the gravitational sedimentation time (Ts, min) (n=3). The total volume of whole blood is 1.8 mL.
Our plasma separator has several advantages over previously reported membrane-based plasma separation devices29,30. First, our separator is capable of extracting a relatively large volume of plasma from whole-blood without a need to dilute or wash the blood, which could be detrimental to limits-of-detection when the target is present in low abundance as typically is the case with HIV viral load in patients on antiretroviral therapy. Second, the plasma can be collected with a conventional 200-μL pipette without a need for an external vacuum pump. Third, by taking advantage of gravitational sedimentation, we are able to increase membrane capacity and reduce membrane pressure drop. As a result, the separation process can be driven by a relatively low (negative) pressure. Perhaps more significantly, the separation is carried out with a relatively modest size membrane, which reduces nonspecific binding of target analytes. Fourth, the separation process is self-terminating, preventing exertion of excessive forces on the cells and avoiding undesired cell breakage. Fifth, our plasma separator can operate without any specialized instrumentation and without electrical power.
Since high shear stresses can damage blood cells and lead to contamination of the plasma,21 we determined the extent of hemolysis in our membrane-based, sedimentation-assisted, plasma separator. Plasma was obtained using both our separator and bench-top centrifugation. The hemoglobin concentration in the plasma extracted with our device was 3.5 ± 1.2 mg/dL (n=3). The hemoglobin concentration in the plasma obtained by centrifugation of the same blood samples was 2.6 ± 0.9 mg/dL (n=3). These concentrations are very close to the reported hemoglobin concentration of ∼2.4 mg/dL naturally present in human plasma.42 Furthermore, the hemoglobin concentration of 3.5 mg/dL in extracted plasma was far below the level that causes interference in most assays (500 mg/dL).43 Since hemolysis is a general measure of the damage to blood cells, the low levels of hemolysis in the plasma extracted with our device indicated that the device produced good quality plasma.
Virus recovery
Since our main objective in separating the plasma from the whole blood is to enable quantification of plasma viral load, we examined whether our separation process adversely affected the measured HIV-1 concentration in plasma. Loss of target can occur, for example, due to non-specific binding to the separation membrane and the structural members of the separator such as the relatively high surface area pillar array. Fig. 5B depicts the recovery efficiency (RR) of HIV virus of our plasma separator as a function of the whole blood viral load (viral RNA copies / mL). We define the recovery efficiency (RR) as the ratio of the number of virus copies (Cdevice) in the plasma separated with our custom made plasma separator and the number of virus copies (Ccentrifuge) in plasma obtained by centrifugation from the same blood sample.
Fig. 5. Recovery efficiency of HIV virus of our plasma separator as a function of the whole blood viral load.

| (1) |
The error bars correspond to the scatter of three independent experiments. In all cases, the recovery rate was above 80%. As the HIV viral load in the whole blood increased, so did the recovery efficiency. At low viral load (3.5 × 10² copies/mL), the recovery efficiency was 81.5 ± 12.1 %. At high viral load (3.5 × 10⁴ copies/mL), the recovery efficiency reached 95.5 ± 3.5%. The reason for the increase in the recovery efficiency with higher viral loads is not known. Recovery efficiency smaller than 100% may, perhaps, resulted from non-specific binding of viruses to the membrane and the plasma separator's structure. As the number of virus particles increases, the non specific binding sites may saturate diminishing the fraction of viruses lost. Conceivably, the recovery rate can be even further increased by appropriate surface treatments29 and the use of sacrificial additives to saturate potential binding sites.
HIV viral load test with a custom-made nucleic acid chip
To test the suitability of the plasma extracted with our separator for point-of-care, nucleic acid-based detection, we spiked plasma separated with our device with HIV virus, and carried out the amplification process in our custom-made, microfluidic chip (Fig. 3). Our chip is unique in integrating the nucleic acid separation membrane within the amplification reactor and using the bound nucleic acids as templates in the amplification process.36 As a result, the nucleic acid purification process in our chip is less stringent than in a traditional PCR process, where the separation and purification processes take place outside the reaction chamber. Thus, our chip provides a demanding test ground for the evaluation of the “quality” of the separated plasma. For amplification, we use the RT-LAMP process as it is efficient, robust, and can be carried out at a constant temperature (60-65 °C).36,37, 44-46 In our prior work, we have successfully used our chip for mosquito genotyping37 and to detect HIV virus in raw (unprocessed) saliva with a limit of detection of less than 10 viral copies in a sample.36 The plasma separator described herein extends the use of the chip to detecting and quantifying HIV in blood samples.
The amplification process was monitored, in real time, by tracking the fluorescence emission intensity of intercalating dye. Fig. 6 depicts the real-time fluorescence intensity as a function of time when the extracted plasma sample contained 3.5×10⁴, 3.5×10³, 3.5×10², and 0 (negative control) HIV viral RNA copies per mL. The fluorescence intensity of the negative control (no target) remained nearly constant throughout the entire detection period (60 minutes), indicating negligible amplicon production. The threshold time (Tt) is defined as the reaction time that elapses until the fluorescent signal increases above a predetermined baseline level. Fig. 6 (inset) depicts the threshold time Tt (min) as a function of the RNA concentration (C) on a semi-log plot. In the range 350 < C < 35,000 viral RNA copies per mL, the threshold time Tt decreases nearly linearly as a function of log (C). The data correlates well with the formula Tt =45.1- 5.1 log (C), where Tt is expressed in minutes. R2=0.98. The experiment indicates that the plasma separated with our plasma separator is suitable for nucleic acid amplification, and that a simple threshold time measurement could be used for target quantification. Since the optical detector used in this work can monitor only one reactor at a time, the reactors were operated sequentially. In the future, we will use a CCD camera-based detector to facilitate concurrent imaging of an array of reactors and parallel detection of targets at various dilutions and/or multiple targets.
Fig. 6.

Real-time monitoring of RT-LAMP amplification of plasma samples extracted with our plasma separator and spiked with (1) 3.5× 10⁴, (2) 3.5× 10³, (3) 3.5× 10², and (4) 0 (negative control) viral RNA copies per mL. Inset: the threshold time Tt (min) as a function of the HIV concentration (viral RNA copies per mL) (n=3).
Conclusions and Outlook
We describe a low-cost, disposable, easy-to-use, pump-free, large-volume, stand alone, sedimentation-assisted, plasma separator for rapid extraction of plasma from undiluted, whole blood. The separator does not require any electrical power. Unique to our device is the combined use of two separation principles: cell sedimentation and size-based filtration. The plasma can be directly separated and collected using a simple pipette, which eliminates the need for an external pump and does not require any electrical power. Some of the advantages of our plasma separator include higher capacity per unit area of the membrane than that afforded by other membrane-based devices29,30, enabling a relatively large sample volume, which is important for greater downstream detection sensitivity, and self-terminating operation that protects against excessive hemolysis.
We have demonstrated that plasma extracted with our plasma separator is appropriate for the molecular detection of target analytes contained in whole blood by spiking the blood with intact HIV virus and using the plasma in microfluidic-based nucleic acid amplification. We demonstrated high efficiency recovery and limit of detection of at least 350 viral copies per 1 mL of plasma. The current standard of care requires ability to detect over 1000 viral copies per mL of plasma.47
The novel, easy-to-use, plasma separator described herein can be used as a stand-alone separation device (as we described in this paper) in resource-constrained settings, where laboratory facilities and trained personnel are in short supply. In the future, we will combine the plasma separator with our nucleic acid amplification chip. Although such integration is not trivial, this study provides an important first step in this direction by demonstrating the utility of the separator as an independent device.
Supplementary Material
Acknowledgments
The work was supported by NIH/NIAID Grant K25AI099160 and Penn CFAR Pilot Grant (AI045008). Samples of Vivid™ plasma separation membrane were gifted by Pall Life Sciences. Mr. Wenbin Zhao machined the plasma separator.
References
- 1.http://www.who.int/features/qa/71/en/
- 2.http://m.cdc.gov/en/MobileCampaigns/worldAIDS
- 3.Granich RM, Gilks CF, Dye C, De Cock KM, Williams BG. Lancet. 2009;373:48–57. doi: 10.1016/S0140-6736(08)61697-9. [DOI] [PubMed] [Google Scholar]
- 4.Malnati MS, Scarlatti G, Gatto F, Salvatori F, Cassina G, Rutigliano T, Volpi R, Lusso P. Nat Protoc. 2008;3:1240–1248. doi: 10.1038/nprot.2008.108. [DOI] [PubMed] [Google Scholar]
- 5.Gibellini D, Vitone F, Gori E, Placa ML, Re MC. J Virol Methods. 2004;115:183–189. doi: 10.1016/j.jviromet.2003.09.030. [DOI] [PubMed] [Google Scholar]
- 6.Drosten C, Panning M, Drexler JF, Hänsel F, Pedroso C, Yeats J, de Souza Luna LK, Samuel M, Liedigk B, Lippert U, Stürmer M, Doerr HW, Brites C, Preiser W. Clin Chem. 2006;52:1258–1266. doi: 10.1373/clinchem.2006.066498. [DOI] [PMC free article] [PubMed] [Google Scholar]
- 7.Gross R, Bilker WB, Friedman HM, Strom BL. AIDS. 2001;15:2109–2117. doi: 10.1097/00002030-200111090-00006. [DOI] [PubMed] [Google Scholar]
- 8.Lee WG, Kim YG, Chung BG, Demirci U, Khademhosseini A. Adv Drug Deliv Rev. 2010;62:449–457. doi: 10.1016/j.addr.2009.11.016. [DOI] [PMC free article] [PubMed] [Google Scholar]
- 9.Niemz A, Ferguson TM, Boyle DS. Trends Biotechnol. 2011;29:240–250. doi: 10.1016/j.tibtech.2011.01.007. [DOI] [PMC free article] [PubMed] [Google Scholar]
- 10.Calmy A, Ford N, Hirschel B, Reynolds SJ, Lynen L, Goemaere E, Garcia de la Vega F, Perrin L, Rodriguez W. Clin Infect Dis. 2007;44:128–134. doi: 10.1086/510073. [DOI] [PubMed] [Google Scholar]
- 11.Arnedo M, Alonso E, Eisenberg N, Ibáñez L, Ferreyra C, Jaén A, Flevaud L, Khamadi S, Roddy P, Gatell JM, Dalmau D, Busia OR Study Group. PLoS One. 2012;7:e47391. doi: 10.1371/journal.pone.0047391. [DOI] [PMC free article] [PubMed] [Google Scholar]
- 12.Al-Soud WA, Radstrom P. J Clin Microbiol. 2001;39:485–493. doi: 10.1128/JCM.39.2.485-493.2001. [DOI] [PMC free article] [PubMed] [Google Scholar]
- 13.Chen X, Cui D, Liu C, Li H, Chen J. Anal Chim Acta. 2007;584:237–243. doi: 10.1016/j.aca.2006.11.057. [DOI] [PubMed] [Google Scholar]
- 14.Lee WG, Kim YG, Chung BG, Demirci U, Khademhosseini A. Adv Drug Deliv Rev. 2010;62:449–457. doi: 10.1016/j.addr.2009.11.016. [DOI] [PMC free article] [PubMed] [Google Scholar]
- 15.Wang S, Xu F, Demirci U. Biotechnol Adv. 2010;28:770–781. doi: 10.1016/j.biotechadv.2010.06.004. [DOI] [PMC free article] [PubMed] [Google Scholar]
- 16.Shim JS, Ahn CH. Lab Chip. 2012;12:863–866. doi: 10.1039/c2lc21009f. [DOI] [PubMed] [Google Scholar]
- 17.Lee KK, Ahn CH. Lab Chip. 2013 doi: 10.1039/c3lc50370d. [DOI] [PubMed] [Google Scholar]
- 18.Zhang XB, Wu ZQ, Wang K, Zhu J, Xu JJ, Xia XH, Chen HY. Anal Chem. 2012;84:3780–3786. doi: 10.1021/ac3003616. [DOI] [PubMed] [Google Scholar]
- 19.Dimov IK, Basabe-Desmonts L, Garcia-Cordero JL, Ross BM, Park Y, Ricco AJ, Lee LP. Lab Chip. 2011;11:845–850. doi: 10.1039/c0lc00403k. [DOI] [PubMed] [Google Scholar]
- 20.Chen X, Cui DF, Liu CC, Li H. Sensors and Actuators B: Chemical. 2008;130:216–221. [Google Scholar]
- 21.VanDelinder V, Groisman A. Anal Chem. 2006;78:3765–3771. doi: 10.1021/ac060042r. [DOI] [PubMed] [Google Scholar]
- 22.Tachi T, Kaji N, Tokeshi M, Baba Y. Anal Chem. 2009;81:3194–3198. doi: 10.1021/ac802434z. [DOI] [PubMed] [Google Scholar]
- 23.Amasia M, Madou M. Bioanalysis. 2010;2:1701–1710. doi: 10.4155/bio.10.140. [DOI] [PubMed] [Google Scholar]
- 24.Gorkin R, Park J, Siegrist J, Amasia M, Lee BS, Park JM, Kim J, Kim H, Madou M, Cho YK. Lab Chip. 2010;10:1758–1773. doi: 10.1039/b924109d. [DOI] [PubMed] [Google Scholar]
- 25.Zhao C, Cheng X. Biomicrofluidics. 2011;5:032004–10. doi: 10.1063/1.3609262. [DOI] [PMC free article] [PubMed] [Google Scholar]
- 26.Sun M, Khan ZS, Vanapalli SA. Lab Chip. 2012;12:5225–5230. doi: 10.1039/c2lc40544j. [DOI] [PubMed] [Google Scholar]
- 27.Panaro NJ, Lou XJ, Fortina P, Kricka LJ, Wilding P. Biomol Eng. 2005;21:157–162. doi: 10.1016/j.bioeng.2004.11.001. [DOI] [PubMed] [Google Scholar]
- 28.Nabatiyan A, Parpia ZA, Elghanian R, Kelso DM. J Virol Methods. 2011;173:37–42. doi: 10.1016/j.jviromet.2011.01.003. [DOI] [PubMed] [Google Scholar]
- 29.Homsy A, van der Wal PD, Doll W, Schaller R, Korsatko S, Ratzer M, Ellmerer M, Pieber TR, Nicol A, de Rooij NF. Biomicrofluidics. 2012;6:12804–128049. doi: 10.1063/1.3672188. [DOI] [PMC free article] [PubMed] [Google Scholar]
- 30.Wang S, Sarenac D, Chen MH, Huang SH, Giguel FF, Kuritzkes DR, Demirci U. Int J Nanomedicine. 2012;7:5019–5028. doi: 10.2147/IJN.S32579. [DOI] [PMC free article] [PubMed] [Google Scholar]
- 31.Yang X, Forouzan O, Brown TP, Shevkoplyas SS. Lab Chip. 2012;12:274–280. doi: 10.1039/c1lc20803a. [DOI] [PubMed] [Google Scholar]
- 32.Songjaroen T, Dungchai W, Chailapakul O, Henry CS, Laiwattanapaisal W. Lab Chip. 2012;12:3392–3398. doi: 10.1039/c2lc21299d. [DOI] [PubMed] [Google Scholar]
- 33.Thorslund S, Klett O, Nikolajeff F, Markides K, Bergquist J. Biomed Microdevices. 2006;8:73–79. doi: 10.1007/s10544-006-6385-7. [DOI] [PubMed] [Google Scholar]
- 34.Liu C, Thompson JA, Bau HH. Lab Chip. 2011;11:1688–1693. doi: 10.1039/c1lc20089e. [DOI] [PMC free article] [PubMed] [Google Scholar]
- 35.Thompson JA, Du X, Grogan JM, Schrlau MG, Bau HH. Journal of Micromechanics and Microengineering. 2010;20:115017. [Google Scholar]
- 36.Liu C, Geva E, Mauk M, Qiu X, Abrams WR, Malamud D, Curtis K, Owen M, Bau HH. Analyst. 2011;136:2069–2076. doi: 10.1039/c1an00007a. [DOI] [PMC free article] [PubMed] [Google Scholar]
- 37.Liu C, Mauk MG, Hart R, Bonizzoni M, Yan G, Bau HH. PloS one. 2012;7:e42222. doi: 10.1371/journal.pone.0042222. [DOI] [PMC free article] [PubMed] [Google Scholar]
- 38.Boom R, Sol CJ, Salimans MM, Jansen CL, Wertheim-van Dillen PM, van der Noordaa J. Journal of Clinical Microbiology. 1990;28:495–503. doi: 10.1128/jcm.28.3.495-503.1990. [DOI] [PMC free article] [PubMed] [Google Scholar]
- 39.Curtis KA, Rudolph DL, Owen SM. J Virol Meth. 2008;151:264–270. doi: 10.1016/j.jviromet.2008.04.011. [DOI] [PubMed] [Google Scholar]
- 40.Fomovsky M, Bormann TJ, Fomovska G. European Patent Application number: EP20120169242. 2012 Dec 12;
- 41.Ponder E. J Biol Chem. 1942;144:333–338. [Google Scholar]
- 42.Spiegel HE, Tonchen AE. Clin Chem. 1969;15:864–869. [PubMed] [Google Scholar]
- 43.Vermeer HJ, Thomassen E, de Jonge N. Clin Chem. 2005:51, 244–247. doi: 10.1373/clinchem.2004.036301. [DOI] [PubMed] [Google Scholar]
- 44.Notomi T, Okayama H, Masubuchi H, Yonekawa T, Watanabe K, Amino N, Hase T. Nucleic Acids Res. 2000;28:E63. doi: 10.1093/nar/28.12.e63. [DOI] [PMC free article] [PubMed] [Google Scholar]
- 45.Liu C, Mauk MG, Hart R, Qiu X, Bau HH. Lab Chip. 2011;11:2686–2692. doi: 10.1039/c1lc20345b. [DOI] [PMC free article] [PubMed] [Google Scholar]
- 46.Liu C, Mauk MG, Bau HH. Microfluidics and nanofluidics. 2011;11:209–220. doi: 10.1007/s10404-011-0788-3. [DOI] [PMC free article] [PubMed] [Google Scholar]
- 47.http://www.who.int/hiv/pub/guidelines/arv2013/art/artmonitoring/en/index4.html
Associated Data
This section collects any data citations, data availability statements, or supplementary materials included in this article.