Abstract
Purpose
Some reported studies have evaluated the dural sac in patients with lumbar spinal stenosis (LSS) by computed tomography (CT) after conventional myelography or magnetic resonance imaging (MRI). But they have been only able to evaluate static factors. No reports have described detailed dynamic changes in the dural sac during flexion and extension observed by multidetector-row computed tomography (MDCT). The aim of this study was to elucidate or demonstrate, in detail, the influence of dynamic factors on the severity of stenosis.
Methods
One hundred patients with LSS were enrolled in this study. All underwent MDCT in both flexion and extension positions after myelography, in addition to undergoing MRI. The anteroposterior diameter (AP-distance) and cross-sectional area of the dural sac (D-area) were measured at each disc level between L1–2 and L5–S1. The dynamic change in the D-area was defined as the absolute value of the difference between flexion and extension. The rate of dynamic change (dynamic change in D-area/D-area at flexion) in the dural sac at each disc level was also calculated.
Results
The average AP-distance in flexion/extension (mm) was 9.2/7.4 at L3–4 and 8.3/7.4 at L4–5. The average D-area in flexion/extension (mm2) was 96.3/73.6 at L3–4 and 72.3/61.0 at L4–5. The values were significantly lower in extension than in flexion at all disc levels from L1–2 to L5–S1. AP-distance was narrowest and D-area smallest at L4–5 during extension. The rates of dynamic changes at L2–3 and L3–4 were higher than those at L4–5.
Conclusions
MDCT clearly elucidated the dynamic changes in the lumbar dural sac. Before surgery, MDCT after myelography should be used to evaluate the dynamic change during flexion and extension, especially at L2–3, L3–4, and L4–5.
Keywords: Lumbar spinal stenosis (LSS), Dynamic factor, Multidetector-row computed tomography (MDCT), Dural sac
Introduction
The number of patients with lumbar spinal stenosis (LSS) is increasing in the geriatric population. LSS is characterised by the narrowing of the central portion of the spinal canal, the lateral recesses, and/or the intervertebral foramina. The lumbar spinal canal is rounded and occupied by the thecal sac. Stenosis of this portion is sometimes called central spinal stenosis to distinguish it from lateral spinal stenosis (nerve-root canal stenosis). This terminology implies that in central spinal stenosis the nerve-root canals may not be stenotic [1]. Symptoms of spinal canal stenosis include lower back pain and unilateral or bilateral lower extremity pain, numbness, or weakness [2]. Neurogenic claudication, defined as pain, paresthesia, and cramping of one or both lower extremities because of neurological compromise brought on by standing or walking and relieved by sitting, is the most typical symptom of spinal stenosis [2–4]. Patients with LSS are more likely to tolerate bicycling (during which the lumbar spine is flexed) better than walking (during which the lumbar spine is extended) [5]. Dynamic factors in the lumbar spine have important roles in determining the severity of stenosis. The available space within the lumbar spinal canal decreases in extension and increases in forward flexion [6]. Therefore, the dural sac is more likely to be compressed in lumbar extension because the ligamentum flavum (LF) and the intervertebral discs protrude into the spinal canal in this position. Although myelography is a simple and easy technique, it provides little information about the dural sac. Although there are some reports of CT after conventional myelography or MRI, they have been only able to evaluate static factors. Functional multidetector-row CT (MDCT) can be superior for obtaining dynamic factors after myelography, and there is little possibility for symptom aggravation because exposure time is very short. However, there are no reports of the use of MDCT after myelography to definitively investigate the dural sac during flexion and extension in patients with LSS.
The aim of this study was to use MDCT after myelography to measure the dimensions of the dural sac during flexion and extension in patients with LSS and elucidate or demonstrate, in detail, the influence of dynamic factors on the severity of stenosis.
Materials and methods
A total of 100 patients (62 males, 38 females; mean age, 69.1 ± 8.6 years) with LSS were enrolled in this study. Patients with the central spinal stenosis or combined stenosis (central stenosis and lateral recess stenosis) were enrolled and with lateral recess stenosis alone were excluded in this study. Patients with rheumatoid arthritis, cerebral palsy, thoracic spondylotic myelopathy, or degenerative lumbar scoliosis were excluded.
All patients provided informed consent to participate in this study. All patients were diagnosed by magnetic resonance imaging (MRI) and MDCT after myelography and underwent decompressive surgery. They underwent MRI in a neutral supine position before surgery and classified using qualitative grading of severity of lumbar spinal stenosis based on the morphology of the dural sac [7] (Table 1). The classification defined grade A as no or minor stenosis, B as moderate stenosis, C as severe stenosis, and D as extreme stenosis.
Table 1.
The distribution of narrowest grades on MRI
| L1–2 | L2–3 | L3–4 | L4–5 | L5–S | |
|---|---|---|---|---|---|
| Grade A | 86 | 46 | 18 | 14 | 40 |
| Grade B | 9 | 20 | 18 | 6 | 36 |
| Grade C | 4 | 16 | 17 | 13 | 21 |
| Grade D | 1 | 18 | 47 | 57 | 3 |
Computed tomographic study
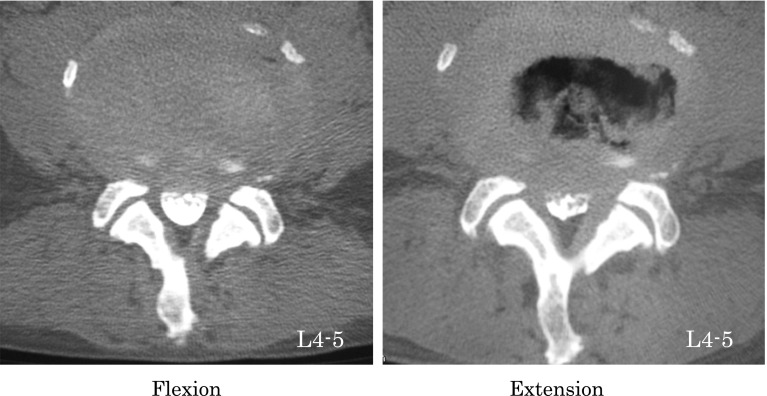
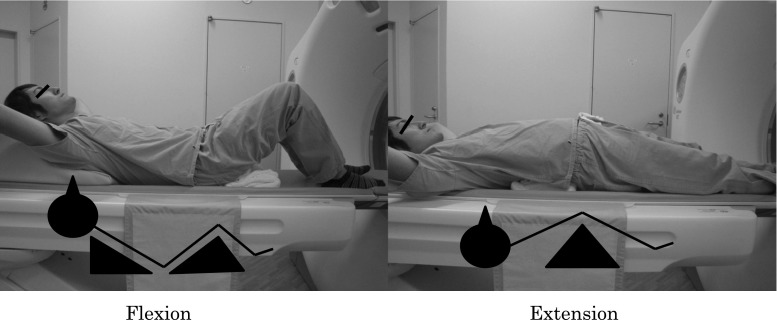
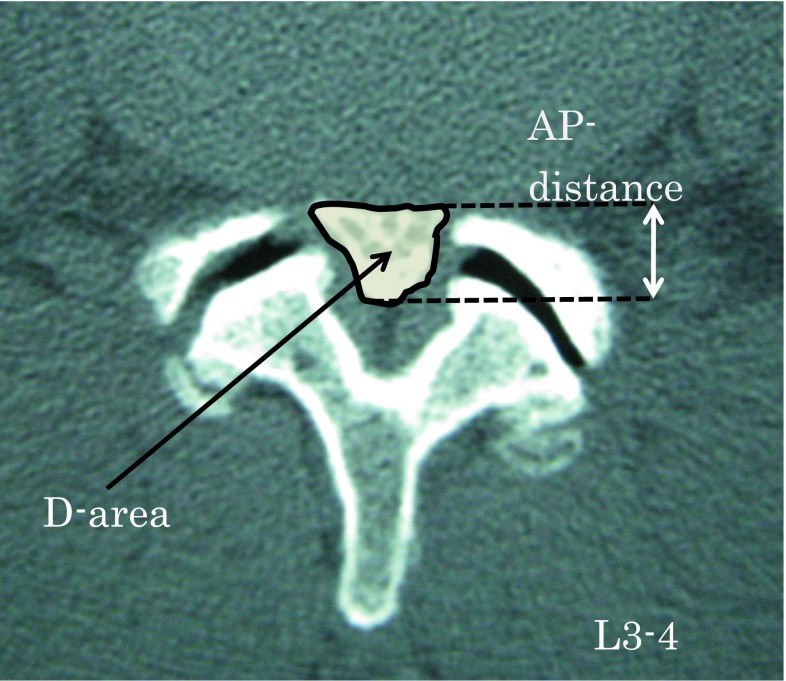
Every subject in this study underwent myelography followed by MDCT. A 64-line multislice CT unit (Light Speed VCT; GE Healthcare Bio-Sciences, Piscataway, NJ, USA) was used. The images were taken at each disc level from L1–2 to L5–S1. MDCT images were taken in both the lumbar flexion and extension positions (Fig. 1). Each scan took about 5 s in each position. Patients were placed in a conventional psoas-relaxed position with a triangular pillow placed on their back in the flexion position and a folded towel placed under the lumbar spine in the extended position (Fig. 2). All image data were downloaded to a computer. The anteroposterior diameter (AP-distance) and the cross-sectional area of the dural sac (D-area) were measured at each disc level from L1–2 to L5–S1 (Fig. 3).
Fig. 1.
Multidetector-row computed tomographic axial images taken at the L4–5 intervertebral disc level during flexion (left) and extension (right)
Fig. 2.
Position of multidetector computed tomographic images during flexion (left) and extension (right)
Fig. 3.
Measurement using Scion imaging software of the anteroposterior diameter of the dural sac (AP-distance) and the cross-sectional area of the dural sac (D-area) at each disc level from L1–2 to L5–S1
Data analysis
Measurement was performed at each disc level in all 100 patients. The mean values of and the change in AP-distance and D-area were calculated twice using Scion imaging (NIH image) software [8], and mean of these data were used for analysis. The following formulae were used to evaluate the rate of dynamic change in D-area during flexion and extension:
 |
1 |
 |
2 |
Statistical analysis
StatMate 3.18 software (ATMS, Tokyo, Japan) on a personal computer was used to perform statistical analysis. All values are expressed as means ± standard deviations. An analysis of variance with t tests was used for comparisons. The level of statistical significance was set to P < 0.05.
Results
AP-distance
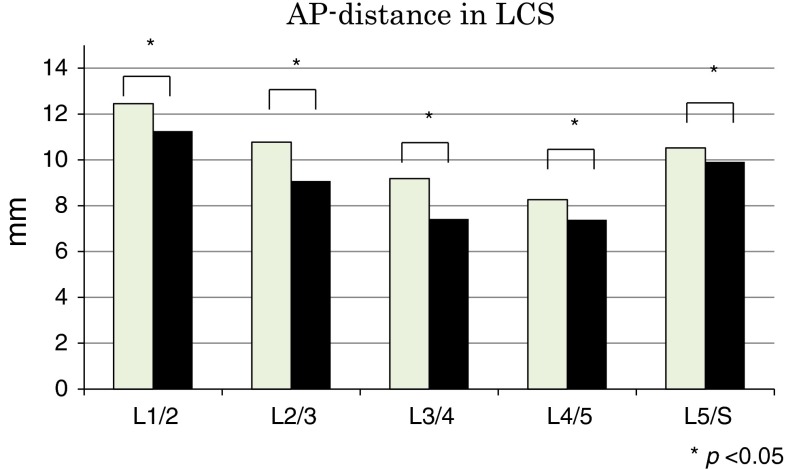
The average AP-distance values are shown in Fig. 4 and Table 2. The average AP-distance was shortest in extension than in flexion at all disc levels from L1–2 to L5–S1 (P < 0.05). The average AP-distance values decreased as the level down from L1–2 to L4–5. At L4–5, the AP-distance was smallest (8.3 mm in flexion, 7.4 mm in extension).
Fig. 4.
Anteroposterior diameter of the dural sac (AP-distance) during flexion and extension. *P < 0.05
Table 2.
The mean AP-distance during flexion and extension
| L1–2 | L2–3 | L3–4 | L4–5 | L5–S | |
|---|---|---|---|---|---|
| Mean AP-distance (mm) ± SD | |||||
| Flexion | 12.4 ± 2.1 | 10.8 ± 2.5 | 9.2 ± 2.3 | 8.3 ± 2.0 | 10.5 ± 2.1 |
| Extension | 11.3 ± 2.2 | 9.1 ± 2.4 | 7.4 ± 2.2 | 7.4 ± 2.1 | 9.9 ± 2.3 |
D-area
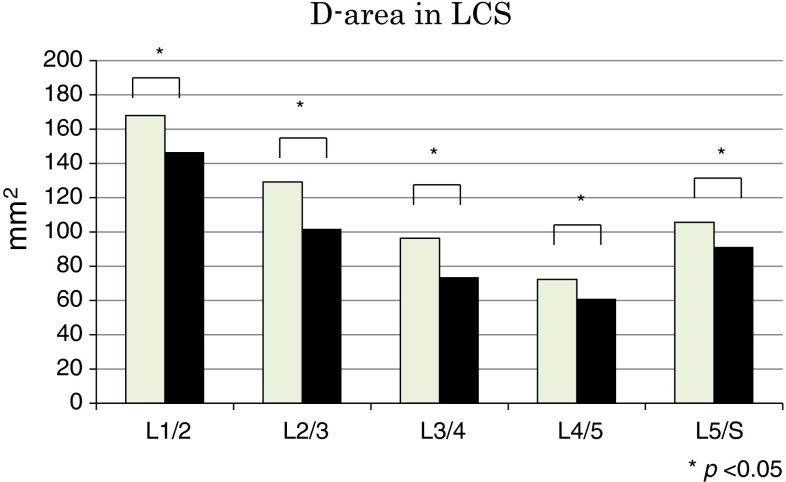
The average D-area values are shown in Fig. 5 and Table 3. The average D-area was lesser in extension than in flexion at all disc levels (P < 0.05). The D-area was less than 100 mm2 during flexion and extension at three levels (L3–4, L4–5, and L5–S1) and narrowest at L4–5 (72.3 mm2 in flexion, 61.0 mm2 in extension).
Fig. 5.
Dural sac cross-sectional area (D-area) during flexion and extension. *P < 0.05
Table 3.
The mean D-area during flexion and extension
| L1–2 | L2–3 | L3–4 | L4–5 | L5–S | |
|---|---|---|---|---|---|
| Mean D-area (mm2) ± SD | |||||
| Flexion | 167.7 ± 38.7 | 130.4 ± 44.9 | 96.3 ± 37.6 | 72.7 ± 37.8 | 105.6 ± 45.8 |
| Extension | 146.5 ± 41.2 | 104.4 ± 40.1 | 73.6 ± 35.2 | 61.4 ± 36.3 | 91.3 ± 44.6 |
The rate of dynamic change
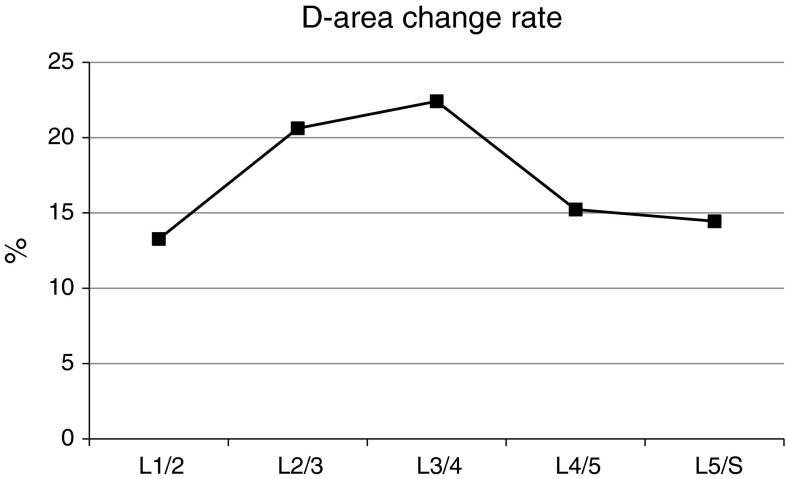
The dynamic changes during flexion and extension are shown in Fig. 6. The values were greatest at L3–4. The rates of dynamic change were lower at L4–5 and L5–S1 than at L2–3 or L3–4. Among the patients whose levels were grade B, 16 of them had been operated. There were six patients at L2–3 and six at L3–4.
Fig. 6.
The rate of dynamic change in D-area at each disc level during flexion and extension
Discussion
The purpose of this study was to investigate the influence of dynamic factors on LSS. MDCT after myelography was used to measure the dimensions of the lumbar dural sac during flexion and extension. The AP-distance and D-area were smaller during extension than during flexion and were lowest at L4–5. The rate of dynamic change in the dural sac covering the lumbar spine was generally the highest at L3–4 in our patients with LSS. Therefore, L3–4 should be given highest priority for evaluation of the dynamic change during flexion and extension before operations.
The spinal canal will probably be compressed in lumbar extension because LF and intervertebral discs protrude into the spinal canal in this position. However, there was no reports of the use of MDCT to elucidate the dynamic chages in the dural sac during flexion and extension. Therefore, we investigated and characterised the dynamic changes in LSS during flexion and extension.
Myelographic examination is useful in the evaluation of encroachments on the spinal canal [9, 10]. In addition, the decision to perform a surgical intervention in patients with LSS depends on marking the correct clinical diagnosis and confirming it by various imaging modalities such as conventional radiography, CT, CT myelography, or MRI. However, whether functional CT or kinematic MRI is the best tool for evaluating dynamic factors affecting LSS is still a matter of debate. There are some reports on functional scanning using MRI that are related to dynamic factors [6, 11, 12]. We know from experimental data that obtaining data using kinematic MRI in the extension position takes longer than other diagnostic imaging techniques, and the symptoms may deteriorate during the resulting delay. Schizas et al. [7] described the classification of lumbar canal stenosis using axial T2 images. In their study, patients with grade C and D stenosis were more likely to fail conservative treatment. In our study, most of the surgical levels were grade C or D. Although the dural sacs were classified grade B in 16 patients, the size of their dural sac were too small during extension on MDCT. Morita et al. [13] reported that CT myelography is more reliable and reproducible than is MRI in patients with LSS. MDCT has high spatial resolution and a short exposure time, which was only 5 s in each position. We used MDCT after myelography in addition to MRI. The combined use of MRI and MDCT can possibly make the diagnosis of LSS even more precise.
Many studies have investigated the dynamics of the lumbar dural sac [6, 12, 14–16]. Analysis of the size of the dural sac is a more reliable procedure for detection of stenosis. There is a significant correlation between D-area and AP-distance of the dural sac [15]. Therefore, the current study examined AP-distance and D-area.
The results of this study indicated that both AP-distance and D-area were lesser during extension than during flexion (P < 0.001) and that D-area was the smallest at L4–5.
Schonstrom et al. [14] reported that a dural sac with an AP-distance of <12 mm was probably indicative of spinal stenosis. In this study, AP-distance during flexion and extension was <11 mm at most disc levels (Table 2).
In a previous human cadaveric CT study, the authors showed that the cross-sectional area of the lumbar spinal canal significantly decreased in extension and increased in flexion [15]. A D-area value of 100 mm2 has been suggested as the cut off value for relative stenosis at and distal to L3–4 in a previous report [6], which also stated that the L4–5 level was most frequently involved in canal stenosis. In the present study, the D-area was less than 100 mm2 during extension at three levels (Table 3). Another report also documented that a decrease in D-area during extension most frequently occurred at L4–5 [11].
Postacchini et al., reported that the preoperative evaluation of severity of central stenosis was based on measurements, on axial scans, of the size of the central spinal canal, compared with that of the first adjacent not stenotic level above or below, rather than on the area of the canal or the thecal sac at the stenotic level. The critical value between moderate and severe stenosis was 40 % constriction of the central or lateral spinal canal or neuroforamen, compared with the adjacent vertebral levels [17]. In our study, it was difficult to evaluate the preoperative severity of central stenosis, compared with that of the first adjacent not stenotic level, because most of patients had multisegmental canal stenosis.
Dynamic changes during flexion and extension were maximal at the L3–4 level in our study. The rate of dynamic change at L2–3 and L3–4 was higher than that at L4–5 and L5–S1. The D-area was smallest at L4–5, indicating that the dynamic change in D-area was the least at this level (Fig. 5). As a result, the rate of dynamic change was lower at L4–5 than at L2–3 and L3–4. At L2–3, the D-area was <100 mm2 during extension in 52 patients and >100 mm2 during flexion in 29 patients (55.8 %) (Table 4). Thus, the dynamic change at L2–3 should be evaluated before surgery in addition to that at L3–4 and L4–5. At L5–S1, motion is stabilised by the iliolumbar ligaments and the large transverse process of the L5 vertebra, which is not the case at L3–4 and L4–5 [18]. Therefore, the rate of dynamic change at L5–S1 may be lower than that at L3–4 and L4–5.
Table 4.
Cases in which the D-area was <100 mm2 during extension and >100 mm2 during flexion
| L1–2 | L2–3 | L3–4 | L4–5 | L5–S | |
|---|---|---|---|---|---|
| Case | 14 (9) | 52 (29) | 82 (29) | 84 (7) | 60 (11) |
In patients with LSS, the dynamic change during flexion and extension at L2–3, L3–4, and L4–5 should be evaluated before surgery.
This study had some limitations. First, to obtain MDCT images, the patients were placed in both flexion and extension positions on a CT table. The data obtained in these positions may, therefore, differ from those obtained in a standing position. Second, because the degree of preoperative lumbar sagittal alignment in flexion and extension on X-ray imaging was not calculated, the correlation between the change of the dural sac and the range of motion during flexion and extension was not evaluated. This correlation should be examined in the future. Third, there are problems about the radiation exposure and potential complications which could be caused by myelography. The radiation exposure with myelography was 3–5 mGy and with CT myelography was 15–25 mGy. The total exposure is considered to be an acceptable dose. Complications such as infection and headache after lumbar puncture could be reduced with careful and clean manipulation, using thinner needles.
Conclusions
The AP-distance and D-area of the dural sac decreased at each disc level during extension at each level. The shortest AP-distance and smallest D-area were observed at L4–5 during extension. Maximal dynamic changes in the dimensions of the dural sac of the lumbar spine were observed at L3–4 in our patients with LSS, and the rate of dynamic change in the dural sac was higher at L2–3 and L3–4 than at L4–5 and L5–S1. Before surgery, MDCT after myelography should be used to evaluate the dynamic change during flexion and extension, especially at L2–3, L3–4, and L4–5.
Conflict of interest
No benefits in any form have been or will be received from a commercial party related directly or indirectly to the subject of this manuscript. This work has been approved by an institutional review board.
References
- 1.Postacchini F. Management of lumbar spinal stenosis. J Bone Joint Surg Br. 1996;78:154–164. [PubMed] [Google Scholar]
- 2.Atlas SJ, Delitto A. Spinal stenosis. Surgical versus nonsurgical treatment. Clin Orthop Relat Res. 2006;443:198–207. doi: 10.1097/01.blo.0000198722.70138.96. [DOI] [PubMed] [Google Scholar]
- 3.Porter RW. Spinal stenosis and neurologenic claudication. Spine. 1996;21:2046–2052. doi: 10.1097/00007632-199609010-00024. [DOI] [PubMed] [Google Scholar]
- 4.Verbiest H. A radicular syndrome from developmental narrowing of the lumbar vertebral canal. J Bone Joint Surg. 1954;36-B:230–237. doi: 10.1302/0301-620X.36B2.230. [DOI] [PubMed] [Google Scholar]
- 5.Yukawa Y, Lenke LG, Tenhula J, et al. A comprehensive study of patients with surgically treated lumbar spinal stenosis with neurogenic claudication. J Bone Joint Surg Am. 2002;84-A(11):1954–1959. doi: 10.2106/00004623-200211000-00008. [DOI] [PubMed] [Google Scholar]
- 6.Willen J, Danielson B, Gaulitz A, Niklason T. Dynamic effects on the lumbar spinal canal: axially loaded CT-myelography and MRI in patients with sciatica and/or neurogenic claudication. Spine. 1997;22:2968–2976. doi: 10.1097/00007632-199712150-00021. [DOI] [PubMed] [Google Scholar]
- 7.Schizas C, Theumann N, Burn A, et al. Qualitative grading of severity of lumbar spinal stenosis based on the morphology of the dural sac on magnetic resonance images. Spine. 2010;35:1919–1924. doi: 10.1097/BRS.0b013e3181d359bd. [DOI] [PubMed] [Google Scholar]
- 8.Machino M, Yukawa Y, Ito K, et al. Dynamic changes in dural sac and spinal cord cross-sectional area in patients with cervical spondylotic myelopathy. Spine. 2010;36:399–403. doi: 10.1097/BRS.0b013e3181d2510b. [DOI] [PubMed] [Google Scholar]
- 9.Knutsson F. Volum und Formvariationen des Wirbelkanals bei Lordosierung bzw. Kyphosierung und ihre Bedeutung fur die myelografische Diagnostik. Acta Radiol. 1942;23:431–443. doi: 10.3109/00016924209135629. [DOI] [Google Scholar]
- 10.Schumacher M. Die Belastungsmyelographie. Fortschr Rontgenstr. 1986;145:642–648. doi: 10.1055/s-2008-1049007. [DOI] [PubMed] [Google Scholar]
- 11.Danielson B, Willen J. Axially loaded magnetic resonance image of the lumbar spine in asymptomatic individuals. Spine. 2001;26:2601–2606. doi: 10.1097/00007632-200112010-00015. [DOI] [PubMed] [Google Scholar]
- 12.Willen J, Danielson B. The diagnostic effect from axial loading of the lumbar spine during computed tomography and magnetic resonance imaging in patients with degenerative disorders. Spine. 2001;26:2607–2614. doi: 10.1097/00007632-200112010-00016. [DOI] [PubMed] [Google Scholar]
- 13.Morita M, MIyauchi A, Okuda S, et al. Comparison between MRI and myelography in lumbar canal stenosis for decision of levels of decompression surgery. J Spinal Disord Tech. 2011;24:31–36. doi: 10.1097/BSD.0b013e3181d4c993. [DOI] [PubMed] [Google Scholar]
- 14.Schonstrom N, Bolender N, Spengler D. The pathomorphology of spinal stenosis as seen on CT scans of the lumbar spine. Spine. 1985;10:806–811. doi: 10.1097/00007632-198511000-00005. [DOI] [PubMed] [Google Scholar]
- 15.Schonstrom N, Lindahl S, Willen J, et al. Dynamic changes in the dimensions of the lumbar spinal canal: an experimental study in vitro. J Orthop Res. 1989;7:115–121. doi: 10.1002/jor.1100070116. [DOI] [PubMed] [Google Scholar]
- 16.Hamanishi C, Matukura N, Fujita M, et al. Cross-sectional area of the stenotic lumbar dural tube measured from the transverse views of magnetic resonance imaging. J Spinal Disord. 1994;7:388–393. doi: 10.1097/00002517-199410000-00004. [DOI] [PubMed] [Google Scholar]
- 17.Postacchini R, Ferrari E, Cinotti G, et al. Aperius interspinous implant versus open surgical decompression in lumbar spinal stenosis. The Spine J. 2011;11:933–939. doi: 10.1016/j.spinee.2011.08.419. [DOI] [PubMed] [Google Scholar]
- 18.Abbas J, Hamoud K, Masharawi YM, et al. Ligamentum flavum thickness in normal and stenotic lumbar spines. Spine. 2010;35:1225–1230. doi: 10.1097/BRS.0b013e3181bfca15. [DOI] [PubMed] [Google Scholar]


