Abstract
Carbon dioxide, latent and sensible energy fluxes were measured by means of the eddy covariance method above a mountain meadow situated on a steep slope in the Stubai Valley/Austria, based on the hypothesis that, due to the low canopy height, measurements can be made in the shallow equilibrium layer where the wind field exhibits characteristics akin to level terrain. In order to test the validity of this hypothesis and to identify effects of complex terrain in the turbulence measurements, data were subjected to a rigorous testing procedure using a series of quality control measures established for surface layer flows. The resulting high-quality data set comprised 36 % of the original observations, the substantial reduction being mainly due to a change in surface roughness and associated fetch limitations in the wind sector dominating during nighttime and transition periods. The validity of the high-quality data set was further assessed by two independent tests: i) a comparison with the net ecosystem carbon dioxide exchange measured by means of ecosystem chambers and ii) the ability of the eddy covariance measurements to close the energy balance. The net ecosystem CO2 exchange measured by the eddy covariance method agreed reasonably with ecosystem chamber measurements. The assessment of the energy balance closure showed that there was no significant difference in the correspondence between the meadow on the slope and another one situated on flat ground at the bottom of the Stubai Valley, available energy being underestimated by 28 and 29 %, respectively. We thus conclude that, appropriate quality control provided, the eddy covariance measurements made above a mountain meadow on a steep slope are of similar quality as compared to flat terrain.
Keywords: CARBOMONT project, Complex terrain, Energy balance closure, Footprint model, Quality control
1. Introduction
Recently, a global network of micrometeorological flux measurement sites, the so-called FLUXNET, has been originated in order to meet the emerging need for long-term studies of the biosphere-atmosphere exchange of CO2, water vapour and energy (Baldocchi et al., 2001). Within FLUXNET, the preferred technique for measuring the fluxes of CO2, latent and sensible heat is the eddy covariance method (Baldocchi et al., 1988; Aubinet et al., 2000), as it is capable of directly quantifying the turbulent exchange at the canopy-atmosphere interface in a quasi-continuous long-term fashion with minimal disturbance of the ecosystem (Baldocchi, 2003). While the pioneering eddy covariance studies were conducted on ideal locations, i.e. extremely level terrain with a spatially homogenous source/sink distribution and windy, sunny climate (e.g. Kaimal and Wyngaard, 1990), it has become common during the past 10 years to conduct eddy covariance studies also in non-ideal (so-called complex) terrain, where natural ecosystems are often situated (e.g. Baldocchi et al., 2000; Geissbühler et al., 2000; Lee and Hu, 2002; Turnipseed et al., 2002, 2003, 2004; Kominami et al., 2003; Froelich et al., 2005). That this is not without problems is demonstrated by the widespread shortfall of the sum of latent and sensible heat fluxes measured by the eddy covariance method as compared to the available energy, i.e. net radiation minus the heat flux into storage (Wilson et al., 2002), the suspected underestimation of nighttime ecosystem respiration during calm and stable conditions (Gu et al., 2005), and the inability of the eddy covariance method to match net ecosystem production estimates derived independently from carbon inventories (Barford et al., 2001; Curtis et al., 2002; Ehman et al., 2002). While these problems are not fundamentally linked to complex terrain, they may be aggravated by it (Finnigan et al., 2003). More recently, a few groups (Aubinet et al., 2003; Feigenwinter et al., 2004; Staebler and Fitzjarrald, 2004; Marcolla et al., 2005; Yi et al., 2005) have attempted to quantify the flux measurement error introduced by neglecting advective fluxes in complex topography. As summarised nicely for six European forest sites by Aubinet et al. (2005), the significance of advection, both vertical and horizontal, for the scalar mass balance depends critically on site topography and the spatial source/sink heterogeneity, steep slopes and heterogeneous vegetation/soil distributions promoting advection, in particular, but not exclusively, during calm and stable nighttime conditions. Considerably less, if any, information exists on the importance of advection under field conditions for sites covered by short vegetation. A reasonably homogenous spatial source/sink distribution provided, eddy covariance measurements in complex terrain might in fact be less problematic over short vegetation as opposed to tall forests, because short canopy heights allow instruments to be located much closer to the surface. In this very shallow surface layer the flow can reach local equilibrium with the continually changing mean velocity field as the flow passes over the slope (Raupach and Finnigan, 1997), avoiding many of the problems resulting from tall canopies (Finnigan, 2004a; Finnigan and Belcher, 2004; Katul et al., 2005), which usually occupy a significant fraction of the inner region (Jackson and Hunt, 1975).
In southern and central European mountain areas, changes in land use (Bätzing, 1996), as opposed to climate change (Theurillat and Guisan, 2001), are currently considered the major driver for changes in ecosystem structure and functioning (Garcia-Ruiz et al., 1996; Cernusca et al., 1999). With changes in European Union (EU) agricultural price support pending, these land-use changes are predicted to become even more prominent in the near future. In many of these mountain regions, current and anticipated land-use changes involve the intensification of easy to access agricultural land close to the settlements at the expense of less accessible areas in remote, high-elevation locations on steeply sloping terrain, which are/will be managed less intensively or even abandoned (Cernusca et al., 1999). Within the frame of the EU FP 5 project CARBOMONT, which aimed at quantifying the effects of land-use changes on the pools and fluxes of European mountain grasslands, it was thus necessary to investigate also sites in complex, sloping terrain.
The aim of the present paper is to assess the validity of eddy covariance measurements made within the CARBOMONT project at the study site Kaserstattalm, a meadow situated on a mountain slope in the Stubai Valley (Austria), in order to, in a future step, derive defensible estimates of the CO2 source/sink strength of this site. In contrast to the above-mentioned studies over tall forest ecosystems, where arrays of towers and turbulence instruments were deployed to estimate advection (Aubinet et al., 2005), the present study was based on the hypothesis that, due to the low canopy height, measurements can be made in the shallow equilibrium layer where the wind field exhibits characteristics akin to level terrain (Raupach and Finnigan, 1997). A homogeneous source/sink distribution provided, this allows to neglect advection in the first place and justifies the application of the familiar one-dimensional (1D) eddy covariance framework (Finnigan et al., 2003). The ability of the eddy covariance measurements to close the energy balance (Wilson et al., 2002) and a comparison with the net ecosystem CO2 exchange (NEE) measured by means of ecosystem chambers (Wohlfahrt et al., 2005a) are used to independently assess the validity of this hypothesis. In order to identify a potential bias in the eddy covariance fluxes measured above the sloping meadow, results of the energy balance closure are compared against corresponding measurements obtained at the study site Neustift, a meadow on the flat bottom of the Stubai Valley (Wohlfahrt, 2004). These independent tests are backed up by rigorous data screening using quality control measures established for surface layer flows (Foken et al., 2004) and an evaluation of the source area using a footprint model (Hsieh et al., 2000).
2. Material and Methods
2.1 Site description
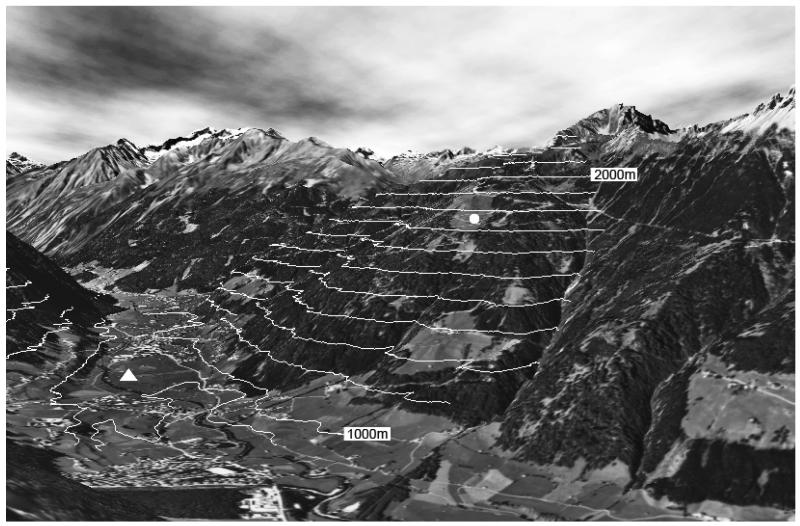
Investigations were carried out in 2003 at two grassland sites in the Stubai Valley (Austria): i) Neustift, a meadow in the valley bottom, and ii) Kaserstattalm, a meadow on a slope approximately 800 m in elevation above Neustift (Figure 1, Table 1):
Figure 1. Three-dimensional view (digital terrain model overlaid with orthophotography) of the Stubai Valley, with the study sites Kaserstattalm and Neustift indicated by a dot and a triangle, respectively.
Contour lines refer to a 100 m difference in elevation.
Table 1. General characterisation of the study sites.
| Neustift | Kaserstattalm | |
|---|---|---|
| Latitude | 47° 07′ 01″ | 47° 07′ 44″ |
| Longitude | 11° 19′ 16″ | 11° 18′ 24″ |
| Elevation (m a.s.l.) | 970 | 1770 |
| Inclination (°) | 0 | 24 |
| Exposition (°) | - | 116 |
| Annual temperature (°C) | 6.5 | 3.0 |
| Annual precipitation (mm) | 852 | 1097 |
| Management (cuts per year) | 3 | 1 |
| Vegetation type | Pastinaco Arrhenatheretum | Trisetetum flavescentis |
| Soil type 1 | Fluvisol | Cambisol |
… FAO classification
The study site Neustift (Wohlfahrt, 2004) is situated at an elevation of 970 m a.s.l. in the middle of the flat bottom of the Stubai Valley, whose down-valley axis is towards north-east (45°) oriented. The fetch is homogenous up to 300 m to the north-east and 900 m to the south-west of the instrument tower, the dominant day and nighttime wind directions, respectively. The average annual temperature is 6.5°C, annual precipitation amounts on average to 852 mm.
The study site Kaserstattalm (Bitterlich and Cernusca, 1999) is situated at an elevation of 1770 m a.s.l. on a east-south-east (116°) exposed slope with an average inclination of 24 ± 5 °. The meadow is almost completely surrounded by sub-alpine forest, providing minimum and maximum fetch lengths of 95 (north-west) and 510 m (east), respectively. The average annual temperature is 3.0°C, average annual precipitation amounts to 1097 mm.
2.2 Eddy covariance
Vertical fluxes of CO2, latent and sensible heat were measured by means of the eddy covariance method (Baldocchi et al., 1988; Aubinet et al., 2000) using identical instrument setups and calculation procedures at both sites: The three wind components and the speed of sound were measured using three-dimensional sonic anemometers (R3IA, Gill, Lymington, UK), CO2 and H2O mole densities using open-path infra-red gas analysers (Li-7500, LI-COR, Lincoln, NE, USA). Fast response sensors were mounted at z = 2.1-3.1 m a.g.l. at Kaserstattalm (sensor height varied between measurement campaigns) and at z = 3.0 m a.g.l. at Neustift. With canopy heights varying from a few centimetres to 0.7 and 1.0 m and assuming the zero-plane displacement height (d) to equal two thirds of the canopy height (Kaimal and Finnigan, 1994), z-d varied between 2.1-3.1 and 2.3-3.0 m at Kaserstattalm and Neustift, respectively. Turbulence measurements are thus likely to have been made above the roughness sublayer, which, as a rule-of-thumb, extends from the ground to three times the canopy height (Kaimal and Finnigan, 1994), most of the time. The open sides of the asymmetric sonic anemometers were exposed to east and north-west at Kaserstattalm and Neustift, respectively. The open-path infra-red gas analysers were mounted 0.2 m below the sonic anemometers and displaced 0.3 m laterally perpendicular to the predominating wind direction in order to minimize flux loss due to vertical (Kristensen et al., 1997) and longitudinal (Massman, 2000) sensor separation, respectively. Raw data were acquired at 20 Hz using personal computers running the Edisol software (University of Edinburgh). Using the post-processing software EdiRe (University of Edinburgh), eddy fluxes were calculated as the covariance between turbulent fluctuations of the vertical wind speed and the scalar mixing ratios calculated by Reynolds averaging of 30 min blocks of data. Following the recommendations by Turnipseed et al. (2003) and Lee et al. (2004), the coordinate system’s vector basis was aligned with the mean wind streamlines using the planar fit rotation after Wilczak et al. (2001). Frequency response corrections were applied to raw eddy fluxes accounting for low-pass (lateral sensor separation, dynamic frequency sensor response, scalar and vector path averaging, frequency response mismatch) and high-pass (block averaging) filtering following Moore (1986) and Aubinet et al. (2000) using site-specific cospectral reference models (Massman and Clement, 2004; Wohlfahrt et al., 2005a). Experimentally derived frequency response correction factors, according to Aubinet et al. (2000, 2001), were used to calibrate and assess the validity of the theoretical low-pass filtering correction method, as exemplified in Wohlfahrt et al. (2005a) for a closed-path system. Finally, CO2 and H2O fluxes were corrected for the effect of air density fluctuations following Webb et al. (1980). Net ecosystem exchanges of CO2, latent and sensible heat were then calculated as the sum of the corrected vertical eddy covariance term and the storage flux, the latter being estimated from the rate of change in scalar concentration and air temperature at the reference height. Negative flux densities represent transport towards the surface, positive values the reverse.
The eddy covariance tower at Neustift has been operational since March 2001 (Wohlfahrt et al., 2005b), within the frame of the present paper we report data from the vegetation period 2003. At Kaserstattalm, eddy covariance measurements were made in three month-long campaigns during the vegetation period 2003, i.e. 20 May – 26 June, 18 July – 16 August, and 22 September – 21 October.
Quality control of the half-hourly flux data was exercised in a two-step procedure: First, periods were identified when the eddy covariance system would not work properly due to adverse environmental conditions (rain, snow), instrument malfunction, etc. These data were excluded from any further analysis. In a second step, data were subject to the integral turbulence and stationarity tests following Foken and Wichura (1996) and a foot-print analysis using the model by Hsieh et al. (2000): The integral turbulence test is based on the Monin-Obukhov (MO) hypothesis according to which various atmospheric parameters and statistics, when normalised by appropriate powers of the scaling velocity, u*, become universal functions of the stability parameter, ζ. Here, we employ the stability function for vertical velocity ( φw) by Kaimal and Finnigan (1994):
| (1) |
where σw is the standard deviation of vertical velocity. The deviation from MO theory is then expressed as the percentage difference between the measured ratio of σw to u* and the theoretical MO value as
| (2) |
Deviation from stationarity was assessed by comparing the 30 min average covariance of the vertical velocity and the scalar mixing ratio () with the average covariance of six consecutive 5 min blocks of data, i.e.
| (3) |
Based on a combination of Lagrangian stochastic dispersion model results and dimensional analysis, Hsieh et al. (2000) proposed an approximate footprint model capable of analytically relating atmospheric stability, measurement height and surface roughness length to flux and footprint. According to Hsieh et al. (2000) the upwind distance for the measured flux to represent 90 % of the surface flux (X90%), and the upwind distance to the peak location of the footprint (Xmax) may be calculated as
| (4) |
and
| (5) |
Here k refers to the von Karman constant (0.4), L to the Obukhov length. Zu is a length scale calculated as
| (6) |
where Zm is the measurement height and u the mean wind speed. D and P are stability-dependent coefficients, i.e.
D = 0.28; P = 0.59 for unstable conditions,
D = 0.97; P = 1.00 for near-neutral (−0.02 < ζ ≤ 0.02) conditions, and
D = 2.44; P = 1.33 for stable conditions.
2.3 Ecosystem chambers
During five campaigns (3 and 5 June, 12 August, 26 September and 17 October) the NEE at Kaserstattalm was measured at hourly intervals under naturally occurring light conditions by means of in-house made, closed-dynamic ecosystem chambers described in Wohlfahrt et al. (2005a). Briefly, the NEE was calculated from the rate of change of the chamber head space CO2 concentration measured with an infra-red gas analyser (LCA-2, ADC, Hoddesdon, UK). Chambers, made out of transparent plexiglass (0.4-0.7 m high, 95 % light transmission), were manually placed onto square PVC collars (three replicates each with 0.6 m2 ground area, put into place in spring 2002) during each measurement cycle, which lasted 3 min. A rubber seal around the ground collar ensured gas tightness to the chamber. Chamber air was stirred by two mini-fans, a vent prevented pressure differences to the atmosphere during enclosure.
2.4 Ancillary data
Supporting meteorological measurements of relevance for the present paper included total and diffuse photosynthetically active radiation (BF3H, Delta-T, Burwell, UK), net radiation (CNR-1, Kipp & Zonen, Delft, The Netherlands), air temperature (RFT-2, UMS, Munich, Germany), soil temperature (in-house made thermistors) and water content (theta-probe ML1, Delta-T, Burwell, UK) at 0.05 m soil depth and soil heat flux (3 replicate heat flux plates at 0.05 m corrected for the change in heat storage above that height, HFP01, Hukseflux, Delft, The Netherlands). These data were recorded by a data logger (DL2e, Delta-T, Burwell, UK) each minute and saved as half-hourly averages. Since radiation sensors were installed horizontally, total photosynthetically active radiation and net radiation received by the slope were corrected for the inclination and aspect of the site following the method outlined by Nie et al. (1992), i.e.
| (7) |
where Rns and Rnh, and Sbs and Sbh refer to the net radiation (Rn) and solar beam (Sb) radiation received by the slope (subscript s) and a horizontal surface (subscript h), respectively. The solar beam radiation incident on a slope is given as
| (8) |
Here β is the solar elevation and θ the angle between the direct solar beam and the normal of the slope calculated as
| (9) |
where α is the angle of the slope to the horizontal, and A and B are the solar and slope azimuth angle, respectively. Horizontally measured direct photosynthetically active radiation (photon units) was converted to beam broadband solar radiation (Sbh, energy units) using a conversion coefficient of 0.44 (Goudriaan and Van Laar, 1994).
3. Results and Discussion
3.1 Wind field
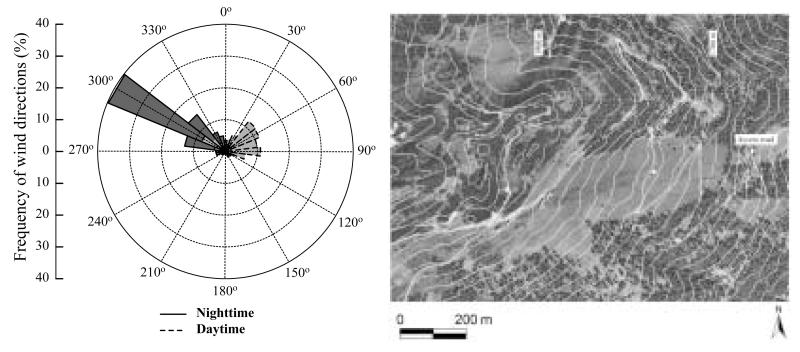
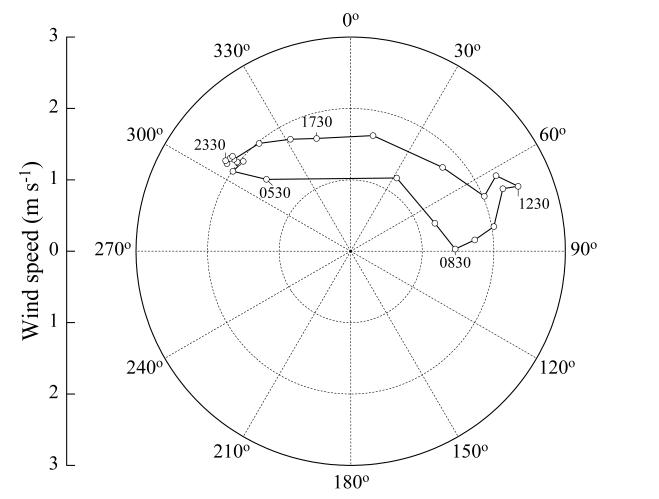
As expected for a typical mountain slope wind system (Whiteman, 1990), the wind direction at Kaserstattalm exhibited a bimodal distribution, upslope (51 % of the data between 45-105°) during daytime and downslope (67 % of the data between 285-315°) during nighttime, as depicted in Figure 2. Mean wind speed and direction as a function of time of day are combined in Figure 3: During nighttime the wind blew steadily with an average speed of 2.1 m s−1 from the sector 310-340° until around sunrise, when wind speed slowed down to a morning minimum of around 1.2 m s−1 and turned over north to east within three hours. At this point wind speed usually picked up, blowing with a maximum average wind speed of 2.5 m s−1 from 70-90° for several hours around noon, in accordance with the up-slope wind velocities observed by Henne et al. (2004) in two Swiss valleys. In the early afternoon, wind speed then slowed down somewhat and reversed (again within three hours) over the northern sector back to nighttime conditions.
Figure 2. Frequency distribution of wind directions (north = 0°, east = 90°) for daytime (dashed line and grey shading) and nighttime (solid line and black shading) conditions at the study site Kaserstattalm on the left, and orthophotography of the area surrounding the eddy covariance tower (indicated by a dot) on the right.
Contour lines refer to a 20 m difference in elevation.
Figure 3. Average diurnal course of wind speed and direction at the study site Kaserstattalm.
3.2 Quality control
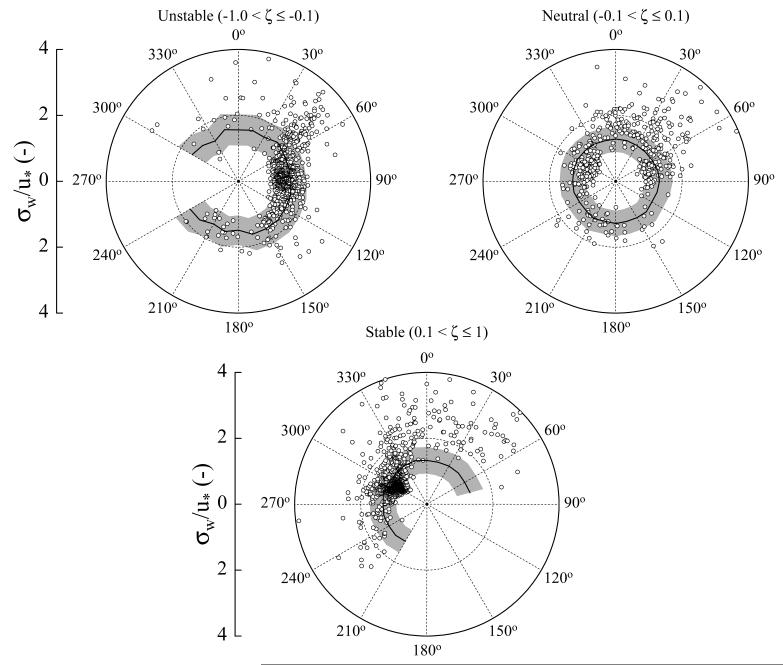
Results of the integral turbulence test, a measure of how well developed turbulence is as compared to what is to be expected from MO theory (Foken and Wichura, 1996), are presented in Figure 4. Overall, 69 % of the half-hourly observations passed the test. Poor correspondence between measured and theoretical σw to u* ratios was observed at all stabilities in the sector 330-60°, which might reflect the close proximity of the forest in this sector (70-100 m, Figure 2). This transition from forest to grassland represents a step change in roughness length (z0) on the order of a factor of 10 (forest z0 ~ 1 m, grassland z0 ~ 0.1 m). Using these figures in equations 4.2 and 4.3 from Kaimal and Finnigan (1994) and assuming that the equilibrium layer occupies the lowermost 10 % of the internal boundary layer, which develops after the change in surface roughness, we estimate that, for neutral conditions, the downwind distance required for our instruments (at ~ 3 m above ground) to be within this equilibrium layer amounts to 160 m. As this is up to twice as much as the available distance to the forest edge, we conclude that for air flows from this sector the equilibrium layer, where a new constant-stress inertial sublayer has been achieved in equilibrium with the new (smoother) surface (Kaimal and Finnigan, 1994), has not sufficiently established. So at least for neutral and stable conditions, our instruments are very much likely to be “seeing” the wind and pressure field perturbed by the change in roughness (Figure 4), which we consider to be a major reason for the deviation from the model values in this wind sector.
Figure 4. Directional distribution of the ratio of the standard deviation of vertical velocity (σw) to friction velocity (u*) at the study site Kaserstattalm for unstable, neutral and stable conditions.
Symbols indicate measurements, lines and grey areas the average and ± 30 % range, respectively, of σw / u* calculated according to Eq. 1 from the average stability parameter in each sector.
Flow distortion by the sonic anemometer itself is another potential cause for deviations of the integral similarity characteristics (Foken and Wichura, 1996). In particular if, as in the present case, the sonic anemometer is mounted vertically and not normal to the surface and the wind streamlines. In this setup the sonic anemometer experiences a greater number of large (i.e. outside the manufacturers specifications) angles of attack (Geissbühler et al. 2000), leading to a reduction of the measured wind components (Gash and Dolman, 2003). For the 330-60° sector, flow distortion is though unlikely to have occurred, as flow from these sectors closely follows the height contour lines (Fig. 2), with angles of attack well within the ± 20° envelope quoted for the sonic anemometer model employed (data not shown). Moreover, as shown by Geissbühler et al. (2000), who compared a surface-normal and a vertical sonic anemometer orientation over an aerodynamically much rougher forested slope, there is little difference in the integral similarity characteristics between these two setups. This may be due to the fact that, as pointed out by Wilczak et al. (2001) and references cited therein, tilting sensors in the streamwise direction alone is not sufficient for avoiding flow distortion.
Stationarity, i.e. that point statistics do not change with time, is another fundamental requirement for the application of the eddy covariance method (Baldocchi, 2003) and most frequently assessed based on the so-called stationarity test (Eq. 3) put forward by Foken and Wichura (1996). Overall, 68 % of the data passed the stationarity tests and there was not a great deal of directional variation, nor were there large differences between the latent and sensible heat and CO2 fluxes (data not shown). Even in the north-east sector, where the air comes from during the morning and afternoon transition periods (Figure 3), when environmental conditions change rapidly and non-stationary fluxes are most likely, more than 65 % of the data complied with the requirements of stationarity.
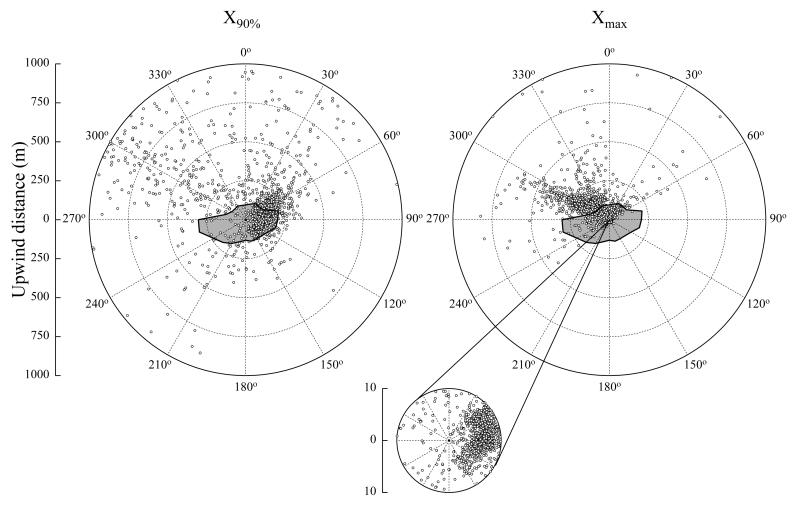
The footprint of a turbulent flux measurement defines the spatial context or “field of view” of the measurement (Schmid, 2002). Given that the meadow at the study site Kaserstattalm is surrounded to a large part by forest (Figure 2), we aimed at using a footprint model to determine to which extent fluxes measured at the tower originated from within the boundaries of the meadow. However, as elaborated by Finnigan (2004b), there are fundamental problems to the flux footprint concept in non-flat terrain due to complex flow patterns associated with topography. In the spirit of the basic premise of the present study, i.e. that, due to the low canopy height, measurements at the Kaserstattalm can be made in the shallow surface layer where the flow exhibits characteristics akin to level terrain (Raupach and Finnigan, 1997), we nevertheless applied the footprint model to provide at least a rough estimate of the spatial context of our flux measurements. To this end two metrics were calculated with the footprint model by Hsieh et al. (2000) - X90%, the upwind distance for the measured flux to represent 90 % of the surface flux (Eq. 4), and Xmax, the upwind distance to the peak location of the footprint (Eq. 5). The results, shown in Figure 5, reflect the directional distribution of wind speed (Figure 3) and atmospheric stability (Figure 4), which determine the extent of the footprint: For more than 75 % of the half-hourly observations in the sector 75-165° the flux originated to at least 90 % from within the meadow. This was due to atmospheric conditions being usually neutral/unstable during the times when the air originated from this sector (Figure 4), which implies a relatively short footprint even at larger wind speeds (Hsieh et al., 2000), as well as a comparatively large distance to the forest edge, in particular between 70-110° (> 200 m, Figure 2). Conversely, very few observations satisfied the condition that at least 90 % of the flux originates from within the meadow between 180-60°. This was first due to the above-mentioned close proximity of the forest edge in the sector 310-60° (Figure 2), and second, due to the predominance of these sectors during times when the atmosphere was stably stratified (Figure 4), when the footprint expands considerably (Hsieh et al., 2000). The peak of the footprint lay largely within the boundaries of the meadow, except for the sector 270-15°, where the combination of stable atmospheric conditions and a short distance to the forest edge resulted in still more than 46 % of the half-hourly observations having their peak footprint in the forest and beyond (Figure 5).
Figure 5. Upwind distance for the measured flux to represent 90 % of the surface flux (X90%, left) and the upwind distance to the peak location of the footprint (Xmax, right) at the study site Kaserstattalm calculated with the footprint model by Hsieh et al. (2000).
The inset on the right shows Xmax in a 10 m radius around the flux tower, the grey areas indicate the boundaries of the meadow.
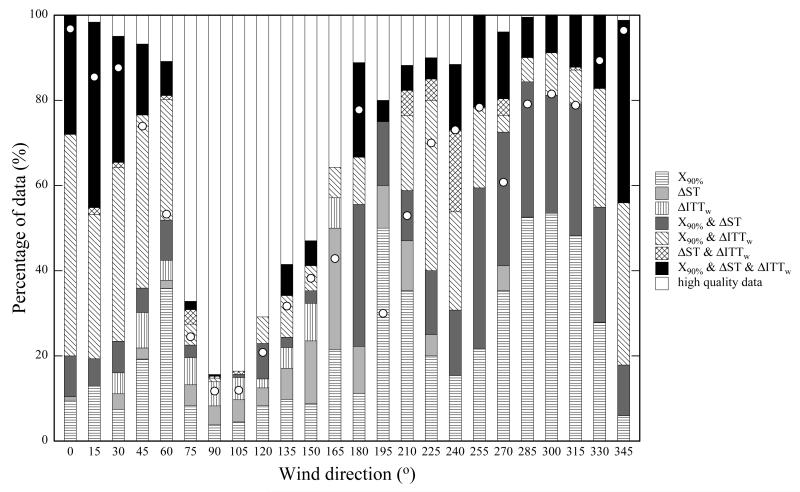
In summary, requiring less than 30 % deviation from the integral turbulence and stationarity test, as well as 90 % of the measured flux to originate from within the boundaries of the meadow, leaves 581 from 2991 available half-hourly observations, i.e. 19 % of the data. This reduction is most severe in the sectors between 255-60° and thus, generally speaking, during nighttime, when footprint limitations and/or the lack of fulfilment of the integral turbulence test result in the majority of the data being excluded (Figure 6). If we relax the footprint criterion and require only the peak of the footprint to be located within the boundaries of the meadow (cf. Novick et al., 2004), the fraction of valid observations improves to 36 %, thanks mainly to gains in the sectors dominating during nighttime conditions (Figure 6). The following analysis is based on the data set filtered according to the latter criteria, even if the decision to abandon the X90% footprint criterion may be questioned. Given the need for an as-large-as-possible nighttime data basis on which to base a future assessment of the ecosystem CO2 source/sink strength on one hand, and the problematic nature of the application of footprint models in complex terrain on the other (Finnigan, 2004b), we consider this approach a viable, but admittedly subjective, compromise.
Figure 6. Summary of the of the quality control tests as a function of wind direction at the study site Kaserstattalm.
Circles indicate the percentage of valid half-hourly observations if the peak of the footprint is used as quality criterion instead of the 90 % footprint.
3.3 Validation of eddy covariance measurements
The applicability of the eddy covariance measurements at Kaserstattalm is evaluated for the CO2 fluxes by comparison against independent chamber measurements of the NEE, and for the energy fluxes by assessing the ability of the eddy covariance method to close the energy balance. In order to identify potential effects of complex terrain, the latter is compared against the energy balance closure from Neustift, which is situated on level terrain in the valley bottom (Wohlfahrt et al., 2005a,b).
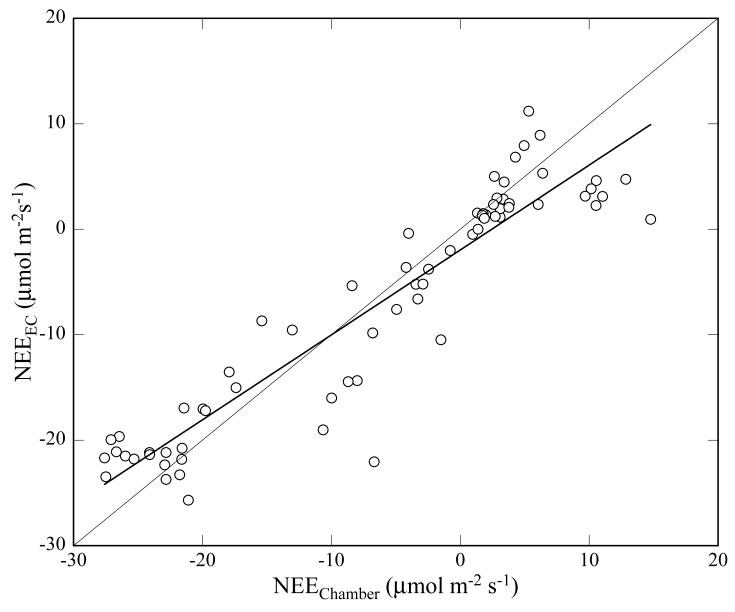
The comparison between the NEE measured by ecosystem chambers and the eddy covariance method, depicted in Figure 7, shows that the eddy covariance method underestimated the NEE measured by chambers at Kaserstattalm on average by 19 % (Table 2). In the view of the differences in spatial and temporal scales between both methods (cf. Wohlfahrt et al., 2005a), and given that these results are comparable with other comparisons of this kind in more simple terrain (e.g. Dugas et al., 1997; Angell et al., 2001; Dore et al., 2003; Zamolodchikov et al., 2003), we are confident that the eddy covariance CO2 flux measurements at the Kaserstattalm are capable of capturing the biological source/sink strength for CO2 of this ecosystem. Supporting evidence for the validity of the nighttime CO2 flux measurements is deduced from Figure 8, which shows ecosystem respiration, normalised with a parametric model that relates temperature to ecosystem respiration, as a function of friction velocity, u*. The influence of temperature (and other potential controls) removed, ecosystem respiration is usually expected to be independent of turbulent mixing and thus u* (Massman and Lee, 2002). In reality however, ecosystem respiration is often found to increase with u* until some threshold before it becomes independent of u*, which is usually interpreted as an indication of flux loss due to advection (Massman and Lee, 2002). As shown in Figure 8, ecosystem respiration at Kaserstattalm is overall independent of u*, suggesting advection to play a minor role for the quality-controlled (as described above) nighttime measurements. We emphasise the latter point, as the footprint quality control criterion essentially acts as a turbulence filter, removing observations at greater stabilities (85 % of filtered nighttime data ζ < 0.3), during which the peak of the footprint extends beyond the boundaries of the meadow and which are associated with low u*’s (90 % of filtered nighttime data u* > 0.15 m s−1).
Figure 7. Comparison between the net ecosystem CO2 exchange (NEE) measured by means of ecosystem chambers and the eddy covariance method for the study site Kaserstattalm.
Symbols represent measurements, the bold line a linear regression, and the thin line indicates 1:1 correspondence.
Table 2. Linear regression statistics for comparison of eddy covariance versus chamber CO2 flux measurements, as well as for the energy balance closure.
| Kaserstattalm | Neustift | ||
|---|---|---|---|
| EC vs. chamber | n | 70 | n.a. |
| slope | 0.81 | n.a. | |
| y-intercept | −1.97 | n.a. | |
| RMSE | 4.68 | n.a. | |
| r2 | 0.87 | n.a. | |
| Energy balance closure | n | 811 | 2179 |
| slope | 0.71 | 0.72 | |
| y-intercept | 4.23 | 5.49 | |
| RMSE | 110.61 | 83.97 | |
| r2 | 0.93 | 0.79 | |
| EBR | 0.73 | 0.75 |
n … number of half-hourly samples, RMSE … root mean squared error, EBR … energy balance ratio (cf. Wilson et al. 2002), n.a. … not available
Figure 8. Nighttime ecosystem respiration, normalised with a parametric model that relates temperature to ecosystem respiration, as a function of friction velocity for the study site Kaserstattalm.
All valid half-hourly data (closed symbols) were sorted by friction velocity into 10 classes (open symbols), each with equal number of observations (30). Error bars refer to ± 1 standard deviation.
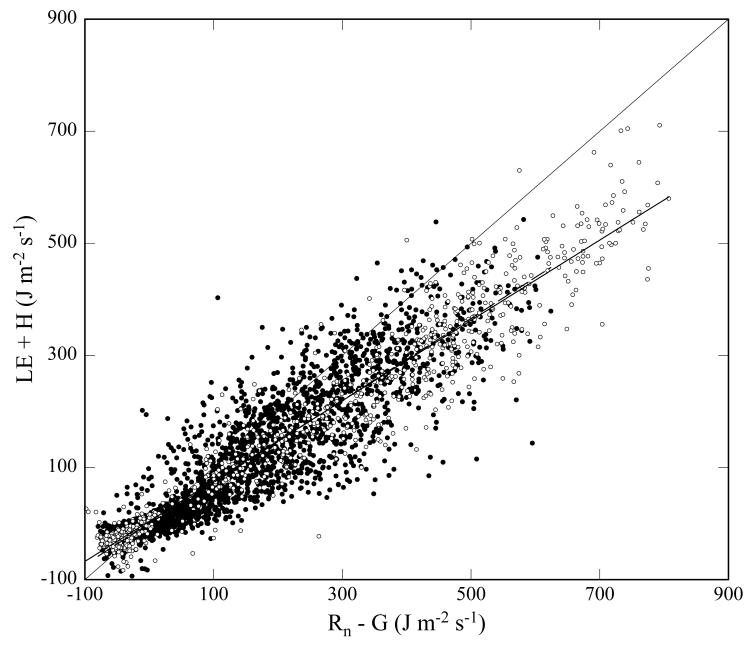
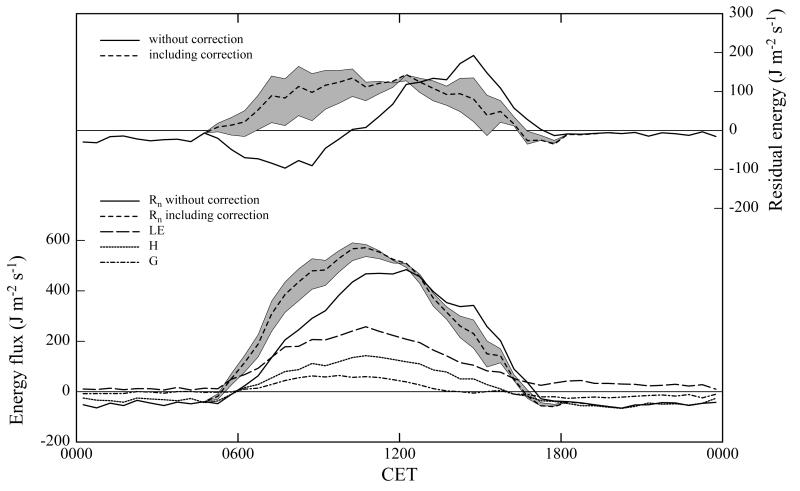
Closure of the energy balance is another independent test that can be applied to check the accuracy of eddy covariance measurements by equating the turbulent (latent and sensible) heat fluxes with the available energy, i.e. net radiation minus the heat flux into storage. Figures 9 and 10 show the energy balance closure for both Kaserstattalm and Neustift, and it can be seen, that the eddy covariance method underestimated the available energy on average by 28 and 29 %, respectively (Table 2). Differences between both sites were statistically not significant (p = 0.332), and moreover well in the range of energy balance closures (0.53-0.99, mean = 0.79 ± 0.01 %) reported in a recent survey of 50 FLUXNET sites by Wilson et al. (2002). This is not to be understood to imply that failure to account for around 30 % of the available energy is reasonable or negligible, as this is in fact an issue the micrometeorological community urgently needs to resolve for rendering credibility to results from long-term flux measurements (Baldocchi, 2003). It merely shows, that the ability of the eddy covariance method to close the energy balance at Kaserstattalm is not worse than many sites on flat, seemingly ideal terrain, which we recall, was the basic hypothesis of this work. Advection aside, factors most frequently deemed responsible for the lack of energy balance closure include: i) filtering of low frequency flux contributions (Finnigan et al., 2003), ii) different footprints viewed by the turbulence and available energy measurement instruments (Schmid, 1997), and iii) instrument issues (Halldin and Lindroth, 1992; Gash and Dolman, 2003; Loescher et al., 2005): Cospectral power (data not shown) generally approached zero around f (z-d) u−1 = 0.001, suggesting, for typical wind speeds (Figure 3), the 30 min averaging interval to be sufficiently long for capturing most of the flux carried by low frequencies (cf. Finnigan et al., 2003). As shown in Figure 10, there is some uncertainty associated with the correction of horizontally measured net radiation (Eqs. 7-9) due to the variability in slope inclination (24 ± 5 °) at the study site Kaserstattalm. Yet around noon, the combined effects of solar elevation and azimuth (Eq. 9) result in a very low sensitivity to inclination (Fig. 10), rendering this effect minimal during the time when the lack of energy balance closure is largest. Large angles of attack, according to Gash and Dolman (2003), carry a relatively large proportion of the turbulent flux, in particular over rough surfaces, which is consequently underestimated. Van der Molen et al. (2004) and Nakai et al. (2006) proposed an angle of attack dependent calibration based on wind tunnel experiments in order to correct for this bias. As shown by Nakai et al. (2006), applying this correction improved the energy balance closure by 5-11 % for a peat bog and two forests. In the present study the proposed correction was not though applied as i) it was derived only for the symmetric version of the employed sonic anemometer, and ii) wind tunnel derived sonic anemometer calibrations have been found to work not satisfactorily under natural turbulent conditions (Högström and Smedman, 2003). Arguments against the importance of the angle of attack correction derive from the energy budget agreement between Kaserstattalm and Neustift. This suggests that either these larger attack angles are not significant or that underestimations caused by these tend to directionally average out.
Figure 9. Comparison between the available energy, i.e. net radiation (Rn) minus soil heat flux (G) and sum of the latent (LE) and sensible (H) heat fluxes for the study sites Kaserstattalm (open symbols and solid line) and Neustift (closed symbols and dashed line).
Bold lines represent linear regressions, the thin line indicates 1:1 correspondence.
Figure 10. Bin-averaged (all valid observations) diurnal courses of the residual energy (upper panel) and the net radiation (Rn), soil (G), sensible (H) and latent (LE) heat flux (lower panel) at the study site Kaserstattalm.
Net radiation and residual energy are shown both with and without application of the correction for inclination and exposition of the slope (Eqs. 7-9). Grey areas indicate the 95 % confidence interval of this correction based on ± 1.96 of the standard deviation (5 °) of the average slope (24 °).
4. Summary and Conclusion
In the current paper we present CO2, latent and sensible energy fluxes measured by means of the eddy covariance method above a mountain meadow situated on a steep slope in the Stubai Valley/Austria. Our work was based on the hypothesis that, due to the low canopy height, measurements can be made in the shallow equilibrium layer where the wind field exhibits characteristics akin to level terrain. A homogeneous source/sink distribution provided, this allows to neglect advection in the first place and justifies the application of the familiar 1D eddy covariance framework. In order to test the validity of this hypothesis and to identify effects of complex terrain in turbulence measurements we subjected data to a rigorous testing procedure using a series of quality control measures established for surface layer flows. The resulting high-quality data set comprised 36 % of the original observations, the substantial reduction being mainly due to a change in surface roughness, which lead to a deviation from the flux variance similarity quality criterion, and associated fetch limitations in the wind sector dominating during nighttime and transition periods. The validity of the high-quality data set was further assessed by two independent tests: i) the ability of the eddy covariance measurements to close the energy balance and ii) a comparison with the net ecosystem CO2 exchange measured by means of ecosystem chambers. In the view of the differences in spatial and temporal scales between both methods, the net ecosystem CO2 exchange measured by the eddy covariance method agreed reasonably with ecosystem chamber measurements. The assessment of the energy balance closure showed that there was no significant difference in the correspondence between the meadow on the slope and another one situated on flat ground at the bottom of the Stubai Valley, available energy being underestimated by 28 and 29 %, respectively. We thus conclude that, after appropriate quality control, the eddy covariance measurements made above a mountain meadow on a steep slope are of similar quality as fluxes measured over flat terrain, confirming the initial hypothesis of this study.
Given the complexity of flows in mountain regions and that our knowledge on the effects of complex terrain is largely based on theoretical and experimental studies on simple two-dimensional hills, it is clear that the results presented in this paper represent only a small step forward. In order to advance our understanding of the biosphere-atmosphere exchange processes over short vegetation in complex terrain, we need to better understand how the flow in the equilibrium layer interacts with the disturbed overhead flow and what the resulting consequences for closing the scalar mass balance are.
ACKNOWLEDGEMENTS
This study was funded by the EU FP 5 project CARBOMONT (EVK2-CT2001-00125), as well as the Austrian National Science Fund (FWF) under contract P17560. Werner Eugster and three anonymous reviewers are acknowledged for constructive comments on an earlier version of this paper and Georg Leitinger for preparing Figures 1 and 2. Average annual temperatures and precipitation were generously provided by the Austrian Hydrographic Service.
REFERENCES
- Angell RF, Svejcar T, Bates J, Saliendra NZ, Johnson DA. Bowen ratio and closed chamber carbon dioxide flux measurements over sagebrush steppe vegetation. Agric. For. Meteorol. 2001;108:153–161. [Google Scholar]
- Aubinet M, Grelle A, Ibrom A, Rannik Ü, Moncrieff J, Foken T, Kowalski AS, Martin PH, Berbigier P, Bernhofer Ch., Clement R, Elbers J, Granier A, Grünwarld T, Morgenstern K, Pilegaard K, Rebmann C, Snijders W, Valentini R, Vesala T. Estimates of the annual net carbon and water exchange of forest: the EUROFLUX methodology. Adv. Ecol. Res. 2000;30:113–175. [Google Scholar]
- Aubinet M, Chermanne B, Vandenhaute M, Longdoz B, Yernaux M, Laitat E. Long term carbon dioxide exchange above a mixed forest in the Belgian Ardennes. Agric. For. Meteorol. 2001;108:293–315. [Google Scholar]
- Aubinet M, Heinesch B, Yernaux M. Horizontal and vertical CO2 advection in a sloping forest. Boundary-Layer Meteorol. 2003;108:397–417. [Google Scholar]
- Aubinet M, Berbigier P, Bernhofer Ch., Cescatti A, Feigenwinter C, Granier A, Grünewald Th., Havrankova K, Heinesch B, Longdoz B, Marcolla B, Montagnani L, Sedlak P. Comparing CO2 storage and advection conditions at night at different Carboeuroflux sites. Boundary-Layer Meteorol. 2005;116:63–94. [Google Scholar]
- Bätzing W. Landwirtschaft im Alpenraum-unverzichtbar aber zukunftslos? In: Bätzing W, editor. Landwirtschaft im Alpenraum - unverzichtbar, aber zukunftslos? Einealpenweite Bilanz der aktuellen Probleme und der möglichen Lösungen. Blackwell Wissenschaftsverlag; Berlin: 1996. pp. 9–11. [Google Scholar]
- Baldocchi DD. Assessing the eddy covariance technique for evaluating carbon dioxide exchange rates of ecosystems: past, present and future. Global Change Biol. 2003;9:479–492. [Google Scholar]
- Baldocchi DD, Hicks BB, Meyers TP. Measuring biosphere-atmosphere exchanges of biologically related gases with micrometeorological methods. Ecology. 1988;69:1331–1340. [Google Scholar]
- Baldocchi DD, Finnigan JJ, Wilson KW, Paw U KT, Falge E. On measuring net ecosystem carbon exchange in complex terrain over tall vegetation. Boundary-Layer Meteorol. 2000;96:257–291. [Google Scholar]
- Baldocchi DD, Falge E, Gu L, Olson R, Hollinger D, Running S, Anthoni P, Bernhofer Ch., Davis K, Fuentes J, Goldstein A, Katul G, Law B, Lee X, Malhi Y, Meyers T, Munger JW, Oechel W, Pilegaard K, Schmid HP, Valentini R, Verma S, Vesala T, Wilson K, Wofsy S. FLUXNET: A New Tool to Study the Temporal and Spatial Variability of Ecosystem-Scale Carbon Dioxide, Water Vapor and Energy Flux Densities. Bull. Am. Meteorol. Soc. 2001;82:2415–2435. [Google Scholar]
- Barford CC, Wofsy SC, Goulden ML, Munger JW, Hammond Pyle E, Urbanski SP, Hutyra L, Saleska SR, Fitzjarrald D, Moore K. Factors controlling long and short term sequestration of atmospheric CO2 in a mid-latitude forest. Science. 2001;294:1688–1691. doi: 10.1126/science.1062962. [DOI] [PubMed] [Google Scholar]
- Bitterlich W, Cernusca A. Stubai Valley composite landscape, Tyrol, Austria. In: Cernusca A, Tappeiner U, Bayfield N, editors. Land-use changes in European mountain ecosystems. ECOMONT – concepts and results. Blackwell Wissenschafts-Verlag; Berlin: 1999. pp. 35–45. [Google Scholar]
- Cernusca A, Tappeiner U, Bayfield N. ECOMONT – concepts and results. Blackwell Wissenschaftsverlag; Berlin: 1999. Land-use changes in European mountain ecosystems; p. 368. [Google Scholar]
- Curtis PS, Hanson PJ, Bolstad P, Barford C, Randolph JC, Schmid HP, Wilson KB. Biometric and eddy-covariance based estimates of ecosystem carbon storage in five eastern North American deciduous forests. Agric. For. Meteorol. 2002;113:3–19. [Google Scholar]
- Dore S, Hymus GJ, Johnson DP, Hinkle CR, Valentini R, Drake BG. Cross validation of open-top chamber and eddy covariance measurements of ecosystem CO2 exchange in a Florida scrub-oak ecosystem. Global Change Biol. 2003;9:84–95. [Google Scholar]
- Dugas WA, Reicosky DC, Kiniry JR. Chamber and micrometeorological measurements of CO2 and H2O fluxes for three C4 grasses. Agric. For. Meteorol. 1997;83:113–133. [Google Scholar]
- Ehman JL, Schmid HP, Randolph JC, Grimmond CSB, Hanson PJ, Wayson CA, Cropley FD. An initial intercomparison of micrometeorological and ecological inventory estimates of carbon sequestration in a mid-latitude deciduous forest. Global Change Biol. 2002;8:575–589. [Google Scholar]
- Feigenwinter C, Bernhofer Ch., Vogt R. The influence of advection on the short term CO2-budget in and above a forest canopy. Boundary-Layer Meteorol. 2004;113:201–224. [Google Scholar]
- Finnigan JJ. Advection and modelling. In: Lee X, Massman W, Law B, editors. Handbook of Micrometeorology. Kluwer Academic Publishers; Dordrecht: 2004a. pp. 209–244. [Google Scholar]
- Finnigan JJ. The footprint concept in complex terrain. Agric. For. Meteorol. 2004b;127:117–129. [Google Scholar]
- Finnigan JJ, Belcher SE. Flow over a hill covered with a plant canopy. Quart. J. Royal Meteorol. Soc. 2004;130:1–29. [Google Scholar]
- Finnigan JJ, Clement R, Malhi Y, Leuning R, Cleugh HA. A re-evaluation of long-term flux measurement techniques. Part I: Averaging and coordinate rotation. Boundary-Layer Meteorol. 2003;107:1–48. [Google Scholar]
- Foken Th., Wichura B. Tools for quality assessment of surface-based flux measurements. Agric. For. Meteorol. 1996;78:83–105. [Google Scholar]
- Foken Th., Göckede M, Mauder M, Mahrt L, Amiro B, Munger W. Post-field data quality control. In: Lee X, Massman W, Law B, editors. Handbook of Micrometeorology. Kluwer Academic Publishers; Dordrecht: 2004. pp. 181–208. [Google Scholar]
- Froelich NJ, Schmid HP, Grimmond CSB, Su H-B, Oliphant AJ. Flow divergence and density flows above and below a deciduous forest. Part I. Non-zero mean vertical wind above canopy. Agric. For. Meteorol. 2005;133:140–152. [Google Scholar]
- Garcia-Ruiz JM, Lasanta T, Ruiz-Flano P, Ortigosa L, White S, Gonzalez C, Marti C. Land-use changes and sustainable development in mountain areas: a case study in the Spanish Pyrenees. Landscape Ecol. 1996;11:267–277. [Google Scholar]
- Gash JHC, Dolman AJ. Sonic anemometer (co)sine response and flux measurement I. potential for (co)sine error to affect sonic anemometer-based flux measurements. Agric. For. Meteorol. 2003;119:195–207. [Google Scholar]
- Geissbühler P, Siegwolf R, Eugster W. Eddy covariance measurements on mountain slopes: The advantage of surface-normal sensor orientation over a vertical set-up. Boundary-Layer Meteorol. 2000;96:317–392. [Google Scholar]
- Goudriaan J, Van Laar HH. Modelling potential crop growth processes. Kluwer Academic Publishers; Dordrecht: 1994. p. 238. [Google Scholar]
- Gu L, Falge E, Boden T, Baldocchi D, Black TA, Saleska S, Suni T, Verma S, Vesala T, Wofsy S, Xu L. Objective threshold determination for nighttime eddy flux filtering. Agric. For. Meteorol. 2005;128:179–197. [Google Scholar]
- Halldin S, Lindroth A. Errors in net radiometry: Comparison and evaluation of six radiometer designs. J. Atmos. Ocean. Tech. 1992;9:762–783. [Google Scholar]
- Henne S, Furger M, Nyeki S, Steinbacher M, Neininger B, de Wekker SFJ, Dommen J, Spichtinger N, Stohl A, Prevot ASH. Quantification of topographic venting of boundary layer air to the free troposphere. Atmos. Chem. Phys. 2004;4:497–509. [Google Scholar]
- Högström U, Smedman A-S. Accuracy of sonic anemometers: Laminar wind tunnel calibrations compared to atmospheric in situ calibrations against a reference instrument. Boundary-Layer Meteorol. 2003;111:33–54. [Google Scholar]
- Hsieh C-I, Katul G, Chi T-W. An approximate analytical model for footprint estimation of scalar fluxes in thermally stratified atmospheric flows. Adv. Water Resources. 2000;23:765–772. [Google Scholar]
- Jackson PS, Hunt JCR. Turbulent wind flow over a low hill. Quart. J. Royal Meteorol. Soc. 1975;101:929–955. [Google Scholar]
- Kaimal JC, Wyngaard JC. The Kansas and Minnesota experiments. Boundary-Layer Meteorol. 1990;50:31–47. [Google Scholar]
- Kaimal JC, Finnigan JJ. Atmospheric Boundary Layer Flows. Oxford University Press; Oxford: 1994. p. 289. [Google Scholar]
- Katul GG, Finnigan JJ, Poggi D, Leuning R, Belcher S. The influence of hilly terrain on canopy-atmosphere carbon dioxide exchange. Boundary Layer Meteorol. 2005 (In press) [Google Scholar]
- Kominami Y, Miyama T, Tamai K, Nobuhiro R, Goto Y. Characteristics of CO2 flux over a forest on complex topography. Tellus. 2003;55B:313–312. [Google Scholar]
- Kristensen L, Mann J, Oncley SP, Wyngaard JC. How close is close enough when measuring scalar fluxes with displaced sensors. J. Atmos. Oceanic Tech. 1997;14:814–821. [Google Scholar]
- Lee X, Hu X. Forest-air fluxes of carbon and energy over non-flat terrain. Boundary-Layer Meteorol. 2002;103:277–301. [Google Scholar]
- Lee X, Finnigan J, Paw U KT. Coordinate systems and flux bias error. In: Lee X, Massman W, Law B, editors. Handbook of Micrometeorology. Kluwer Academic Publishers; Dordrecht: 2004. pp. 33–66. [Google Scholar]
- Loescher HW, Ocheltree T, Tanner B, Swiatek E, Dano B, Wong J, Zimmerman G, Campbell J, Stock C, Jacobsen L, Shiga Y, Kollas J, Liburdy J, Law BE. Comparison of temperature and wind statistics in contrasting environments among different sonic anemometer-thermometers. Agric. For. Meteorol. 2005;133:119–139. [Google Scholar]
- Marcolla B, Cescatti A, Montagnani L, Manca G, Kerschbaumer G, Minerbi S. Importance of advection in the atmospheric CO2 exchanges of an alpine forest. Agric. For. Meteorol. 2005;130:193–206. [Google Scholar]
- Massman WJ. A simple method for estimating frequency response corrections for eddy covariance systems. Agric. For. Meteorol. 2000;104:185–198. [Google Scholar]
- Massman WJ, Lee X. Eddy covariance flux corrections and uncertainties in long-term studies of carbon and energy exchanges. Agric. For. Meteorol. 2002;113:121–144. [Google Scholar]
- Massman WJ, Clement R. Uncertainty in eddy covariance flux estimates resulting from spectral attenuation. In: Lee X, Massman W, Law B, editors. Handbook of Micrometeorology. Kluwer Academic Publishers; Dordrecht: 2004. pp. 67–100. [Google Scholar]
- Moore CJ. Frequency response corrections for eddy correlation systems. Boundary-Layer Meteorol. 1986;37:17–35. [Google Scholar]
- Nakai T, van der Molen MK, Gash JHC, Kodama Y. Correction of sonic anemometer angle of attack errors. Agric. For. Meteorol. 2006;136:19–30. [Google Scholar]
- Nie D, Demetriades-Shah T, Kanemasu ET. Surface energy fluxes on four slope sites during FIFE 1988. J. Geophy. Res. 1992;97:18641–18649. [Google Scholar]
- Novick KA, Stoy PC, Katul GG, Ellsworth DS, Siqueira MBS, Juang J, Oren R. Carbon dioxide and water vapor exchange in a warm temperate grassland. Oecologia. 2004;138:259–274. doi: 10.1007/s00442-003-1388-z. [DOI] [PubMed] [Google Scholar]
- Raupach MR, Finnigan JJ. The influence of topography on meteorological variables and surface-atmosphere interactions. J. Hydrol. 1997;190:182–213. [Google Scholar]
- Schmid HP. Experimental design for flux measurements: matching the scales of observations and fluxes. Agric. For. Meteorol. 1997;87:179–200. [Google Scholar]
- Schmid HP. Footprint modeling for vegetation atmosphere exchange studies: a review and perspectives. Agric. For. Meteorol. 2002;113:159–183. [Google Scholar]
- Staebler RM, Fitzjarrald DR. Observing subcanopy CO2 advection. Agric. For. Meteorol. 2004;122:139–156. [Google Scholar]
- Theurillat J-P, Guisan A. Potential impact of climate change on vegetation in the European Alps: a review. Clim. Change. 2001;50:77–109. [Google Scholar]
- Turnipseed AA, Anderson D, Blanken P, Monson RK. Energy balance above a high-elevation subalpine forest in complex topography. Agric. For. Meteorol. 2002;110:177–201. [Google Scholar]
- Turnipseed AA, Anderson DE, Blanken PD, Baugh WM, Monson RK. Airflows and turbulent flux measurements in mountainous terrain. Part 1: Canopy and local effects. Agric. For. Meteorol. 2003;119:1–21. [Google Scholar]
- Turnipseed AA, Anderson DE, Burns S, Blanken PD, Monson RK. Airflows and turbulent flux measurements in mountainous terrain. Part 2: Mesoscale effects. Agric. For. Meteorol. 2004;125:187–205. [Google Scholar]
- Van der Molen MK, Gash JHC, Elbers JA. Sonic anemometer (co)sine response and flux measurement II. The effect of introducing an angle of attack dependent calibration. Agric. For. Meteorol. 2004;122:95–109. [Google Scholar]
- Webb EK, Pearman GI, Leuning R. Correction of flux measurements for density effects due to heat and water vapour transfer. Quart. J. Royal Meteorol. Soc. 1980;106:85–100. [Google Scholar]
- Whiteman CD. Observations of thermally developed wind systems in mountainous terrain. Meteorol. Mono. 1990;23:5–42. [Google Scholar]
- Wilczak JM, Oncley SP, Stage SA. Sonic anemometer tilt correction algorithms. Boundary-Layer Meteorol. 2001;99:127–150. [Google Scholar]
- Wilson KB, Goldstein AH, Falge E, Aubinet M, Baldocchi D, Berbigier P, Bernhofer Ch., Ceulemans R, Dolman H, Field C, Grelle A, Law B, Meyers T, Moncrieff J, Monson R, Oechel W, Tenhunen J, Valentini R, Verma S. Energy balance closure at FLUXNET sites. Agric. For. Meteorol. 2002;113:223–243. [Google Scholar]
- Wohlfahrt G. Modelling fluxes and scalar concentrations of CO2, H2O and sensible heat within and above a mountain meadow canopy: a comparison of three Lagrangian models and three parameterisation options for the Lagrangian time scale. Boundary-Layer Meteorol. 2004;113:43–80. [Google Scholar]
- Wohlfahrt G, Anfang Ch., Bahn M, Haslwanter A, Newesely Ch., Schmitt M, Drösler M, Pfadenhauer J, Cernusca A. Quantifying nighttime ecosystem respiration of a meadow using eddy covariance, chambers and modelling. Agric. For. Meteorol. 2005a;128:141–162. [Google Scholar]
- Wohlfahrt G, Bahn M, Haslwanter A, Newesely Ch., Cernusca A. Estimation of daytime ecosystem respiration to determine gross primary production of a mountain meadow. Agric. For. Meteorol. 2005b;130:13–25. [Google Scholar]
- Yi C, Monson RK, Zhai Z, Anderson DE, Lamb B, Allwine G, Turnipseed AA, Burns SP. Modeling and measuring the nocturnal drainage flow in a high-elevation, subalpine forest with complex terrain. J. Geophy. Res. 2005;110:D22303. doi: 10.1029/2005JD006282. [Google Scholar]
- Zamolodchikov DG, Karelin DV, Ivaschenko AI, Oechel WC, Hastings SJ. CO2 flux measurements in Russian Far East tundra using eddy covariance and closed chamber techniques. Tellus. 2003;55B:897–892. [Google Scholar]


