Abstract
Pencil traces drawn on print papers are shown to function as strain gauges and chemiresistors. Regular graphite/clay pencils can leave traces composed of percolated networks of fine graphite powders, which exhibit reversible resistance changes upon compressive or tensile deflections. Flexible toy pencils can leave traces that are essentially thin films of graphite/polymer composites, which show reversible changes in resistance upon exposure to volatile organic compounds due to absorption/desorption induced swelling/recovery of the polymer binders. Pencil-on-paper devices are low-cost, extremely simple and rapid to fabricate. They are light, flexible, portable, disposable, and do not generate potentially negative environmental impact during processing and device fabrication. One can envision many other types of pencil drawn paper electronic devices that can take on a great variety of form factors. Hand drawn devices could be useful in resource-limited or emergency situations. They could also lead to new applications integrating art and electronics.
In recent years, paper-based electronics have garnered significant attention due to the potential to produce flexible, thin, low-cost, portable, and environmentally-friendly products including antennae1, touch pads2, microfluidic devices3, displays4, sound sources5, printed circuit boards6, and sensors7,8. Unlike traditional substrates such as silicon, glass, and/or plastic, paper fibers offer a naturally porous environment which provides an increased deposition area and allows the formation of composites using materials deposited within the cellulose fibers9. Thus, devices that can benefit from large contact surfaces such as energy storage devices10,11,12,13,14, solar cells15, and ultraviolet (UV) sensors16 have been developed to utilize these advantages.
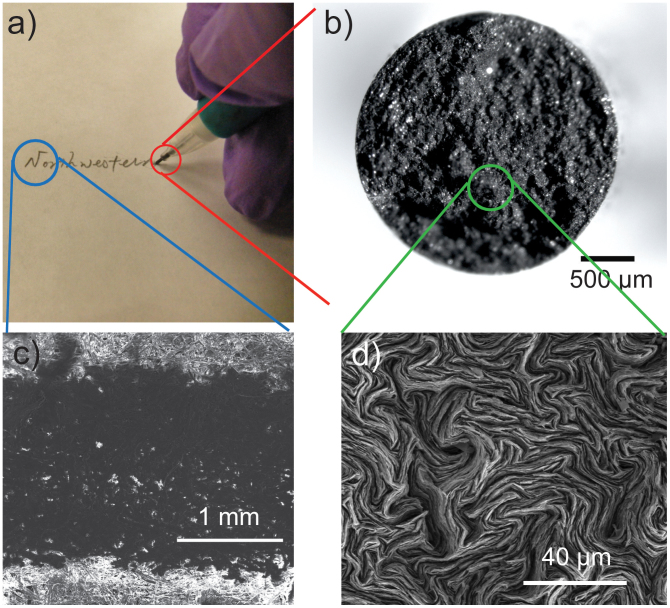
In most of these paper-based devices, writing inks made of expensive materials such as carbon nanotubes and metal nanoparticles are typically used through extensive processing techniques. These drawing materials are often dispersed in liquids and deposit traces on papers after solvent evaporation. On the other hand, a pencil, an everyday commodity, can easily make graphite depositions on various substrates by dry drawing (Figure 1a). The main component of the pencil lead is fine graphite powders bound together by clays. Figure 1c is a photo showing cross-sectional view of pencil lead. When observed under scanning electron microscope (SEM, Figure 1d), graphite platelets can be clearly seen. The platelets appear wavy due to the compression they experienced during manufacturing. When pencil traces are drawn on paper, friction between the pencil lead and the paper rubs off graphite particles which in turn adhere to the paper fibers. Thus pencils can be viewed as an easily deployable form of ultrafine graphite particles. Also, pencil traces can be regarded as conductive thin films made of percolated graphite particle network on paper (SEM, Figure 1b), which can take on arbitrary shapes and patterns. Pencil traces are quite stable against moisture, chemicals and UV irradiation. Although carbon-based materials have been extensively explored for the aforementioned printed device applications17,18,19,20, interests in pencil-base approaches has just begun to emerge21,22,23,24. Pencil traces have been mainly used as passive conductive elements in many devices, such as electrode contacts for batteries22, UV sensors25, microfluidic devices26, resistors24 and transistors23. In one recent study, Ren et al. demonstrated that pencil traces can be incorporated as the active components in piezoresistive sensors21. They showed that instead of using carbon ink formulated in a laboratory, a commercially available pencil can be used to draw patterns on paper, which then can be connected to an external measurement system through metallic electrodes to construct piezoresistive sensors. Here, we demonstrate that pencil traces can function not only as strain gauges to detect compressive and tensile deflections, but also as chemiresistors sensitive to volatile chemical vapors. Moreover, complete devices can be fabricated without the need for metallic electrodes using only pencil traces drawn from a single type of pencil or a combination of different types of pencils in an all-pencil fabrication process. The pencil-on-paper approach offers a unique method to developing sensing platforms where devices can be fabricated in minutes using nothing more than common office supplies.
Figure 1.
(a) Optical image of a propelling pencil loaded with HB leads, writing on paper substrates. (b) Stereomicrograph of a pencil lead. (c) SEM image of a 2B pencil trace on paper showing that a continuous carbon particle film was deposited on paper. (d) SEM image of a propelling pencil lead.
Results and Discussion
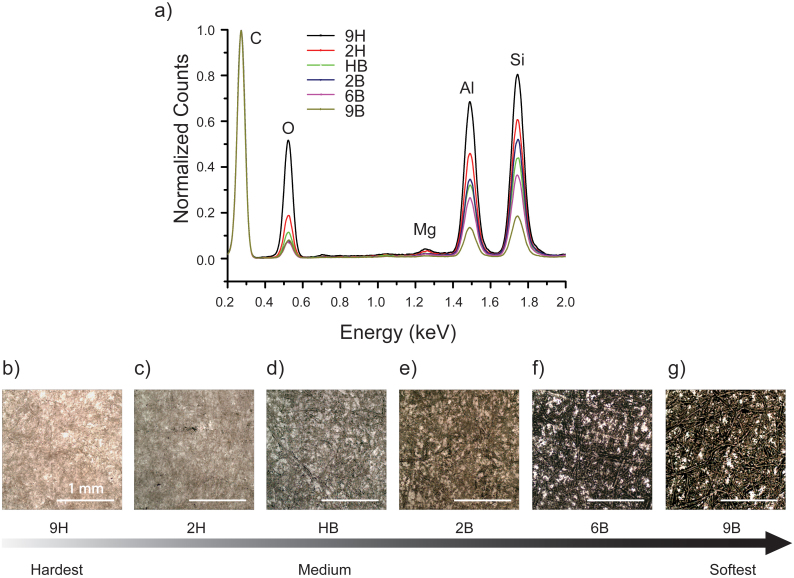
Standard pencil leads are composed of fine graphite particles held together by clay binders. Based on the hardness of these leads, pencils are classified on a scale from 9B to 9H. The difference in color arises from the different relative fractions of graphite between harder and softer pencil leads. The energy dispersive X-ray spectra (EDS) in Figure 2a were acquired on the cross-section of six different pencil leads. The intensities of the spectra were normalized based on the carbon peak to highlight the relative fractions of carbon to the clay binder, which is mainly composed of O, Mg, Al and Si. The normalized spectra confirm that harder pencil leads contain a higher proportion of clay binders while softer leads contain a higher proportion of graphite particles. The higher carbon content in the softer leads results in darker traces on paper. Figure 2b–g show optical images of pencil traces drawn on a piece of printing paper, corresponding to six different hardness classes. Under similar writing conditions, the hardest 9H lead produces the lightest-colored trace while the softest 9B lead produces the darkest one. The electrical conductivity of a pencil trace depends on the quality of the contact between graphite particles in the percolating network. Expansion and contraction of this network, induced by either mechanical stress or chemical interactions, should greatly affect the quality of inter-particle contacts and thus the overall electrical conductivity. Below we show that conductivity of pencil traces indeed respond to external mechanical and chemical stimuli, making them suitable as strain gauges and chemiresistors.
Figure 2.
(a) EDS spectra of pencil leads correlating hardness with the fraction of carbon. Intensities of all of the spectra were normalized based on the carbon peak. (b–g) Optical microscopy images of traces drawn on the paper substrates from pencils of decreasing hardness.
Pencil trace based strain gauges
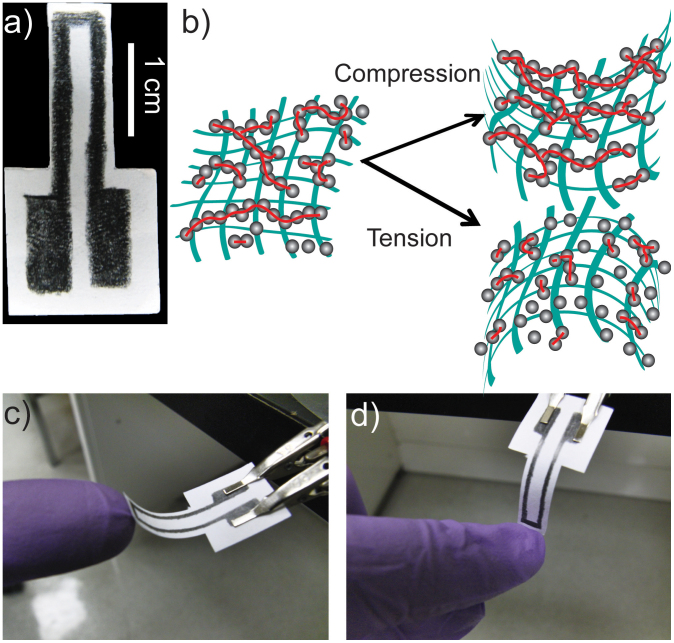
To test the pencil trace strain gauge, we drew a U-shaped cantilever pattern connected to two solid rectangles on a piece of office paper using a studio pencil (Blick®). As shown in Figure 3a, the U part is used as the active sensing beam while the two rectangles are used as contact electrodes. The cantilever is cut out by using scissors. As shown in Figure 3b, inward and outward deflections of the beam should have different effects on the resistance of the pencil trace. Inward deflection (Figure 3c) effectively compresses the graphite particle network in the two parallel segments of the U-shaped trace, and should lower the resistance. Outward deflection (Figure 3d) should increase the resistance as it stretches the trace. Therefore, the two types of deflections are named compressive and tensile deflections, respectively. Bending tests were done in the geometry similar to Figure 3c–d by vertically pressing or lifting the tip of the cantilever. The degree of deflection was quantified by measuring the vertical displacement of the tip. The rectangular contact patterns were fixed on a glass slide so that the deflection only bends the beam. Changes of electrical resistance along the U-shaped trace were monitored using a Keithley 2400 source meter connected to the electrodes by toothless alligator clips.
Figure 3.
(a) A photograph showing the U-shaped pencil trace drawn on a paper beam functioning as a strain gauge. (b) Schematic drawing shows that the number of connected graphite particle chains varies depending on the types of deformation. (c–d) Photograph of the gauge deformed by a single finger in compression and tension, respectively.
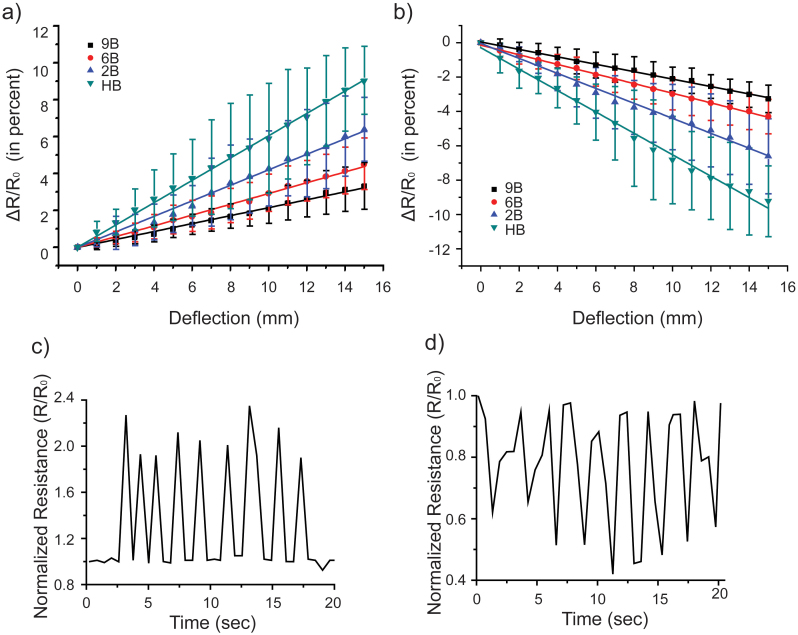
The base resistances of the unstrained devices drawn by 9B, 6B, 2B, and HB pencils were measured to be 200 kΩ, 500 kΩ, 2 MΩ, and 20 MΩ, respectively. As expected, the softer pencil leads with higher graphite content exhibited lower resistances. The base resistances of traces drawn with 2H and harder pencils were too high to be measured. These four devices were then tested under repeated deflections. Absolute resistances of different devices, R, were normalized by the base resistance of each device, R0, and the percent change in resistance, ΔR/R0, was plotted for each device. Under tensile deflection (i.e., outward bending), graphite particles were pulled further apart, disconnecting the conduction pathways, which resulted in higher resistances (Figure 4a). The solid lines represent linear fits to the tensile resistance change-deflection data with equations: y = 0.099x (R2 = 0.991) for the 9B device; y = 0.28x (R2 = 0.991) for the 6B device; y = 0.48x (R2 = 0.991) for the 2B device, and y = 0.70x (R2 = 0.992) for the HB device. Conversely, under compressive deflection, the graphite particles in the trace were pushed closer together, facilitating conduction through the percolating network. This indeed decreased the measured resistances (Figure 4b). The solid lines represent linear fits to the compressive resistance change-deflection data with equations: y = −0.22x (R2 = 0.989) for the 9B device; y = −0.34x (R2 = 0.997) for the 6B device; y = −0.38x (R2 = 0.991) for the 2B device; and y = −0.55x (R2 = 0.986) for the HB device. Within the measured range of deflections, the mean resistance changes were linearly correlated to the mean magnitudes of deflection within around 1% deviations.
Figure 4.
(a–b) Change in normalized resistance vs. deflections for devices drawn with four different types of pencils during compressive and tensile mode of deflections, respectively. (c–d) Repetitive responses under repeated tensile and compressive cycles, respectively.
For both compressive and tensile deformation, traces drawn with harder pencils exhibited greater responses, as shown by the steeper slopes of the resistance change-deflection curves in Figure 4a and 4b. This indicates that the volume fractions of conductive carbon particles in traces drawn by the harder pencil leads are closer to the percolation threshold than those of softer pencil traces, thus leading to more pronounced “break junction” type of sensing behaviors27. Since traces from HB pencil demonstrated the largest response while 2H pencil traces were nonconductive, the carbon content of the HB pencil traces may coincidentally lie just above the percolation threshold.
To test the reusability of the pencil-based touch sensor, we applied short repetitive deflections at regular intervals. Figure 4c and 4d show the sensor responses to these repetitive strains in both tensile and compressive modes. The device consistently exhibited a spike in resistance when a tensile strain was applied followed by a rapid return to the base resistance when the strain was removed. Similarly, the device exhibited a sharp drop in resistance when a compressive strain was applied followed by a rapid return to the base resistance when the strain was removed. Fully reversible responses were observed after tens of bending cycles.
Traces from flexible pencil as chemiresistors
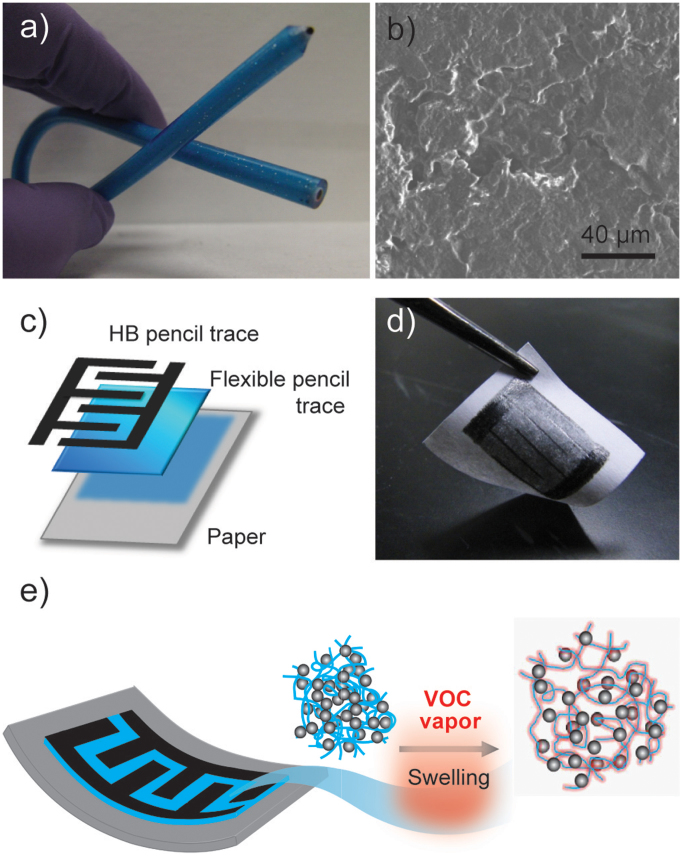
While regular pencils use inorganic clay materials as binder, some specialty pencils use organic and polymeric binders, such as grease pencils for drawing on hard and smooth surfaces or flexible toy pencils that can bend like rubber without breaking the lead (Figure 5a). Extensive works have been done in chemiresistors based on carbon black/polymer composites, in which the percolated carbon particle network is embedded in a volatile organic compound (VOC) sensitive polymer matrix28,29. Upon exposure to VOCs, the polymer matrix is swollen, resulting in more separated carbon particles in the percolating network and thus increased resistance (Figure 5e). Since the lead of the flexible pencil is essentially a graphite/polymer composite, it should be useful as a facile processing tool that can readily generate thin films of graphite/polymer composites (i.e. pencil traces) that can act as chemiresistors for VOCs. The flexible pencil we used consists of graphite particles embedded in a polyvinyl chloride (PVC)-based matrix. The soft polymer binder makes the cross-sectional surface of the flexible pencil lead smoother (Figure 5b) than that of regular pencil leads (Figure 1d). Figure 5d shows a chemiresistor drawn on paper, consisting of two layers of pencil traces (Figure 5c). The first rectangular shaped layer (10 mm × 16 mm) was drawn from a flexible pencil as the active sensing element, on top of which a set of interdigitated electrodes (finger width around 0.2 mm and finger separation 2 mm) was drawn using a more conductive regular HB pencil to better connect the sensing layer to external contacts such as a pair of alligator clips. The use of interdigitated electrodes was found to decrease the initial resistance of the device, and improve the signal-to-noise ratio of the measured resistance over time.
Figure 5.
(a) Photograph showing a flexible toy pencil. (b) SEM image of the flexible pencil lead. (c) Schematic diagram showing a bilayer chemiresistor. The first rectangular-shaped layer was drawn with a flexible pencil, acting as the active sensing layer, on top of which a set of interdigitated electrode were drawn with an HB pencil to improve electrical contact during measurements. (d) Photograph of the pencil-drawn chemiresistor, showing the flexibility of the device. (e) Schematic diagram showing how VOC vapor swells the polymer matrix in the active sensing layer of the device and push the graphite particles apart, where the black dots represent graphite particles.
To test the response of the device upon exposure to various VOCs, we exposed the device to the vapors above six different solvents using a 250 mL flask as a head space chamber. The vapor pressures of the six solvents at room temperature (25°C) are as follows: Acetone 229 torr; methanol 127 torr; ethyl acetate 95 torr; tetrahydrofuran (THF) 162 torr; toluene 28 torr; and hexane 151 torr. Resistance measurements over time were recorded using a Labview program interfaced with a Keithley 2400 source meter. Figure 6a shows normalized resistance changes (R/R0) of the chemiresistors upon exposure to the above mentioned 6 VOCs above the solvents. The R/R0 values for acetone, methanol, ethyl acetate, THF, toluene, and hexane are 1.83 ± 0.07, 1.62 ± 0.20, 1.85 ± 0.16, 3.91 ± 0.69, 1.58 ± 0.02, 1.23 ± 0.03, respectively. Based on the R/R0 value per torr, the sensitivity of the flexible pencil trace to these VOCs decreases from toluene, THF, ethyl acetate, methanol, hexane to acetone, with the relative strength being 7.0, 3.0, 2.44, 1.66, 1.02 to 1.0, respectively. Since toluene is a processing solvent for PVC and acetone is a non-solvent30, this trend is likely following the solubility of PVC in the organic solvents. Therefore, the differential responses can be attributed to different degrees of swelling of the polymer binders caused by the vapors. This is the foundation of fabricating electronic nose type of sensor arrays28. In control experiments, it was verified that traces drawn by regular graphite/clay pencils showed little to no response upon exposure to chemical vapors. Therefore, the responses were indeed attributed to the polymer binder in the flexible pencil traces. Figure 6b shows the response of a device upon exposure to acetone vapor over 10 cycles. The device was first equilibrated with the vapor for about 10 min and removed to the air before testing. This initial equilibration step leads to smoother baselines and higher signal-to-noise ratio. We found that the device consistently exhibited a rapid increase in resistance upon exposure to the acetone vapor followed by a rapid return to its base resistance when the device was re-exposed to the air. The reversible changes in resistance indicate that the flexible pencil trace can reversibly absorb and desorb acetone vapors. Tests with the other five organic vapors showed similarly reversible responses.
Figure 6.
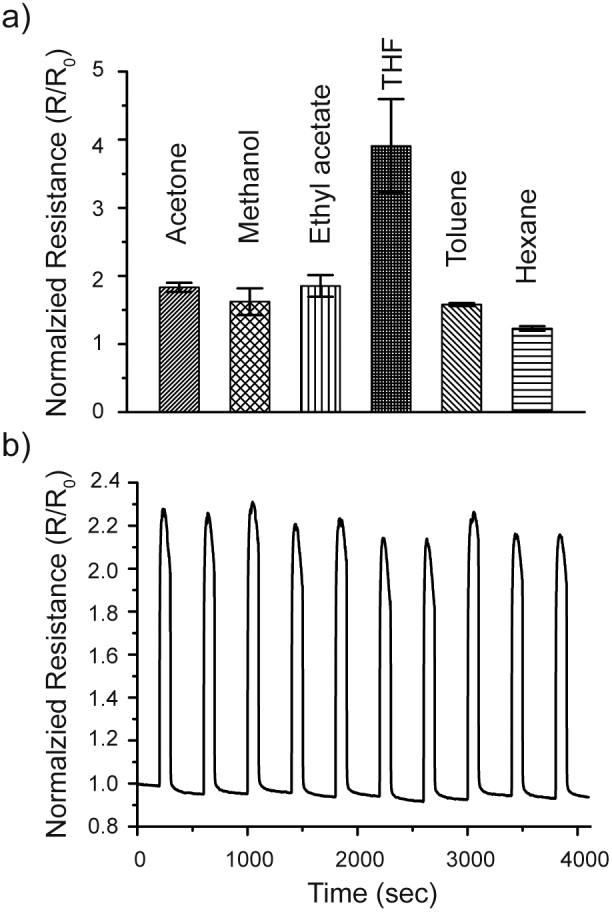
(a) Normalized resistance changes of the flexible pencil trace devices upon exposure to six different VOCs above the corresponding solvents. (b) Real-time normalized resistance of the device upon cycles (100 sec exposures to acetone vapor), showing good reversibility.
Conclusion and Outlook
In summary, we have demonstrated two types of functional sensing devices, namely strain gauges and chemiresistors made entirely by pencil traces drawn on paper. These devices are easily manufactured through simple mechanical drawing using commodity pencils on paper substrates. Traces from regular pencils can be readily used as stain sensors based on deformation induced changes in resistance through the percolating graphite particle network. The device performances could be improved by optimizing the geometries of the pencil trace patterns, the darkness of the traces and selecting paper substrates with optimized mechanical properties. The pencil drawn strain gauge can differentiate compressive and tensile signals, suggesting potential touch panel applications, in which the strain sensitive resistors could act as pressure-triggered, digital switching devices for signal input. Traces from flexible toy pencils, essentially thin films of graphite/polymer composites, can act as chemiresistors showing reversible responses upon exposure to VOCs. The work present here highlights pencils as easily deployable forms of graphite fine powders embedded in inorganic or organic matrices. Pencil-on-paper devices are very cheap and extremely simple to make. They are disposable and do not generate potentially negative environmental impact during material processing or device fabrication. They are light, flexible, portable and reusable. By nature, pencil traces are quite durable and do not degrade easily. They can be drawn into arbitrary patterns and take on a great variety of form factors. Pencil drawn devices could be useful in resource-limited or emergency situations, and lead to new applications integrating art and electronics such as when combined with origami.
Methods
Pencil-drawn strain gauges
To test the pencil-drawn strain gauge, we drew cantilever-shaped sensors comprised of two rectangular electrodes connected by a U-shaped sensing beam as shown in Figure 3a. The strain sensors were fabricated by cutting office paper (EarthChoice®, 75 g m−2) using scissors. Both the electrodes and the sensing segments were hand-drawn using commercially available studio drawing pencils (Blick®). Static bending tests for Figure 4a and 4b were performed by controllable deflection of the U-shaped sensing element. A small glass slide (18 mm × 18 mm, thickness ~ 0.15 mm) was taped to the back of the cantilever support to ensure the deflection is confined to the beam. Repetitive strains were applied by manually tapping the cantilever beam to a deflection of ~25 mm as shown in Figure 3c and 3d. Resistance changes were monitored using a Keithley 2400 source meter connected to the pencil trace by cables with toothless alligator clips.
Flexible pencil-drawn chemiresistors
The chemiresistor consists of two layers of pencil traces drawn on the paper substrate. The first rectangular layer (10 mm × 16 mm) drawn using a flexible pencil acts as the active sensing element, on top of which a set of interdigitated electrodes (finger width about 0.2 mm and finger separation 2 mm) was drawn using an HB pencil. The use of HB-drawn interdigitated electrodes decreases the initial resistance of the device and increases electrode contact area, making device resistance easier to measure. The device was exposed to different VOC vapors above the corresponding solvents, and the device responses were recorded using a Keithley 4200 Parameter Analyzer.
Author Contributions
C.W.L. designed the strain gauge. C.W.L. and Z.Z. performed the experiments and analyzed the data. J.H. conceived the idea and oversaw the project with help of J.K. All authors wrote the paper, discussed the results, and commented on the manuscript.
Acknowledgments
The authors would like to thank Jiayan Luo for his assistance in obtaining SEM micrographs; Alexander Smith for his help in acquisition and interpretation of EDS spectra; Ching-Hsuan Wu for the Stereomicroscope images; and Yi-Kai Huang and Dr. Kalyan Raidongia for valuable discussions. Financial support was partially provided by NSF through a CAREER award (DMR 0955612, REU supplement for Z.Z.), and the Sony Corporation through a gift donation. J.K. thanks the support from the Ryan Fellowship and the International Institute for Nanotechnology at Northwestern. J.H. was an Alfred P. Sloan Research Fellow and held a fellowship with Northwestern University's Searle Center for Advancing Learning and Teaching during the course of this work.
References
- Russo A. et al. Pen-on-Paper Flexible Electronics. Adv. Mater. 23, 3426–3430 (2011). [DOI] [PubMed] [Google Scholar]
- Mazzeo A. D. et al. Paper-Based, Capacitive Touch Pads. Adv. Mater. 24, 2850–2856 (2012). [DOI] [PubMed] [Google Scholar]
- Martinez A. W., Phillips S. T., Whitesides G. M. & Carrilho E. Diagnostics for the Developing World: Microfluidic Paper-Based Analytical Devices. Anal. Chem. 82, 3–10 (2009). [DOI] [PubMed] [Google Scholar]
- Andersson P. et al. Active Matrix Displays Based on All-Organic Electrochemical Smart Pixels Printed on Paper. Adv. Mater. 14, 1460–1464 (2002). [Google Scholar]
- Tian H. et al. Graphene-on-Paper Sound Source Devices. ACS Nano 5, 4878–4885 (2011). [DOI] [PubMed] [Google Scholar]
- Siegel A. C. et al. Foldable Printed Circuit Boards on Paper Substrates. Adv. Funct. Mater. 20, 28–35 (2010). [Google Scholar]
- Liu X., Mwangi M., Li X., O'Brien M. & Whitesides G. M. Paper-based piezoresistive MEMS sensors. Lab Chip 11, 2189–2196 (2011). [DOI] [PubMed] [Google Scholar]
- Mirica K. A., Weis J. G., Schnorr J. M., Esser B. & Swager T. M. Mechanical Drawing of Gas Sensors on Paper. Angew. Chem. Int. Ed. 51, 10740–10745 (2012). [DOI] [PMC free article] [PubMed] [Google Scholar]
- Johnston J. H., Moraes J. & Borrmann T. Conducting Polymers on Paper Fibres. Synth. Met. 153, 65–68 (2005). [Google Scholar]
- Gwon H. et al. Flexible energy storage devices based on graphene paper. Energy Environ. Sci. 4, 1277–1283 (2011). [Google Scholar]
- Pushparaj V. L. et al. Flexible energy storage devices based on nanocomposite paper. Proc. Natl. Acad. Sci. 104, 13574–13577 (2007). [DOI] [PMC free article] [PubMed] [Google Scholar]
- Nyholm L., Nyström G., Mihranyan A. & Strømme M. Toward Flexible Polymer and Paper-Based Energy Storage Devices. Adv. Mater. 23, 3751–3769 (2011). [DOI] [PubMed] [Google Scholar]
- Hu L., Wu H., La Mantia F., Yang Y. & Cui Y. Thin, Flexible Secondary Li-Ion Paper Batteries. ACS Nano 4, 5843–5848 (2010). [DOI] [PubMed] [Google Scholar]
- Weng Z. et al. Graphene–Cellulose Paper Flexible Supercapacitors. Adv. Energy Mater. 1, 917–922 (2011). [Google Scholar]
- Barr M. C. et al. Direct Monolithic Integration of Organic Photovoltaic Circuits on Unmodified Paper. Adv. Mater. 23, 3500–3505 (2011). [DOI] [PubMed] [Google Scholar]
- Gimenez A. J., Yáñez-Limón J. M. & Seminario J. M. ZnO−Paper Based Photoconductive UV Sensor. J. Phys. Chem. C 115, 282–287 (2010). [Google Scholar]
- Geim A. K. Graphene: Status and Prospects. Science 324, 1530–1534 (2009). [DOI] [PubMed] [Google Scholar]
- Baughman R. H., Zakhidov A. A. & de Heer W. A. Carbon Nanotubes-the Route Toward Applications. Science 297, 787–792 (2002). [DOI] [PubMed] [Google Scholar]
- Sreeprasad T. S. et al. Electron-Tunneling Modulation in Percolating Network of Graphene Quantum Dots: Fabrication, Phenomenological Understanding, and Humidity/Pressure Sensing Applications. Nano Lett. 13, 1757–1763 (2013). [DOI] [PubMed] [Google Scholar]
- Mirica K. A., Azzarelli J. M., Weis J. G., Schnorr J. M. & Swager T. M. Rapid prototyping of carbon-based chemiresistive gas sensors on paper. Proc. Natl. Acad. Sci. 110, E3265–E3270 (2013). [DOI] [PMC free article] [PubMed] [Google Scholar]
- Ren T. L., Tian H., Xie D. & Yang Y. Flexible Graphite-on-Paper Piezoresistive Sensors. Sensors 12, 6685–6694 (2012). [DOI] [PMC free article] [PubMed] [Google Scholar]
- Wang Y. & Zhou H. To draw an air electrode of a Li-air battery by pencil. Energy Environ. Sci. 4, 1704–1707 (2011). [Google Scholar]
- Kurra N., Dutta D. & Kulkarni G. U. Field effect transistors and RC filters from pencil-trace on paper. Phys Chem Chem Phys 15, 8367–8372 (2013). [DOI] [PubMed] [Google Scholar]
- Kurra N. & Kulkarni G. U. Pencil-on-paper: electronic devices. Lab Chip 13, 2866–2873 (2013). [DOI] [PubMed] [Google Scholar]
- ul Hasan K., Nur O. & Willander M. Screen printed ZnO ultraviolet photoconductive sensor on pencil drawn circuitry over paper. Appl. Phys. Lett. 100, 211104 (2012). [Google Scholar]
- Mandal P., Dey R. & Chakraborty S. Electrokinetics with “paper-and-pencil” devices. Lab Chip 12, 4026–4028 (2012). [DOI] [PubMed] [Google Scholar]
- Favier F., Walter E. C., Zach M. P., Benter T. & Penner R. M. Hydrogen Sensors and Switches from Electrodeposited Palladium Mesowire Arrays. Science 293, 2227–2231 (2001). [DOI] [PubMed] [Google Scholar]
- Lonergan M. C. et al. Array-Based Vapor Sensing Using Chemically Sensitive, Carbon Black−Polymer Resistors. Chem. Mater. 8, 2298–2312 (1996). [Google Scholar]
- Doleman B. J., Lonergan M. C., Severin E. J., Vaid T. P. & Lewis N. S. Quantitative Study of the Resolving Power of Arrays of Carbon Black−Polymer Composites in Various Vapor-Sensing Tasks. Anal. Chem. 70, 4177–4190 (1998). [DOI] [PubMed] [Google Scholar]
- Mark J. E. Polymer data handbook. (Oxford University Press, 1999). [Google Scholar]


