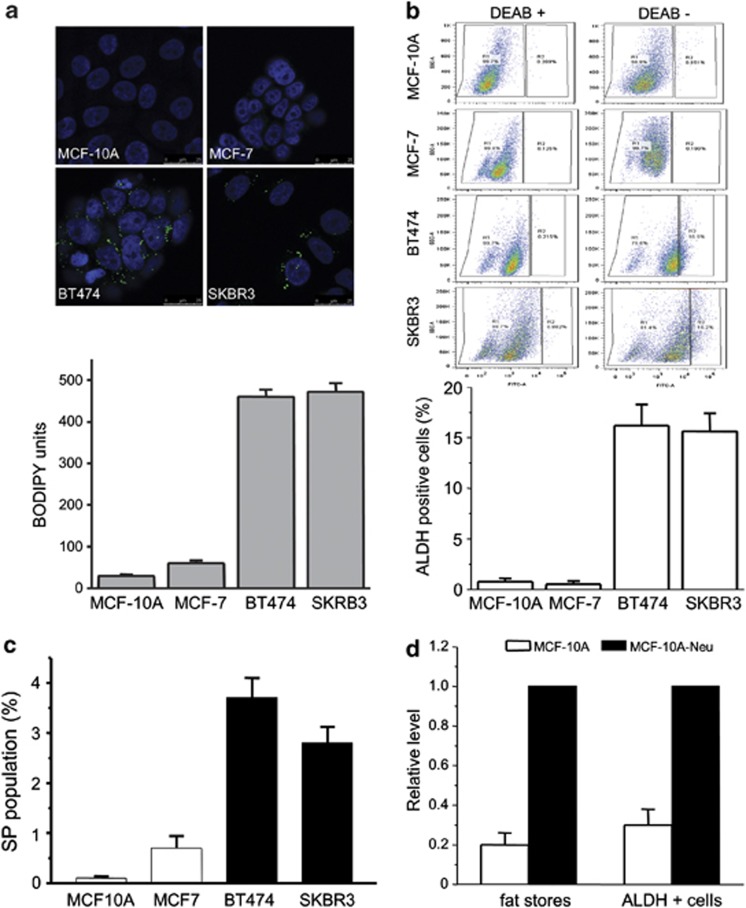
Figure 1.
Increased levels of fats found in ERBB2-positive breast cancer cells correlate with high levels of ALDH-positive cells. (a) Several breast cancer cell lines and normal MCF-10A cells were stained for fat stores with BODIPY 493/503 lipid stain. Hoechst 33342 was used for nuclei staining. Representative BODIPY-stained cell images (upper) and quantification of BODIPY signal (bottom). Error bars indicate the s.d. from three experiments. (b) MCF-10A, MCF-7, BT474 or SKBR3 cells were assayed for ALDH activity utilizing the ALDEFLUOR assay. Cells incubated with ALDEFLUOR substrate (BAAA) and the specific inhibitor of ALDH, diethylaminobenzaldehyde, were used to establish the baseline fluorescence of these cells (R1) and to define the ALDEFLUOR-positive region (R2). Incubation of cells with ALDEFLUOR substrate in the absence of diethylaminobenzaldehyde induces a shift in BAAA fluorescence defining the ALDEFLUOR-positive population. Quantification of ALDH-positive cells in each breast cell line is shown (bottom). Error bars indicate the s.d. from three experiments. (c) FACS for SP cells in MCF10A and breast cancer cell lines. (d) MCF-10A and MCF-10A-neu cells were stained with BODIPY and analyzed with ALDH-positive cell population; quantification of BODIPY staining and ALDH-positive cells is shown.

