Abstract
BACKGROUND/OBJECTIVES:
This paper aims to compare children's thyroid volume (Tvol) by age and gender in Zhejiang province in order to explore the factors influencing Tvol in this area.
SUBJECTS/METHODS:
This survey was a cross-sectional survey of a provincial representative sample of Zhejiang province children aged 6–12 years. The children were asked to provide a urine sample for the determination of urinary iodine concentration (UIC) and thyroid ultrasonography was performed for the determination of Tvol.
RESULTS:
The median (25th, 75th percentile) of UIC in children aged 6–12 years in Zhejiang province was found to be 170.0(111.2, 244.4) μg/l. The median (25th, 75th percentile) of Tvols was found to be 3.1(2.3, 4.2) ml. There were significant differences among the different age groups on BSA (Z=−17.911, P=0.000) and Tvol (Z=−1.996, P=0.046) but not on UIC and body mass index (P>0.05). Tvol was in significant association with BSA (P=0.000) but was not associated with UIC (P>0.05). Age, gender and BSA were significant in multiple linear regression (P<0.05).
CONCLUSIONS:
The median UIC of children aged 6–12 years falls in the optimal iodine status as recommended by WHO/UNICEF/ICCIDD. However, urinary iodine nutritional status had little effect on the Tvol in children aged 6–12 years in Zhejiang province. Age, gender and BSA were the influencing factors of Tvol.
Keywords: thyroid volume, urinary iodine concentration, age, body surface area
Introduction
Thyroid diseases are a common endocrine disease among children and adolescents. Iodine deficiencies were prevalent in China till the introduction of universal salt iodization in 1995. Universal salt iodization has been considered as one among the world's best achievements. In the early 1980s, surveys identified 831 000 individuals with iodine deficiency disorders manifesting as goiter and an additional 134 with typical cretinism in Zhejiang province. Universal salt iodization proved very effective; a provincial survey in 2000 found the virtual elimination of iodine deficiency disorders. The prevention and control of iodine deficiency is a continuous process. It requires monitoring to be sustainable. Urinary iodine concentration (UIC) provides an adequate assessment of a population's iodine nutrition, but it does not allow forming any conclusions regarding the iodine levels of a single individual. In contrast, thyroid volume (Tvol) is an indicator of individual iodine status. Ultrasonographic examination of thyroid provides precise information on Tvol and is now considered the most reliable method of determining Tvol.1, 2 Tvol is correlated with age, gender and body surface area (BSA). However, different authors prefer different influencing factors. Thus, the topic is still a matter of debate. This paper aims to compare children's Tvol by age and gender in Zhejiang province in order to explore the influencing factors of Tvol in this area.
Subjects and methods
Subjects
There are 11 cities under the direct jurisdiction of Zhejiang provincial government, including Hangzhou, Ningbo, Wenzhou, Jiaxing, Huzhou, Shaoxing, Jinhua, Quzhou, Zhoushan, Taizhou and Lishui, under which there are 32 districts, 22 county-level cities and 36 counties. A multistage cluster sampling technique was employed in the present study to obtain children aged 6–12 years of a provincial representative sample of Zhejiang province.
First, 22 counties were selected from 89 counties according to administrative jurisdictions, location, economic level and iodine deficiency disorders surveillance situation. The sampling unit (districts or country-level cities or counties) including 11 sampling units in urban areas and 11 sampling units in rural areas are listed in Supplementary Figure. Then, one primary school was randomly selected from each chosen county. Finally, a class of (more than 30 students) schoolchildren aged 6–12 years from each school was selected. The child's sex and age were recorded. Informed written consent was obtained from parents or guardians of the children.
Measures
First-morning urine samples were collected and delivered to the local Center for Disease Control and Prevention laboratory for measuring UIC. UIC was determined by the modified acid-digestion method.
Height and weight were measured by child health nurses using standardized procedures. Thyroid ultrasonography was performed by a single operator using a 7.5-MHz transducer with the child lying supine and the neck hyperextended. The volume of each lobe was calculated using the formula V (ml)=0.479 × width × length × thickness. The Tvols were the sum of the volumes of the two lobes. BSA as calculated using the formula BSA=weight0.425 (kg) × height0.725 (cm) × 71.84 × 10⁻⁴. Also, we calculated the V/BSA ratio in order to better reflect changes of Tvol.
Statistical analysis
As continuous variables were not normally distributed, they were described as median, 25th and 75th percentiles. The differences among 6–12-year-old children were evaluated by nonparametric test(Kruskal–Wallis H test). In order to compare UIC, body mass index (BMI), BSA and Tvols of 6–9 vs 10–12-year-old children, we divided the children into two age groups (age group 1: 6–9-year-old children; age group 2: 10–12-year-old children). The differences between age groups were evaluated by nonparametric test (Mann–Whitney test). Correlations between Tvols, age and BSA were evaluated by Spearmen's correlation analysis and multiple linear regression analysis as well as curve regression analysis. Data processing and statistical analyses were performed using spss13.0 software. All tests were two-sided and the level of significance set at P<0.05.
Results
Distribution of UIC, BMI, BSA and Tvols (median, 25th, 75th) of children aged 6–12 years
A total of 729 children aged 6–12 years participated in this provincial survey, the median (25th, 75th percentile) of UIC was found to be 170.0(111.2, 244.4) μg/l. The median (25th, 75th percentile) of BSA was found to be 1.1(0.9, 1.2) m2 and that of Tvols was found to be 3.1(2.3, 4.2) ml. UIC, BMI, BSA and Tvols (median, 25th, 75th ) of children aged 6–12 years in this survey are presented by age groups in Table 1.
Table 1. UIC, BMI, BSA and Tvols (median, 25th, 75th ) of children aged 6–12 years in Zhejiang province, China.
| Age groupa | Gender | n |
UIC |
BMI (kg/m2) | BSA (m2) | Tvol (ml) | |||
|---|---|---|---|---|---|---|---|---|---|
| Median (ug/l) | (<100 μg/l (%) | 100–300 μg/l (%) | >300 μg/l) (%) | ||||||
| 1 | Boys | 209 | 174.3 (114.2, 247.8) | 49 (16.9) | 186 (64.1) | 55 (19.0) | 16.1 (14.8, 18.3) | 0.96 (0.87, 1.08)b | 2.69 (2.05, 3.38)b |
| Girls | 207 | 159.0 (110.5, 260.0) | 56 (20.9) | 164 (61.2) | 48 (17.9) | 16.0 (14.7, 18.1)c | 0.97 (0.88, 1.08)c | 2.78 (2.02, 3.42)c | |
| 2 | Boys | 155 | 161.4 (111.2, 234.8) | 41 (17.6) | 147 (63.1) | 45 (19.3) | 17.8 (16.2, 19.9) | 1.22 (1.14, 1.42)b | 3.75 (2.82, 5.04)b |
| Girls | 158 | 175.4 (104.9, 241.5) | 45 (20.5) | 133 (60.5) | 42 (19.1) | 17.1 (15.6, 19.2)c | 1.22 (1.09, 1.36)c | 3.99 (3.05, 5.25)c | |
Abbreviations: BMI, body mass index; BSA, body surface area; Tvol, thyroid volume; UIC, urinary iodine concentration.
(age group 1: 6–9-year-old children; age group 2: 10–12-year-old children).
Boys: age group 1 vs 2 P<0.01.
Girls: age group 1 vs 2 P<0.01.
There were no significant differences among different age groups on UIC and BMI (P>0.05). However, there were significant differences among different age groups on BSA (Z=−17.911, P=0.000) and Tvol (Z=−1.996, P=0.046). BSA and Tvol of age group 2 were higher than that of age group 1 in boys, whereas BMI, BSA and Tvol of age group 2 were higher than that of age group 1 in girls (Table 1).
Associations among UIC, BSA, BMI and Tvol
The Tvol was in significant association with BSA (Spearman rho=0.527, P=0.000), BMI (Spearman rho=0.348, P=0.000), age (Spearman rho=0.460, P=0.000) by Spearman's correlation analysis and the results were presented in Table 2. However, Tvol was not associated with UIC (Spearman rho=0.03, P=0.385).
Table 2. Correlations of UIC, BMI, BSA and Tvol.
| N | Tvol | Spearman rho | P | |
|---|---|---|---|---|
| Total | 863 | BSA | 0.527 | 0.000 |
| BMI | 0.348 | 0.000 | ||
| AGE | 0.460 | 0.000 | ||
| UIC | 0.03 | 0.385 | ||
| Boys | 414 | BSA | 0.518 | 0.000 |
| BMI | 0.364 | 0.000 | ||
| AGE | 0.456 | 0.000 | ||
| UIC | 0.017 | 0.721 | ||
| Girls | 447 | BSA | 0.538 | 0.000 |
| BMI | 0.347 | 0.000 | ||
| AGE | 0.466 | 0.000 | ||
| UIC | 0.043 | 0.382 |
Abbreviations: BMI, body mass index; BSA, body surface area; Tvol, thyroid volume; UIC, urinary iodine concentration.
The V/BSA ratio in girls was higher than that in boys (P=0.032), but there were no significant difference between girls and boys regarding BSA and Tvol (Figures 1 and 2). There were significant differences among 6–12-year-old children on BSA (Kruskal–Wallis test: χ2=424.610, P=0.000) and V/BSA (χ2=30.248, P=0.000). However, there were no significant differences among the different ages on Tvol (χ2=5.910, P=0.433).
Figure 1.

Median BSA, Tvol and V/BSA in 6–12-year-old boys by age (y) in Zhejiang province.
Figure 2.

Median BSA, Tvol and V/BSA in 6–12-year-old girls by age (y) in Zhejiang province.
Multiple linear regression analysis
Age, gender and BSA were significant in the multiple linear regression analysis (P<0.05), whereas UIC and BMI were not significant in the analysis (Table 3).
Table 3. Multiple linear regression for the influencing factors of Tvol.
| Factor | β | t | P |
|---|---|---|---|
| Age (year) | 0.101 | 2.408 | 0.016 |
| Gender (boys/girls) | 0.061 | 1.983 | 0.048 |
| BMI | 0.065 | 1.750 | 0.080 |
| BSA | 0.455 | 9.519 | 0.000 |
| UIC | −0.002 | 0.054 | 0.957 |
Abbreviations: BMI, body mass index; BSA, body surface area; Tvol, thyroid volume; UIC, urinary iodine concentration.
Age-specific and BSA-specific median and P97 value for Tvol
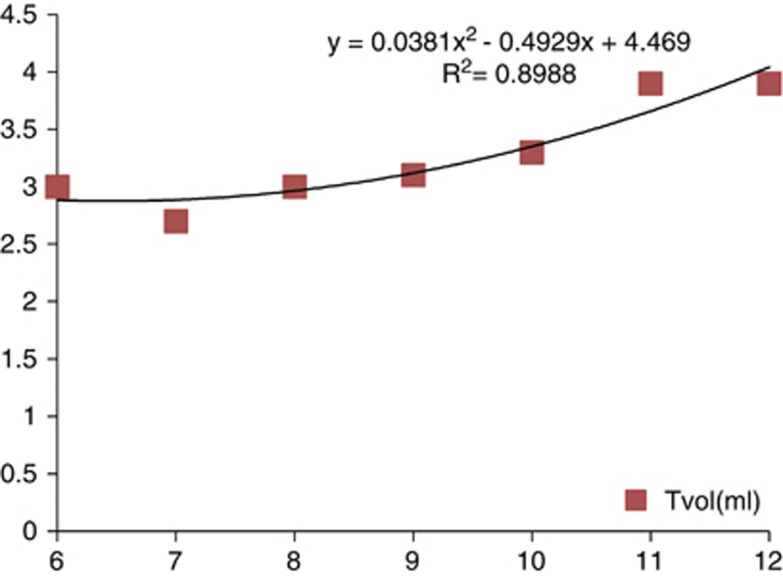
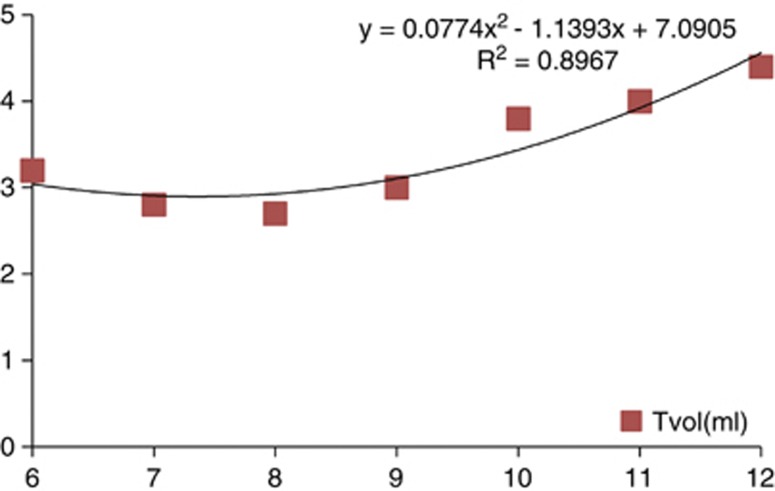
The age-specific median and P97 value for Tvol are listed in Table 4. The goodness of fit (R2) between Tvol and age (Figures 3 and 4) was better in nonlinear regression analysis than in simple linear regression analysis (boys, y=0.0381x2–0.4929x+4.469, R2=0.8988; girls, y=0.0774x2–1.1393x+7.0905, R2=0.8967).
Table 4. Median (50th percentile (P50)) and 97th percentile (p97) values for thyroid volume measured by ultrasound according to sex and age of children aged 6–12 years in Zhejiang province, China.
|
Boys |
Girls |
||||
|---|---|---|---|---|---|
| Age (y) | n (a/b) | p50 (a/b), ml | p97 (a/b) | p50 (a/b), ml | p97 (a/b) |
| 6 | 468/108 | 1.6/2.12 | 2.91/2.55 | 1.57/2.25 | 2.84/3.23 |
| 7 | 561/136 | 1.8/2.66 | 3.29/3.06 | 1.81/2.74 | 3.26/3.25 |
| 8 | 579/141 | 2.03/3.03 | 3.71/3.85 | 2.08/2.68 | 3.76/3.65 |
| 9 | 588/159 | 2.3/3.15 | 4.19/3.83 | 2.4/3.00 | 4.32/3.80 |
| 10 | 528/144 | 2.59/3.45 | 4.73/4.86 | 2.76/3.80 | 4.98/5.07 |
| 11 | 492/154 | 2.92/3.93 | 5.34/4.75 | 3.17/4.08 | 5.73/5.20 |
| 12 | 313/133 | 3.3/3.98 | 6.03/5.85 | 3.65/4.39 | 6.59/5.50 |
Figure 3.
Tvol of 6–12-year-old boys by age (y) in Zhejiang province.
Figure 4.
Tvol of 6–12-year-old girls by age (y) in Zhejiang province.
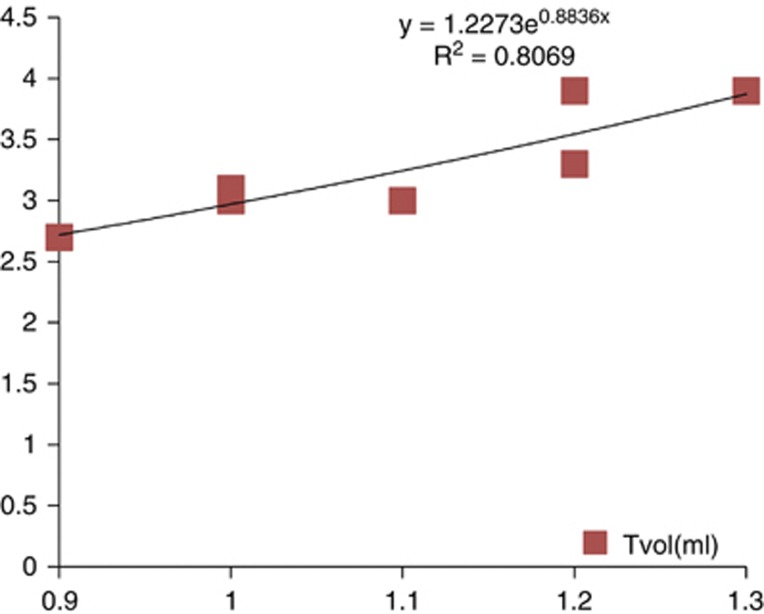
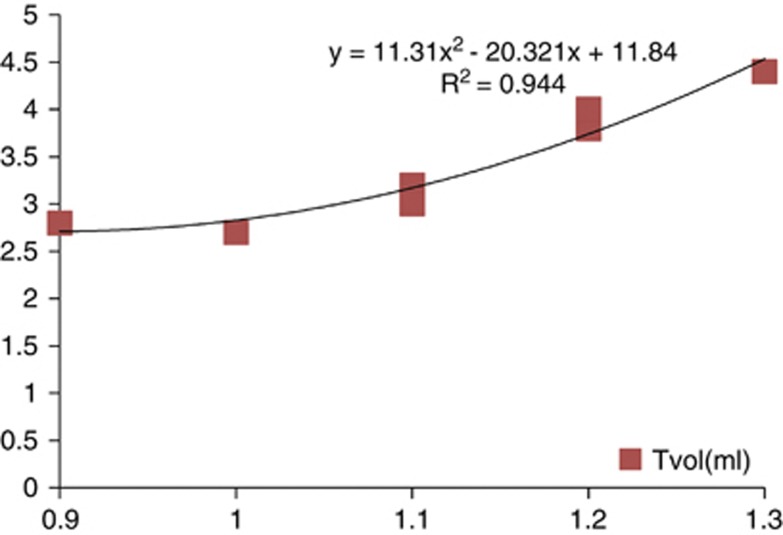
The BSA-specific median and P97 value for Tvol are listed in Table 5. The goodness of fit (R2) between Tvol and age (Figures 5 and 6) was better in nonlinear regression analysis than in simple linear regression analysis (boys, y=1.2273e0.8836xR2=0.8069; girls, y=11.31x2–20.321x+11.84, R2=0.944).
Table 5. Median (50th percentile (P50)) and 97th percentile (p97) values for thyroid volume measured by ultrasound according to sex and body surface area (BSA) of children aged 6–12 years in Zhejiang province, China.
|
Boys |
Girls |
||||
|---|---|---|---|---|---|
| BSA (m2) | n (a/b) | p50(a/b), ml | p97(a/b) | p50(a/b), ml | p97(a/b) |
| 0.7 | 138/50 | 1.47/2.15 | 2.62/2.68 | 1.46/2.04 | 2.56/2.52 |
| 0.8 | 493/113 | 1.66/2.16 | 2.95/2.82 | 1.67/2.53 | 2.91/2.90 |
| 0.9 | 592/160 | 1.86/2.46 | 3.32/3.05 | 1.9/3.11 | 3.32/3.62 |
| 1 | 640/147 | 2.1/3.15 | 3.73/3.93 | 2.17/2.88 | 3.79/3.80 |
| 1.1 | 536/136 | 2.36/3.27 | 4.2/4.36 | 2.47/3.26 | 4.32/4.29 |
| 1.2 | 445/85 | 2.65/3.73 | 4.73/4.92 | 2.82/3.99 | 4.92/5.15 |
| 1.3 | 330/56 | 2.99/3.73 | 5.32/4.92 | 3.21/3.99 | 5.61/5.15 |
| 1.4 | 174/48 | 3.36/4.07 | 5.98/5.70 | 3.66/4.99 | 6.4/5.78 |
| 1.5 | 104/18 | 3.78/6.07 | 6.73/6.54 | 4.17/4.17 | 7.29/6.66 |
| 1.6 | 77/18 | 4.25/5.38 | 7.57/7.00 | 4.76/6.95 | 8.32/8.21 |
Figure 5.
Tvol of 6–12-year-old boys by BSA (ml) in Zhejiang province.
Figure 6.
Tvol of 6–12 year old girls by BSA (ml) in Zhejiang province.
Discussion
UIC is a good marker of the recent dietary intake of iodine. In the present study, the median UIC in children aged 6–12 years was 170 μg/l, with a low proportion of children with UIC <100 μg/l (18.9%) and >300 μg/l (18.8%), indicating optimal iodine intake. Both iodine deficiency and iodine excess can increase Tvol.3 We compared the UIC, BMI, BSA and Tvol of 6–12-year-old children by age and gender. There were no significant differences among different age groups on UIC and BMI. However, there were significant differences among different age groups on BSA and Tvol. Tvol was in significant correlation with age, BSA, BMI, but not with UIC. Through multiple linear regression analysis, age, gender and BSA were found to be the influencing factors of Tvol. These findings suggested that iodine nutritional status had little effect on Tvol. BSA and age may be the predictors of Tvol, and are consistent with the results from the study by Hess and Zimmermann.4
A number of studies based on ultrasonography have also found no difference by sex,5 whereas in the present study, difference on Tvol was found between boys and girls. However, in both genders, the Tvol was best related to BSA, as reported by Hess and Zimmermann,4 and the World Health Organization & International Council for Control of Iodine Deficiency Disorders.6 However, the V/BSA ratio of girls was higher than that of boys (P=0.032). Analysis of V/BSA is useful because it allows us to compare the Tvol in different genders or age groups. There were significant differences among different ages on BSA, Tvol and V/BSA, and it is consistent with other studies.7, 8
Interestingly, as multiple linear regression analysis found age, gender and BSA to be the influencing factors of Tvol, curve regression analyses were carried out to explore the curve equation of ‘Tvol and age model' and ‘Tvol and BSA model' for boys and girls, respectively. We got acceptable R2 in each of the curve regression equations. It can be used to estimate Tvol by age or by BSA when information acquired is limited, and will be a reference for future studies.
Acknowledgments
This study was supported by Zhejiang Province Science and Technology fund (2009C03010-1). The authors declare no conflict of interest. GD, YZ and XL were responsible for the study design. YZ was responsible for data collection and analysis, paper writing and revision. ZM took part in the field investigation and data collection. WZ was in charge of laboratory detection. JZ and GM performed the thyroid measurements by ultrasound.
The authors declare no conflict of interest.
Footnotes
Supplementary Information accompanies this paper on European Journal of Clinical Nutrition website (http://www.nature.com/ejcn)
Supplementary Material
References
- WHO/UNICEF/ICCIDD . Indicators for Assessing Iodine Deficiency. Disorders and their Control Programs through Salt Iodization: WHO: Geneva, Switzerland; 1994. [Google Scholar]
- Brahmbhatt S, Brahmbhatt RM, Boyages SC. Thyroid ultrasound is the best prevalence indicator for assessment of iodine deficiency disorders: a study in rural/tribal schoolchildren from Gujarat (Western India) Eur J Endocrinol. 2000;143:37–46. doi: 10.1530/eje.0.1430037. [DOI] [PubMed] [Google Scholar]
- World Health Organization/United Nations . Children's Fund/International Council for the Control of Iodine Deficiency Disorders. Assessment of iodine deficiency disorders and monitoring their elimination. Agukde for programme managers: WHO: Geneva, Switzerland; 2001. [Google Scholar]
- Hess SY, Zimmermann MB. Thyroid volumes in a national sample of iodine-sufficient Swiss school children: comparison with the World Health Organization/International Council for the control of iodine deficiency disorders normative thyroid volume criteria. Eur J Endocrinol. 2000;142:599–603. doi: 10.1530/eje.0.1420599. [DOI] [PubMed] [Google Scholar]
- Mickuviene N, Krasauskiene A, Kazanavicius G. (The results of thyroid ultrasound examination in randomly selected schoolchildren) Medicina (Kaunas) 2006;42:751–758. [PubMed] [Google Scholar]
- World Health Organization & International Council for Control of Iodine Deficiency Disorders Recommended normative values for thyroid volume in children aged 6–15 years. Bull World Health Organ. 1997;75:95–97. [PMC free article] [PubMed] [Google Scholar]
- Kim BK, Choi YS, Oak CH, Park YH, Kim JH, Park DJ, et al. Determination of thyroid volume by ultrasonography among schoolchildren in Philippines. Int J Endocrinol. 2012;2012:387971. doi: 10.1155/2012/387971. [DOI] [PMC free article] [PubMed] [Google Scholar]
- Kaloumenou I, Alevizaki M, Ladopoulos C, Antoniou A, Duntas LH, Mastorakos G, et al. Thyroid volume and echostructure in schoolchildren living in an iodine-replete area: relation to age, pubertal stage, and body mass index. Thyroid. 2007;17:875–881. doi: 10.1089/thy.2006.0327. [DOI] [PubMed] [Google Scholar]
Associated Data
This section collects any data citations, data availability statements, or supplementary materials included in this article.


