Abstract
Introduction
There is limited information published on switching erythropoiesis-stimulating agent (ESA) treatment for anemia associated with chronic kidney disease (CKD) from darbepoetin alfa (DA) to methoxy polyethylene glycol-epoetin beta (PEG-Epo) outside the protocol of interventional clinical studies. AFFIRM (Aranesp Efficiency Relative to Mircera) was a retrospective, multi-site, observational study designed to estimate the population mean maintenance dose conversion ratio [DCR; dose ratio achieving comparable hemoglobin level (Hb) between two evaluation periods] in European hemodialysis patients whose treatment was switched from DA to PEG-Epo.
Methods
Eligible patients had received hemodialysis for ≥12 months and DA for ≥7 months. Data were collected from 7 months before until 7 months after switching treatment. DCR was calculated for patients with Hb and ESA data available in both evaluation periods (EP; Months 1 and 2 were defined as the pre-switch EP, and Months 6 and 7 as the post-switch EP). Red blood cell transfusions pre- and post-switch were quantified.
Results
Of 302 patients enrolled, 206 had data available for DCR analysis. The geometric mean DCR was 1.17 (95% CI 1.05, 1.29). Regression analysis indicated a non-linear relationship between pre- and post-switch ESA doses; DCR decreased with increasing pre-switch DA dose. The geometric mean weekly ESA doses were 24.1 μg DA in the pre-switch EP and 28.6 μg PEG-Epo in the post-switch EP. Mean Hb was 11.5 g/dL in the pre-switch EP and 11.4 g/dL in the post-switch EP. There were 16 transfusions and 34 units transfused in the pre-switch period, versus 48 transfusions and 95 units transfused post-switch. Excluding patients receiving a transfusion within 90 days of or during either EP, the DCR was 1.21 (95% CI 1.09, 1.35).
Conclusion
In these hemodialysis patients switched from DA to PEG-Epo the DCR was 1.17 and 1.21 after accounting for the effect of transfusions. The number of transfusions and units transfused increased approximately threefold from the pre-switch to the post-switch period.
Keywords: Anemia, Chronic kidney disease, Darbepoetin alfa, Dose conversion, Erythropoiesis-stimulating agent, Hematology, Hemodialysis, Medication switching, Pegylated erythropoietin beta, Retrospective study
Introduction
Anemia of chronic kidney disease (CKD) becomes increasingly prevalent and severe as kidney function declines [1], with over 90% of patients who require renal replacement therapy becoming anemic [2]. In CKD, anemia results primarily from decreased production of endogenous erythropoietin (EPO) by the kidney [3]. The introduction of exogenous erythropoiesis-stimulating agents (ESAs) to clinical practice has transformed the care of patients with CKD, by ameliorating anemia, reducing transfusion requirements, and improving quality of life [4].
Over the last 25 years, several originator and biosimilar ESAs have been introduced for the management of CKD anemia, starting with the first generation short-acting recombinant erythropoietin agents (epoetin alfa and beta) and latterly with two longer-acting molecules, darbepoetin alfa (DA) and methoxy polyethylene glycol-epoetin beta (PEG-Epo), which combine a significantly increased half-life and lower binding affinity for the EPO receptor, allowing them to stimulate erythropoiesis for longer periods and to be administered less frequently [5, 6]. DA, launched in 2001 [5, 7], contains 5 N-linked oligosaccharide chains, rather than the 3 contained in short-acting epoetins, which confer an approximately threefold longer serum half-life and mean residence time, allowing extended inter-dosing intervals [6]. Pharmacokinetic studies have shown that the mean ± SD terminal half-life of DA is 21 ± 7.5 h when administered intravenously (IV) [7]. DA can be administered once a week (QW) or once every 2 weeks (Q2W) to hemodialysis patients. Longer-acting PEG-Epo contains a chemical bond between an amino group present in epoetin beta and methoxy polyethylene glycol (PEG) butanoic acid; the addition of PEG is responsible for an increase in serum half-life of epoetin beta, and in CKD patients on dialysis the terminal half-life of PEG-Epo after IV administration is 134 h [6, 8]. PEG-Epo was approved in 2009 for administration Q2W or once a month (QM) to patients on dialysis [5, 8].
Randomized clinical studies have reported data on switching from DA to PEG-Epo (Stabilizing haemoglobin TaRgets in dialysis following IV C.E.R.A. Treatment for Anaemia [STRIATA] [8] and comPArator sTudy of C.E.R.A. and darbepOetin alfa in patieNts Undergoing dialySis [PATRONUS] [9]); however, there is a lack of published literature on switching in patients receiving routine clinical care (i.e., outside interventional clinical trials). The aims of the Aranesp Efficiency Relative to Mircera (AFFIRM) study were primarily to estimate the maintenance dose conversion ratio (DCR) of PEG-Epo to DA in a population of European hemodialysis patients switched from DA to PEG-Epo and with comparable mean hemoglobin (Hb) in the pre- and post-switch periods, and secondarily to investigate parameters of clinical management of anemia in this group of patients, in real-world clinical practice.
Methods
The AFFIRM study was designed as a retrospective, longitudinal cohort analysis to estimate the DCR in a population of hemodialysis patients achieving comparable Hb after switching from IV DA to IV PEG-Epo in a real-world setting. The study sample comprised adult patients (age ≥18 years) with CKD who received maintenance hemodialysis between January 2008 and August 2011 and whose ESA treatment was switched from IV DA to IV PEG-Epo. As the study was entirely retrospective, ESA switching and dose conversion were performed without reference to a study protocol and there was no protocol-driven intervention in the clinical management of patients. This article does not contain any studies with human or animal subjects performed by any of the authors.
Patients were required to fulfill the following criteria for study entry: switched from treatment with DA to treatment with PEG-Epo at least 7 months before study enrollment; receipt of hemodialysis for at least 12 months prior to switching; receipt of IV DA for at least 7 months immediately prior to switching; receipt of at least 1 dose of PEG-Epo after switching; and provision of informed consent, according to local requirements. Patients were excluded if they had participated in any interventional study within 30 days before the 7-month period preceding the switch or at any subsequent time up to 7 months after the switch.
The enrolling dialysis centers were situated in France, Germany, Spain and the UK, and each was expected to enroll a minimum of 20 patients into the study. There was neither any requirement for a center to have been using DA as their sole long-acting ESA pre-switch, nor for every DA-treated patient to have been switched to PEG-Epo. Dialysis centers were expected to adhere to European Best Practice Guidelines for iron repletion [9].
Data on clinical and laboratory parameters relating to CKD management were abstracted from patient records and entered into an anonymized study-specific central database by study center staff. Data quality and completeness were aided by automatic edit checks built into the database software. Data were also manually reviewed prior to final analysis.
The study comprised a 14-month observation period. Months −7 to −1 constituted the pre-switch period, with switch defined as the date of first administration of PEG-Epo, and Months +1 to +7 constituted the post-switch period. In order to compare stable clinical scenarios for the purposes of DCR calculation, data evaluation periods (EPs) were utilized: Months −2 and −1 were defined as the pre-switch EP and Months +6 and +7 were defined as the post-switch EP.
All patients who fulfilled pre-specified criteria for completeness of Hb and dosing data were included in the DCR analysis: i.e., those who had received DA or PEG-Epo as the only ESA in the 1 month prior to and during the pre- or post-switch EPs, respectively, and who had dosing information and at least 1 Hb value in each of the evaluation periods.
Secondary outcomes included Hb concentrations and ESA use during the study period, and the incidence of red blood cell (RBC) transfusions.
Statistical Methods
The primary outcome (DCR) for each patient was calculated as the mean weekly dose of PEG-Epo during the post-switch EP divided by the mean weekly dose of DA during the pre-switch EP. Due to the skewed nature of the dosing data, mean weekly ESA doses were reported using geometric means; these were derived by calculating the arithmetic mean of the data transformed on the natural logarithmic scale. By definition, the DCR could not be calculated for patients ineligible for the DCR analysis as these did not have the necessary parameters recorded in both EPs.
An additional analysis was performed to explore the effect of transfusions on the DCR, by exclusion of patients with a transfusion within 90 days prior to or during either EP from the analysis.
The relationship between the DA and PEG-Epo doses during the evaluation periods was explored through linear and quadratic regression. A Bland–Altman analysis [10] was also performed to assess the agreement between ESA doses in the evaluation periods.
Hb concentrations were reported as arithmetic means for each month. RBC transfusions were reported in terms of number of transfusions and number of units transfused, using descriptive statistics. Individual patients could contribute multiple transfusions to these analyses. Logistic regression was used to estimate an odds ratio comparing the number of patients receiving an RBC transfusion in the post-switch period relative to their dose ratio at switch (<1 vs. ≥1). The distribution of Hb values reported within the 14 days prior to transfusion was described; if multiple Hb values were recorded, the value closest to the transfusion date was utilized.
The data from this study were analyzed using SAS Statistical Software v9.2 (SAS Institute Inc., Cary, NC, USA).
Results
A total of 302 eligible patients were enrolled at 14 European hemodialysis centers, with 57% of patients enrolled at 10 French sites, 18% at 2 Spanish sites, 17% at 1 UK site, and 8% at 1 German site. Of the 302 patients enrolled, 206 (68%) were included in the DCR analysis. Reasons for exclusion of 96 enrolled patients from the DCR analysis are presented in Fig. 1: 21% of the excluded patients had died or were lost to follow-up during the post-switch period; 45% were no longer receiving PEG-Epo by Months +6 and +7 post-switch; and 34% had no Hb value reported for one or both EPs.
Fig. 1.
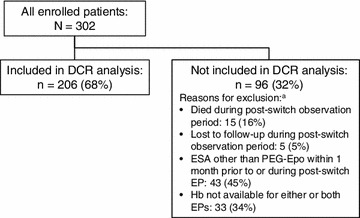
Disposition of patients. aMutually exclusive categories; patients are censored in the following order: first at death post-switch, then at loss to follow-up post-switch, then at receipt of an ESA other than PEG-Epo, and finally lack of an Hb measurement in either or both EPs. DCR geometric mean maintenance dose conversion ratio, EP evaluation period, ESA erythropoiesis-stimulating agent, Hb hemoglobin, PEG-Epo methoxy polyethylene glycol-epoetin beta
The baseline (i.e., at time of switch) demographic and clinical characteristics of enrolled patients and those included in and excluded from the DCR analysis are displayed in Table 1.
Table 1.
Patient characteristics at time of switching
| All enrolled patients | Patients in DCR analysis | Excluded from DCR analysis | |
|---|---|---|---|
| N | 302 | 206 | 96 |
| Patient demographics | |||
| Age (years), mean (SD) | 65 (15) | 62 (15) | 65 (15.5) |
| Gender, male, n (%) | 184 (61) | 127 (62) | 57 (59) |
| Clinical characteristics | |||
| Prior history, n (%) | |||
| Diabetes | 105 (35) | 67 (32) | 38 (40) |
| Cardiovascular disease | 199 (66) | 139 (67) | 60 (62) |
| Primary etiology of kidney disease, n (%) | |||
| Diabetes | 70 (23) | 44 (21) | 26 (27) |
| Glomerular nephropathy | 44 (15) | 38 (18) | 6 (6) |
| Hypertension | 39 (13) | 28 (14) | 11 (12) |
| Interstitial nephropathy | 30 (10) | 18 (9) | 12 (13) |
| Polycystic kidney disease | 14 (5) | 12 (6) | 2 (2) |
| Other/unknown | 105 (34) | 66 (32) | 39 (40) |
| Duration of dialysis (months), median (Q1, Q3) | 42 (24, 73) | 42 (25, 72) | 42 (23, 78) |
| Darbepoetin alfa dose frequency, n (%) | |||
| QW | 192 (64) | 122 (60) | 70 (73) |
| Q2W | 67 (22) | 44 (21) | 23 (24) |
| >Q2W | 43 (14) | 40 (19) | 3 (3) |
| Duration of darbepoetin alfa treatment (months), median (Q1, Q3) | 28 (16, 39) | 25 (15, 37) | 31 (22, 49) |
| Mean weekly darbepoetin alfa dose (μg), geometric mean (95% CI) | 27.7 (25.1, 30.5) | 24.1 (21.3, 27.1) | 37.7 (32.5, 43.6) |
| Hb (g/dL), mean (SD) | 11.5 (1.1) | 11.5 (1.1) | 11.6 (1.3) |
CI confidence interval, DCR dose conversion ratio, Hb hemoglobin, Q1, Q3 interquartile range, Q2W every 2 weeks, QW once weekly
The primary outcome measure, the geometric mean maintenance DCR, was calculated to be 1.17 (95% CI 1.05, 1.29). In an additional analysis performed to assess the sensitivity of this result to the effects of transfusion by excluding those patients who received an RBC transfusion within 90 days prior to or during either evaluation period, the DCR was 1.21 (95% CI 1.09, 1.35).
The regression analysis that examined the relationship between mean weekly ESA doses in the two evaluation periods indicated that the DCR is not linear; a significant (P = 0.008) quadratic term was observed in the regression analysis, indicating that the predicted DCR decreased at higher pre-switch doses of DA (Fig. 2).
Fig. 2.
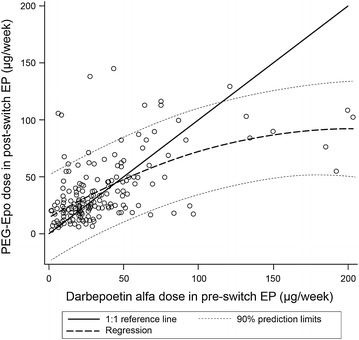
Analysis of relationship between pre- and post-switch erythropoiesis-stimulating agent dose. 1:1 reference line indicates equal PEG-Epo and darbepoetin alfa doses. EP evaluation period, PEG-Epo methoxy polyethylene glycol-epoetin beta
Results of the Bland–Altman analysis investigating the concordance between mean weekly ESA doses in both evaluation periods are presented in Fig. 3. This analysis indicated that the concordance decreased with increasing dose.
Fig. 3.
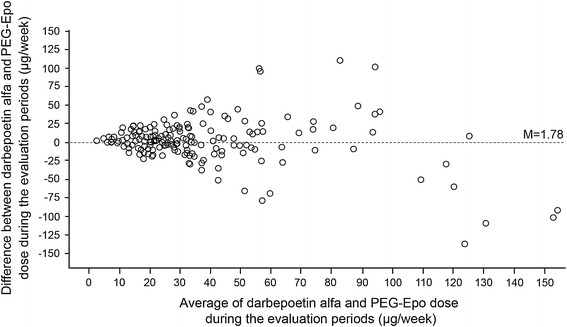
Bland–Altman analysis of agreement between pre- and post-switch erythropoiesis-stimulating agent dose (n = 205). PEG-Epo methoxy polyethylene glycol-epoetin beta
The geometric mean weekly ESA dose for those included in the DCR analysis is shown in Fig. 4. The geometric mean weekly dose of DA was 23.2 μg (95% CI 20.6, 26.3) in the month prior to switch. Geometric mean weekly PEG-Epo dose at Month 1 post-switch was 26.7 μg (95% CI 24.4, 29.3), rising to 29 μg (95% CI 26.2, 32.2) by Month 7 post-switch. In the evaluation periods, the geometric mean weekly DA dose in the pre-switch EP was 24.1 μg (95% CI 21.3, 27.1) while the geometric mean weekly PEG-Epo dose in the post-switch EP was 28.6 μg (95% CI 26.0, 31.5).
Fig. 4.
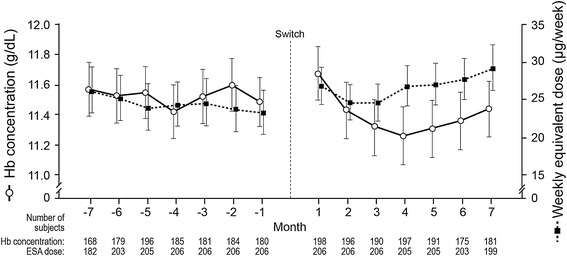
Hemoglobin level and weekly equivalent erythropoiesis-stimulating agent dose during the 14-month observation period. Values are means (arithmetic for hemoglobin, geometric for dose) with 95% confidence intervals. ESA erythropoiesis-stimulating agent, Hb hemoglobin
Figure 4 also displays the mean monthly Hb for those included in the DCR analysis over the study period. The mean (95% CI) monthly Hb immediately prior to switch, in Month 1 post-switch, and in Month 7 post-switch was 11.5 g/dL (11.3, 11.7), 11.7 g/dL (11.5, 11.9), and 11.4 g/dL (11.3, 11.6), respectively.
As shown in Tables 2 and 3, the mean (standard error) monthly Hb remained stable across the observation period, with mean monthly concentration ranging from 11.42 (0.09) g/dL (Month −4) to 11.60 (0.09) g/dL (Month −2) pre-switch, and from 11.26 (0.10) g/dL (Month 4) to 11.67 (0.09) g/dL (Month 1) post-switch.
Table 2.
Hemoglobin concentration by study month for patients with a measurable DCR (N = 206) during the pre-switch observation period
| Hb category, n (%) | Month −7 | Month −6 | Month −5 | Month −4 | Month −3 | Month −2 | Month −1 |
|---|---|---|---|---|---|---|---|
| Mean | 11.57 | 11.52 | 11.54 | 11.42 | 11.52 | 11.60 | 11.48 |
| SE | 0.09 | 0.09 | 0.08 | 0.09 | 0.09 | 0.09 | 0.08 |
| Broad categories | |||||||
| <10 g/dL | 16 (7.8) | 16 (7.8) | 14 (6.8) | 23 (11.2) | 21 (10.2) | 19 (9.2) | 15 (7.3) |
| ≥10 to ≤12 g/dL | 91 (44.2) | 97 (47.1) | 116 (56.3) | 106 (51.5) | 95 (46.1) | 100 (48.5) | 112 (54.4) |
| >12 g/dL | 61 (29.6) | 66 (32.0) | 66 (32.0) | 56 (27.2) | 65 (31.6) | 65 (31.6) | 53 (25.7) |
| Missing | 38 (18.4) | 27 (13.1) | 10 (4.9) | 21 (10.2) | 25 (12.1) | 22 (10.7) | 26 (12.6) |
When multiple assessments were available for a patient, the single assessment closest to center of the interval was used.
DCR geometric mean maintenance dose conversion ratio, Hb hemoglobin
Table 3.
Hemoglobin concentration by study month in the DCR subgroup (N = 206) during the post-switch observation period
| Hb category, n (%) | Month 1 | Month 2 | Month 3 | Month 4 | Month 5 | Month 6 | Month 7 |
|---|---|---|---|---|---|---|---|
| Mean | 11.67 | 11.43 | 11.32 | 11.26 | 11.31 | 11.36 | 11.44 |
| SE | 0.09 | 0.09 | 0.09 | 0.10 | 0.10 | 0.10 | 0.09 |
| Broad categories | |||||||
| <10 g/dL | 21 (10.2) | 29 (14.1) | 29 (14.1) | 32 (15.5) | 28 (13.6) | 20 (9.7) | 20 (9.7) |
| ≥10 to ≤12 g/dL | 100 (48.5) | 103 (50.0) | 106 (51.5) | 111 (53.9) | 109 (52.9) | 102 (49.5) | 99 (48.1) |
| >12 g/dL | 77 (37.4) | 64 (31.1) | 55 (26.7) | 54 (26.2) | 54 (26.2) | 53 (25.7) | 62 (30.1) |
| Missing | 8 (3.9) | 10 (4.9) | 16 (7.8) | 9 (4.4) | 15 (7.3) | 31 (15.0) | 25 (12.1) |
When multiple assessments were available for a patient, the single assessment closest to center of the interval was used.
DCR geometric mean maintenance dose conversion ratio, Hb hemoglobin
Tables 2 and 3 also summarize the proportion of patients in different Hb categories by study month. In the month immediately prior to switch, the proportions of patients who had Hb below 10, 10–12, and above 12 g/dL were 7.3%, 54.4%, and 25.7%, respectively, with 12.6% missing. In the first month after switch, these proportions were 10.2%, 48.5% and 37.4%, respectively. By Month 7 post-switch, the proportions of patients with Hb in these ranges were 9.7%, 48.1%, and 30.1%, respectively.
Concerning RBC transfusions, 36 patients received a transfusion; 7 were transfused in the pre-switch period only, 4 received a transfusion both pre- and post-switch, and 25 had a transfusion in the post-switch period only. There were 16 transfusion events in the pre-switch period and 48 post-switch, with a total of 34 units transfused pre-switch and 95 units in the post-switch period (Fig. 5). Logistic regression analysis showed a higher likelihood of a transfusion during the post-switch period among patients with a dose ratio at switching of <1. Of the 29 patients transfused during the post-switch period, 20 had a dose ratio at switch <1, and 9 had a dose ratio at switch ≥1 (odds ratio 2.39, 95% CI 1.05, 5.44; P = 0.038). The pre-transfusion Hb concentrations were similar for transfusions occurring both pre- and post-switch (Fig. 6); the mean (SD) Hb within 14 days prior to transfusion in these periods was 8.8 (1.41) and 8.3 (1.26), respectively. The majority of patients who were transfused during the pre- and post-switch observation periods had Hb ≤10 g/dL within the 14 days prior to transfusion; only 1 patient during each period had Hb >11 g/dL within the 14-day pre-transfusion interval.
Fig. 5.
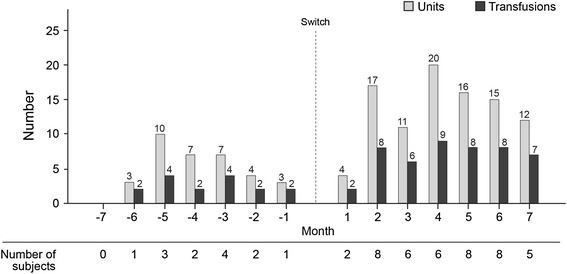
Red blood cell transfusions pre- and post-switch
Fig. 6.
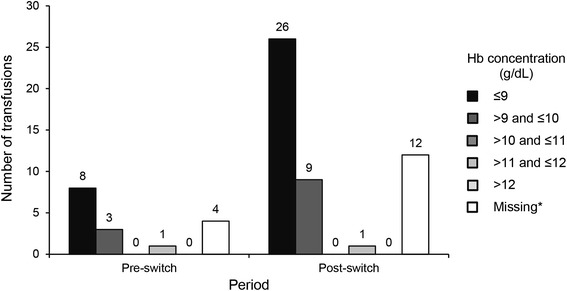
Summary of the last hemoglobin concentrations recorded within 14 days prior to red blood cell transfusions pre- and post-switch. Asterisk Not all transfusions had an associated hemoglobin concentration in the 14-day period before transfusion. Hb hemoglobin
Discussion
This paper presents the findings of a retrospective, multi-center, observational study of hemodialysis patients switched from DA to PEG-Epo for the treatment of anemia. The primary finding of the study is that the DCR of PEG-Epo to DA was 1.17 (95% CI 1.05, 1.29). Accounting for the effect of transfusion, the DCR was 1.21 (95% CI 1.09, 1.35).
The PATRONUS study, in which stable hemodialysis patients receiving IV DA were randomized either to QM PEG-Epo or to Q2W DA for 26 weeks [11], described an increase in post-switch dose requirement. Among patients switched from DA to PEG-Epo, the mean monthly PEG-Epo dose was increased from 159 μg at the switch to 263 μg at Week 26 and 273 μg at Month 11–12 [11]. In contrast, in the STRIATA study where stable hemodialysis patients receiving IV DA were randomized to Q2W PEG-Epo (outside current label guidance) or to continue on DA QW or Q2W, median PEG-Epo doses were described as stable across the 52-week post-switch period, although mean dose data were not reported [12].
AFFIRM demonstrated non-linearity of the dose relationship curve, with DCR decreasing as pre-switch DA dose increased. Further exploration of the relationship between DA and PEG-Epo doses using the Bland–Altman method [10], which circumvents the limitations of the regression method in this type of investigation, indicated that the variability in the dose differences increased as doses increased, while the level of concordance decreased with increasing ESA dose. This was particularly evident in patients whose pre-switch EP weekly DA dose was higher than 100 μg.
Excursions of Hb values above and below the range of 10–12 g/dL [9] were more common in the post-switch compared to the pre-switch period. Fewer than half of the patients achieved Hb in the 10–12 g/dL range by 7 months post-switch.
The number of RBC transfusions and units transfused in the post-switch period was approximately threefold higher compared to the pre-switch period. In particular, the likelihood of a transfusion during the post-switch period was significantly higher in patients with a dose ratio below 1 at switch. The odds ratio for receiving a transfusion was twice as high in patients switched at a dose ratio less than 1 when compared to those switched at 1:1 or higher. The distribution of transfusions (Fig. 5) shows that most transfusions occurred in the first 4 months post-switch. Although the reasons for transfusion were not recorded, the pre-transfusion Hb concentrations within 14 days prior to transfusion remained similar for transfusions occurring both pre- and post-switch. This suggests that the decision to transfuse was consistent with respect to Hb over the observation period (Fig. 6). Reasons for low Hb, e.g., acute intercurrent events such as bleeding, were not reported. There are significant negative consequences associated with increased transfusion requirement in dialysis patients, including production of sensitizing anti-human leukocyte antigen (HLA) antibodies which, despite advances in immunosuppressant therapy [13], may impair or prevent transplantation in patients otherwise eligible for receipt of a kidney graft.
Changes in ESA dosing and number of transfusions post-switch may have important health-economic implications. However, healthcare-resource utilization and cost data were not collected in this study, preventing comparison of these variables between the pre-switch and post-switch periods.
There are limitations in generalizing the findings of this study to the broader hemodialysis population. Firstly, the study sample was drawn largely from a single country (France), which contributed over 70% of the patients and 10 of the 14 study sites. The remaining enrolment was at four sites divided between three other countries. Secondly, the DCR was calculated on a subset of patients which constituted approximately two-thirds of the total enrolled. Patients included in the analysis were less likely to be diabetic (32% vs. 40%), more likely to be receiving DA at a longer dosing interval (60% vs. 73% at QW; 19% vs. 3% less frequently than Q2W), and received a lower geometric mean weekly dose of DA during the pre-switch EP (24.1 vs. 37.7 μg). No test of statistical significance was performed on any of the clinical characteristics. Regardless of possible differences in their clinical characteristics it should be borne in mind that patients were not selected for inclusion in the DCR analysis on the basis of their fulfilling any clinical, Hb or ESA dose requirements: all patients who had Hb measurements in both EPs, a DA dose in the pre-switch EP and a PEG-Epo dose in the post-switch EP were eligible for inclusion.
Conclusion
In conclusion, this study has shown that in a cohort of European hemodialysis patients who converted from DA to PEG-Epo (and who completed 6–7 months’ treatment with PEG-Epo post-conversion), there was an approximately 20% increase in the μg dose required to achieve a comparable Hb profile.
The geometric mean DCR of PEG-Epo to DA was 1.17, rising to 1.21 when the effect of RBC transfusions was taken into account. However, the relationship between the pre- and post-switch ESA doses during the two evaluation periods was non-linear. AFFIRM may therefore help to guide expectations around potential differences in ESA dose requirements when switching hemodialysis patients from DA to PEG-Epo, although the reported mean maintenance DCR is not intended to predict the dose conversion ratio at the individual patient level.
Finally, our study indicates that the risk of transfusion was higher in the post-switch compared with the pre-switch period, with an approximate threefold rise observed in the number of transfusions and units transfused post-switch.
Acknowledgments
This study and the article processing charges were funded by Amgen Europe GmbH, Zug, Switzerland. Publication management support was provided by Caterina Hatzifoti, PhD, of Amgen Europe GmbH. Editorial assistance in the preparation of this manuscript was provided by W. Mark Roberts, PhD, Montreal, Canada. Support for this assistance was funded by Amgen. Dr. Peter Choi is the guarantor for this article, and takes responsibility for the integrity of the work as a whole.
Conflict of interest
Peter Choi, MB BChir, PhD, FRCP (UK), has received lecturing and consulting fees from Amgen, and has participated in advisory boards for Amgen. Mourad Farouk is an employee of Amgen with Amgen stock ownership. Nick Manamley, MSc, is an employee of Amgen with Amgen stock ownership. Janet Addison is an employee of Amgen with Amgen stock options.
Compliance with ethics guidelines
This article does not contain any studies with human or animal subjects performed by any of the authors.
Open Access
This article is distributed under the terms of the Creative Commons Attribution Noncommercial License which permits any noncommercial use, distribution, and reproduction in any medium, provided the original author(s) and the source are credited.
References
- 1.Astor BC, Muntner P, Levin A, Eustace JA, Coresh J. Association of kidney function with anemia: the Third National Health and Nutrition Examination Survey (1988–1994) Arch Intern Med. 2002;162:1401–1408. doi: 10.1001/archinte.162.12.1401. [DOI] [PubMed] [Google Scholar]
- 2.Kazmi WH, Kausz AT, Khan S, et al. Anemia: an early complication of chronic renal insufficiency. Am J Kidney Dis. 2001;38:803–812. doi: 10.1053/ajkd.2001.27699. [DOI] [PubMed] [Google Scholar]
- 3.Eschbach JW, Adamson JW. Anemia of end-stage renal disease (ESRD) Kidney Int. 1985;28:1–5. doi: 10.1038/ki.1985.109. [DOI] [PubMed] [Google Scholar]
- 4.Macdougall IC. Optimizing the use of erythropoietic agents—pharmacokinetic and pharmacodynamic considerations. Nephrol Dial Transplant. 2002;17(Suppl 5):66–70. doi: 10.1093/ndt/17.suppl_5.66. [DOI] [PubMed] [Google Scholar]
- 5.Macdougall IC. New anemia therapies: translating novel strategies from bench to bedside. Am J Kidney Dis. 2012;59:444–451. doi: 10.1053/j.ajkd.2011.11.013. [DOI] [PubMed] [Google Scholar]
- 6.Hörl WH. Differentiating factors between erythropoiesis-stimulating agents: an update to selection for anaemia of chronic kidney disease. Drugs. 2013;73:117–130. doi: 10.1007/s40265-012-0002-2. [DOI] [PubMed] [Google Scholar]
- 7.Aranesp® (darbepoetin alfa) Summary of product characteristics. Amgen Europe B.V., Breda, The Netherlands, 29 August 2013. http://www.ema.europa.eu/docs/en_GB/document_library/EPAR_-_Product_Information/human/000332/WC500026149.pdf. Accessed 18 October 2013.
- 8.Mircera® (methoxy polyethylene glycol-epoetin beta) Summary of product characteristics. Roche Registration Ltd., Welwyn Garden City, UK, 19 June 2012. http://www.ema.europa.eu/docs/en_GB/document_library/EPAR_-_Product_Information/human/000739/WC500033672.pdf. Accessed 18 October 2013.
- 9.Locatelli F, Aljama P, Barany P, et al. Revised European Best Practice Guidelines for the management of anaemia in patients with chronic renal failure. Section III: Treatment of renal anaemia. Nephrol Dial Transplant. 2004;19(Suppl 2):ii16–ii31. doi: 10.1093/ndt/gfh1032. [DOI] [PubMed] [Google Scholar]
- 10.Bland JM, Altman DG. Statistical methods for assessing agreement between two methods of clinical measurement. Lancet. 1986;327:307–310. doi: 10.1016/S0140-6736(86)90837-8. [DOI] [PubMed] [Google Scholar]
- 11.Carrera F, Lok CE, de Francisco A, et al. Maintenance treatment of renal anaemia in haemodialysis patients with methoxy polyethylene glycol-epoetin beta versus darbepoetin alfa administered monthly: a randomized comparative trial. Nephrol Dial Transplant. 2010;25:4009–4017. doi: 10.1093/ndt/gfq305. [DOI] [PMC free article] [PubMed] [Google Scholar]
- 12.Canaud B, Mingardi G, Braun J, et al. Intravenous C.E.R.A. maintains stable haemoglobin levels in patients on dialysis previously treated with darbepoetin alfa: results from STRIATA, a randomized phase III study. Nephrol Dial Transplant. 2008;23:3654–3661. doi: 10.1093/ndt/gfn320. [DOI] [PMC free article] [PubMed] [Google Scholar]
- 13.Macdougall IC, Obrador GT, El Nahas M. How important is transfusion avoidance in 2013? Nephrol Dial Transplant. 2013;28:1092–1099. doi: 10.1093/ndt/gfs575. [DOI] [PubMed] [Google Scholar]


