Abstract
Mammalian cells have two main types of proteasomes, the constitutive proteasome and the immunoproteasome, each containing a distinct set of three catalytic subunits. Recently, additional proteasome subtypes containing a non-standard mixture of catalytic subunits have gained increasing attention, especially due to their presence in cancer settings. However, practical methods for identifying proteasome subtypes have been lacking. Here, we report the development of the first fluorescence resonance energy transfer (FRET)-based strategy that can be utilized to identify different proteasome subtypes present within cells. We have developed FRET donor- and acceptor-probes that are based on previously-reported peptide epoxyketones and selectively target individual proteasome catalytic subunits. Using the purified proteasome and cancer cell lysates, we demonstrate the feasibility of a FRET-based approach for determining the catalytic subunit composition of individual 20S proteasome subtypes. Ultimately, this approach may be utilized to study the functions of individual proteasome subtypes in cells.
Introduction
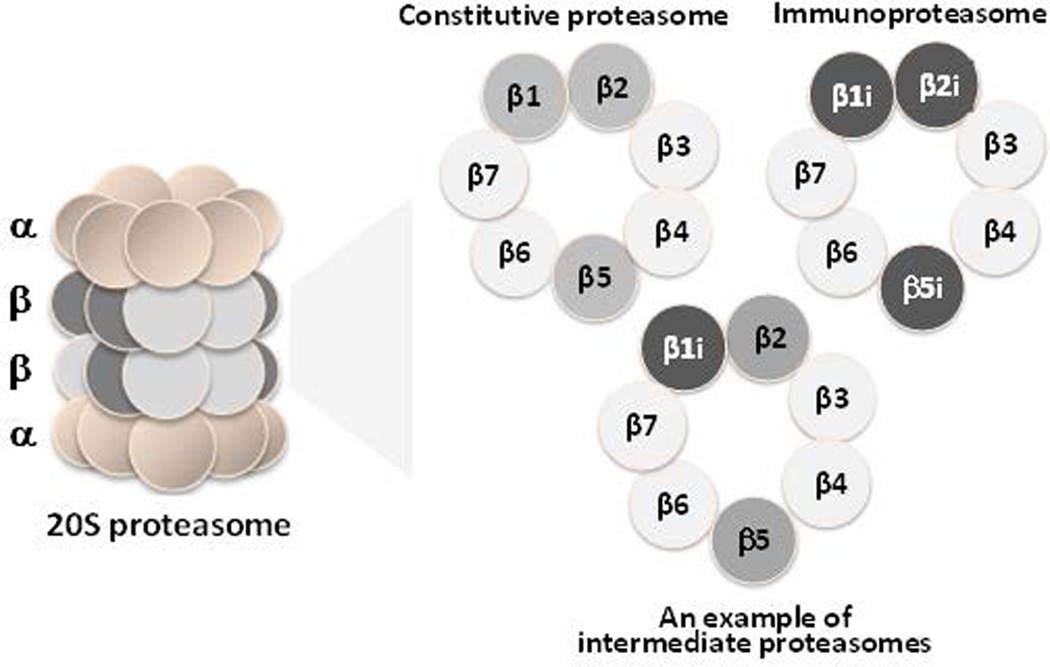
One of the most fundamental processes in all eukaryotic cells is ubiquitin-dependent protein degradation, which maintains cellular protein homeostasis and regulates many important biological processes, such as cell cycle control, cellular differentiation and development, and immune responses.1 The multiprotease complex known as the proteasome is a key player in this pathway. Structurally, the proteasome is composed of four stacked hetero-heptameric rings: two outer α-rings, which serve mainly structural roles, and two inner β-rings, which form a catalytic chamber (Fig. 1).2 Of the seven β-subunits which form each β-ring, three are N-terminal threonine proteases, with active sites which form a catalytic chamber.2, 3
Fig. 1.
Structure of the 20S proteasome. β-Rings of two standard proteasome subtypes, the constitutive proteasome and the immunoproteasome, and an intermediate proteasome.
In mammalian cells, the existence of two proteasome subtypes, the constitutive proteasome and the immunoproteasome, is well recognized. These two subtypes differ by way of their distinct sets of catalytic subunits (Fig. 1). The constitutive proteasome is expressed in all cell types and contains the catalytic subunits β1, β2, and β5, which are shown to preferentially cleave peptide bonds after acidic (Caspase-Like, C-L), basic (Trypsin-Like, T-L), and hydrophobic (Chymotrypsin-Like, CT-L) residues, respectively.4 In contrast, the immunoproteasome is expressed in immune cells and can be induced in other cell types upon exposure to inflammatory cytokines such as interferon-γ (INF-γ) and tumor necrosis factor-α (TNF-α).5 Structurally, the 20S immunoproteasome is identical to the 20S constitutive proteasome, except that the catalytic subunits β1, β2, and β5 are replaced with the inducible catalytic subunits β1i, β2i, and β5i, respectively.
Due to their high degree of homology with constitutive catalytic subunits, the immunosubunits β2i and β5i have proteolytic specificities similar to those of their constitutive counterparts.6 In contrast, the replacement of β1 with β1i alters the gross cleavage specificity of this subunit from C-L to CT-L. This change is thought to promote the generation of peptides which are more suitable for MHC class I binding. Thus, the immunoproteasome has been thought to play important roles in immune responses. Of note, an immunoproteasome variant known as the thymoproteasome, in which the immunoproteasome subunit β5i is replaced by the thymus-specific subunit β5t, has been recently identified.7 The thymoproteasome was shown to be selectively expressed in the thymus, where it has an essential role in the development of CD8+ T cells.7 Despite these important roles in immune responses, recent studies have also shown that functions of immunoproteasomes extend beyond immune responses.5, 8–10
In addition to the above-mentioned standard subtypes of proteasomes, additional subtypes of proteasomes containing mixtures of constitutive and immunoproteasome catalytic subunits have also been recently noted (Fig. 1).11–15 In particular, these subtypes, called intermediate proteasomes, have been often found in cancer cell lines, thus drawing increased interest.16–21 Despite these new developments, much about the functions of intermediate proteasomes remains unknown. A major reason for this is the lack of practical methods for identifying individual proteasome subtypes in cancer cells. Currently available methods, such as immunoblotting with antibodies under denaturing conditions, only reveal the overall expression levels of proteasome subunits, not the catalytic subunit composition of intact 20S proteasomes. Until now, several strategies to identify the subtypes of proteasomes present within cells have been investigated, including sequential subunit depletion,16 comparative western blotting,9, 19, 22 sequential fractionation,11, 12 and isoelectric focusing electrophoresis.23, 24 However, these methods are not practical for determining the identity and functions of intermediate proteasomes in cells.20 Therefore, a need exists for a new strategy to identify individual proteasome subtypes.
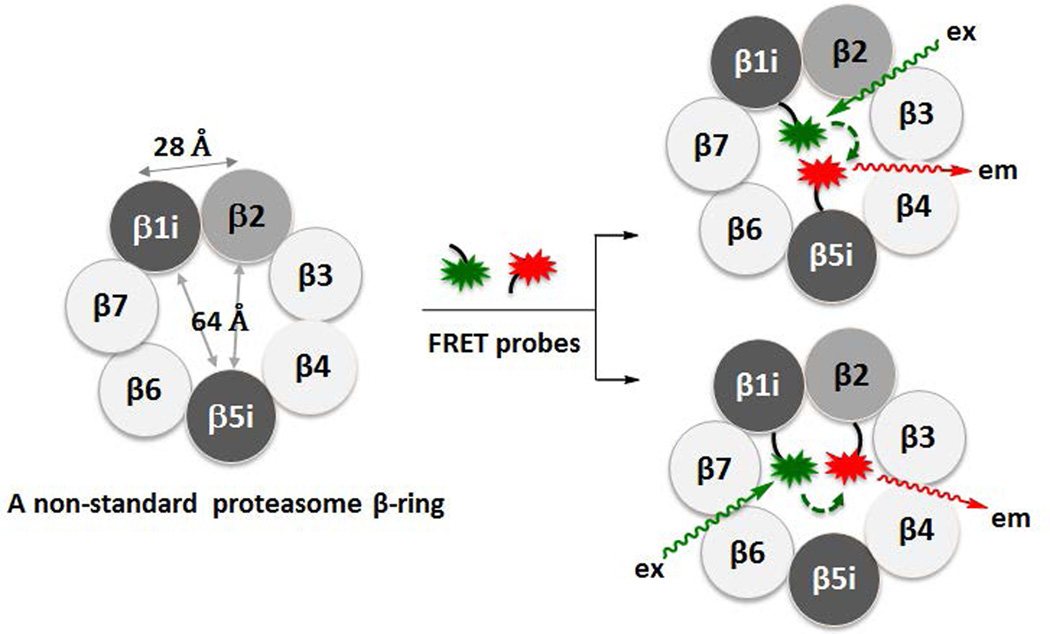
Here, we report our development of the first fluorescence resonance energy transfer (FRET)-based method for use in identifying different proteasome subtypes present within cells. We have developed FRET donors and acceptors conjugated to peptide epoxyketones that selectively target individual proteasome catalytic subunits (Fig. 2). We detected FRET signals from purified constitutive proteasomes as well as cell extracts treated with these FRET probes. Since the distances between catalytic subunits of a single 20S proteasome complex fall within the FRET range (<100Å) (Fig. 2),25–27 the detection of FRET signals from proteasomes following treatment with FRET probes demonstrates the potential of this approach to allow the composition of individual proteasome subtypes to be determined. This strategy will be valuable in dissecting the functions of individual proteasome subtypes in cells.
Fig. 2.
A schematic representation of our FRET-based approach, showing that distances between catalytic subunit active sites within an intermediate 20S proteasome complex are within the FRET range.
Results
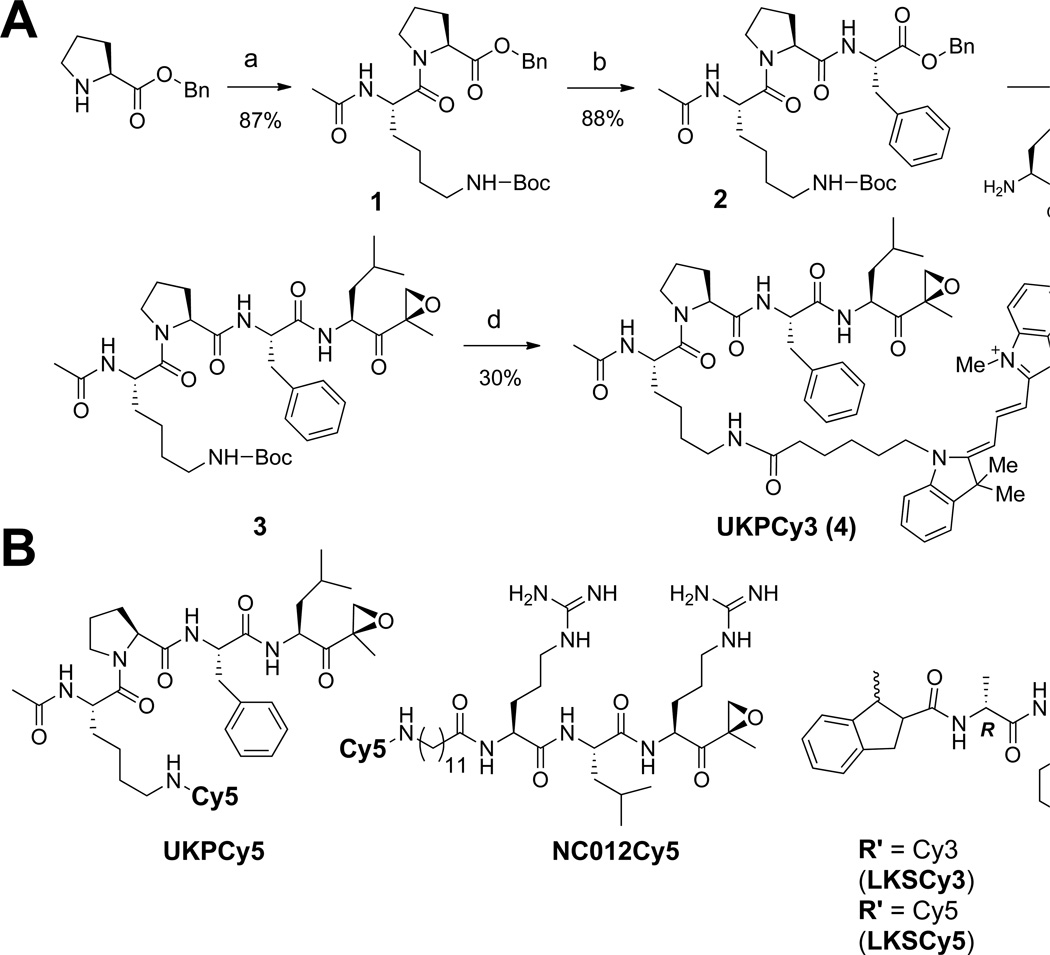
In developing our FRET-based approach, we first sought to develop FRET donor- and acceptor-conjugated probes that selectively target individual proteasome catalytic subunits. For this purpose, we took advantage of the structural features of subunit-selective proteasome inhibitors previously developed for functional studies of individual catalytic subunits by us and others.28–30 In addition, we chose Cy3 and Cy5 as a FRET donor/acceptor pair, since this pair has been successfully used in biological systems.31 Specifically, these fluorophores were attached to modified versions of the epoxyketone inhibitors YU-102, NC012 and IPSI, which have been shown to selectively target β1/β1i, β2/β2i, and β5/β5i, respectively (Fig. 3).28–30, 32 The fluorophore attachment points were determined based on structural information previously obtained from other proteasome inhibitors.32–34 Fig. 3A shows the synthesis of UKPCy3 by utilizing standard solution phase peptide chemistry (see the supporting information for the detailed synthetic procedures for other FRET probes used in this study).
Fig. 3.
Fluorescent probes used for our FRET-based approach. A. Synthetic scheme for the preparation of UKPCy3, which is derived from YU-102, a β1/β1i-selective peptide epoxyketone.30 a. Ac-Lys(Boc)-OH, TBTU, DIPEA, CH2Cl2, rt, 2h; b. 1) H2/Pd, MeOH, rt, 2h, 2) H-Phe-OBn, TBTU, DIPEA, CH2Cl2, rt, 2h; c. 1) H2/Pd, MeOH, rt, 2h, 2) TBTU, DIPEA, CH2Cl2, rt, 2h; d. 1) 20% TFA, CH2Cl2, rt, 15 min, 2) Cy3-NHS ester, TBTU, DIPEA, CH2Cl2, rt, 2h. B. Structures of additional FRET probes. LKSCy3 and LKSCy5 are derived from IPSI that targets β5/β5i.32 NC012Cy5 is derived from NC012, which selectively targets β2/β2i.28.
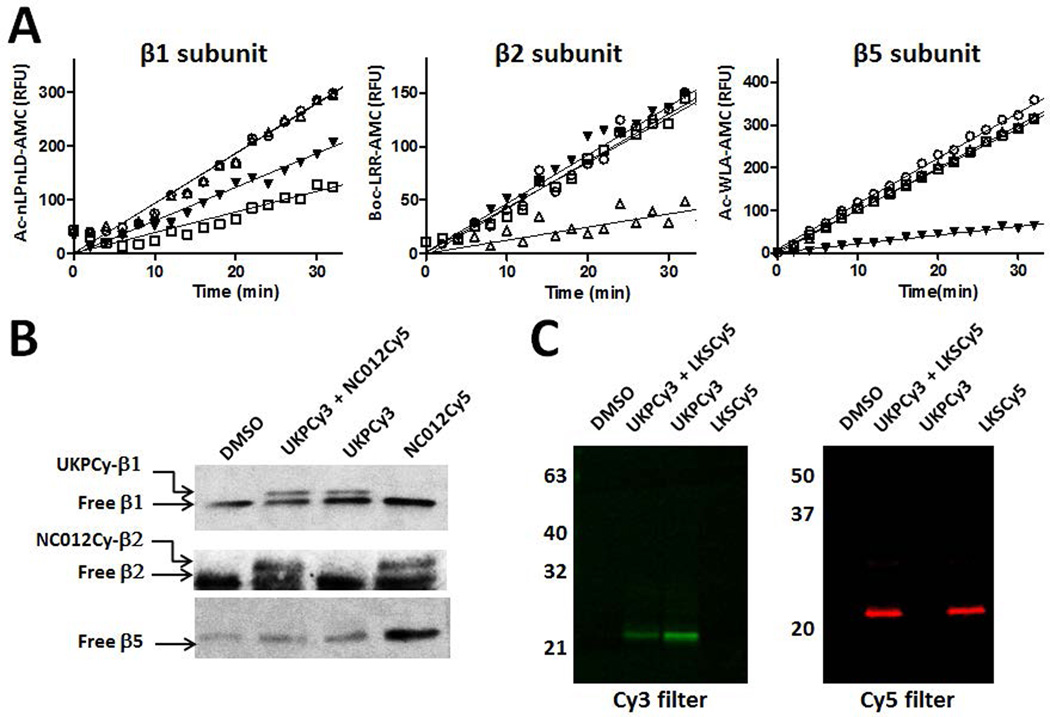
Prior to investigating the utility of these probes in FRET-based studies, we verified their subunit binding selectivity in the context of the purified 20S constitutive proteasome. In proteasome kinetics study, UKPCy3, NC012Cy5 and LKSCy5 displayed high selectivity toward the C-L, T-L (β2) and CT-L (β5) activities, respectively (Fig. 4A). However, western blot analysis of the purified constitutive proteasome treated with UKPCy3 showed that UKPCy3 selectively modifies the β1 subunit (Fig. 4B). Similarly, NC012Cy5 selectively modified the β2 subunit. Next, we investigated whether these probes fluorescently label individual catalytic subunits using in-gel fluorescence assays as previously reported.32, 34, 35 Specifically, following treatment of the constitutive proteasome with the FRET probes UKPCy3 and LKSCy5, we detected protein bands with intense Cy3 and Cy5 fluorescence at ~23 kDa (Fig. 4C), consistent with Cy3 (green)-labeled β1 and Cy5 (red)-labeled β5, respectively. Taken together, these results clearly demonstrate the selectivity of UKPCy3/Cy5, NC012Cy5 and LKSCy3/Cy5 toward β1, β2, and β5, respectively.
Fig. 4.
Subunit selectivity of FRET probes. A. Kinetics data showing that UKPCy5 (0.1 µM) (□), NC012Cy5 (0.1 µM) (△) and LKSCy5 (0.05 µM) (▼) selectively inhibit the C-L (β1), T-L (β2) and CT-L (β5) activities of the purified 20S constitutive proteasome, respectively. DMSO-treated control (○) B. Selective modification of β1 and β2 subunits by UKPCy3 and NC012Cy5, respectively. The purified constitutive proteasome was incubated with UKPCy3 (10 µM) or NC012Cy5 (10 µM) alone or in combination for 1 hr and subjected to SDS-PAGE followed by immunoblotting with respective antibodies. C. The purified 20S constitutive proteasome was incubated with UKPCy3 (10 µM) or LKSCy5 (10 µM) under similar conditions as described in B and the proteasome samples were analyzed by in-gel fluorescence After SDS-PAGE, FRET probe-labeled subunits were visualized following excitation at 532 nm (for Cy3) and 635 nm (for Cy5).
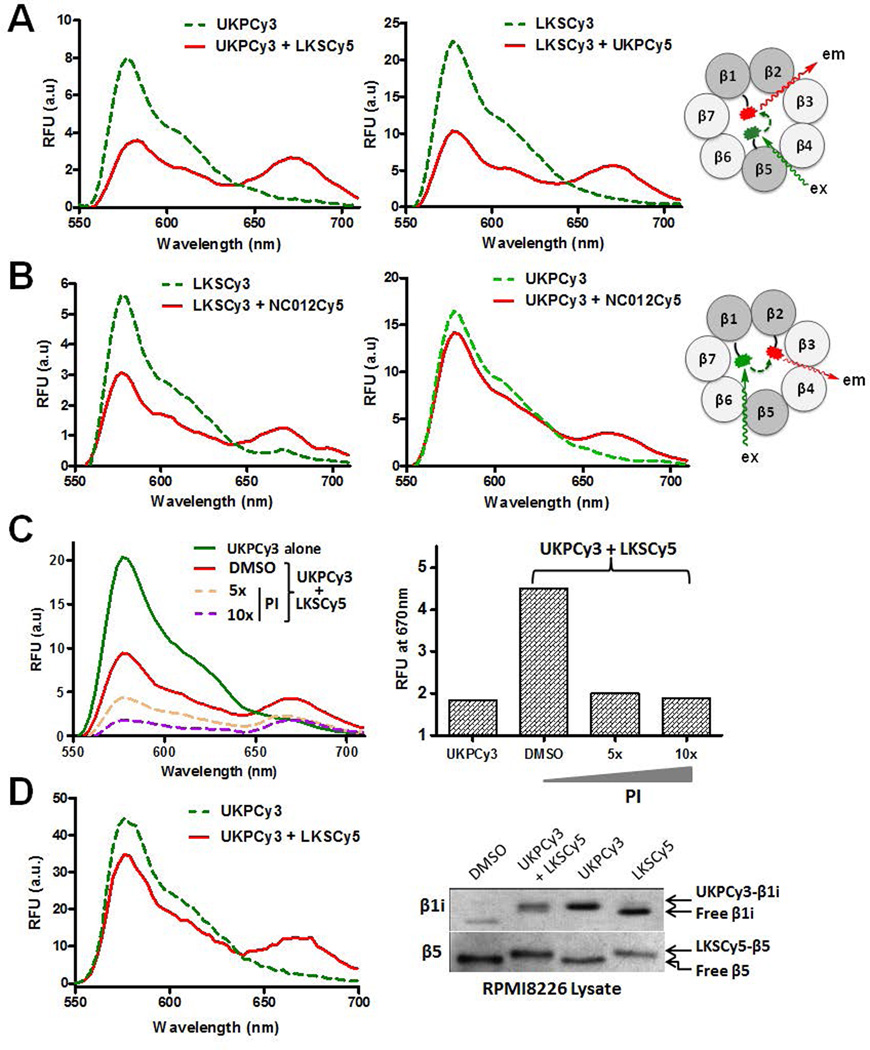
With these selective probes in hand, we assessed the feasibility of our FRET-based approach using purified constitutive proteasome as a proof of concept. First, we incubated the purified constitutive proteasome with the β1-targeting UKPCy3 and β5-targeting LKSCy5 FRET pair. Unbound probe was removed by ultrafiltration, and UKPCy3 was then excited at a wavelength of 540 nm. Compared to samples treated with UKPCy3 alone, samples treated with both UKPCy3 and LKSCy5 displayed decreased donor emission at 570 nm and increased acceptor emission at 670 nm, indicating the occurrence of donor-acceptor energy transfer (i.e. FRET) within 20S proteasome complexes (Fig. 5A). This is supported by the very weak Cy5 fluorescence following excitation at 540 nm in samples treated with LKSCy5 alone (Suppl. Fig. 1).
Fig. 5.
FRET signals detected from the purified constitute proteasome (A–C) treated with FRET pairs: A. UKPCy3:LKSCy5 (left) and LKSCy3:UKPCy5 (right); B. LKSCy3:NC012Cy5 (left) and UKPCy3:NC012Cy5 (right). C. FRET signals were attenuated by co-treatment with an excess of non-fluorescent proteasome inhibitors (PI). RFU: Relative fluorescence units. D. FRET signals detected from RPMI multiple myeloma cell lysates treated with UKPCy3:LKSCy5 pair (Left). When UKPCy3 was co-incubated with LKSCy5 in RPMI8226 cell lysates, UKPCy3 selectively labeled β1i, whereas LKSCy5 selectively labeled β5.
FRET efficiency (E) was calculated based on the equation E = 1− FDA/FD, where FDA and FD are the Cy3 fluorescence intensity with and without Cy5, respectively. The calculated FRET efficiency was 0.55 for the UKPCy3 and LKSCy5 pair (Fig. 5A). Similar FRET efficiency (E = 0.55) was observed when Cy3 and Cy5 fluorophores were swapped between UKPCy3 and LKSCy5 (Fig. 5A). We also detected significant FRET signals (E = 0.45) from the proteasome samples treated with the β5-targeting LKSCy3 and β2-targeting NC012Cy5 FRET pair (Fig. 5B).
On the other hand, when the proteasome was incubated with the β1-targeting UKPCy3 and β2-targeting NC012Cy5 FRET pair, the observed FRET efficiency was relatively low (E = 0.18) (Fig. 5B). The lower FRET efficiency of this β1:β2-targeting pair compared to the β1:β5- and β2:β5-targeting FRET pairs may be ascribed to either a reduction in the dipole orientation factor or to an increased distance between the donor and acceptor fluorophores when these probes are bound to the active sites of the β1 and β2 subunits, respectively. In order to verify that the FRET signals were specifically derived from the FRET probes bound to proteasome active sites, we performed a competition assay using non-fluorescent proteasome inhibitors. As shown in Fig. 5C, fluorescence intensities at 570 nm and 670 nm were gradually attenuated by increasing concentrations of non-fluorescent proteasome inhibitors, indicating that the FRET signal is derived from proteasome active site-bound FRET probes.
These results clearly confirm that the constitutive proteasome catalytic subunits β1, β2, and β5 lie in close proximity to one another (<100 Å),25 thereby allowing FRET signals to be generated following treatment with donor-acceptor probes. To determine whether the determination of catalytic subunit composition in 20S proteasomes within cancer cells, we incubated RPMI8266 cell lysates with a FRET pair (UKPCy3:LKSCy5). Remarkably, we detected significant FRET signals (E = 0.25), demonstrating that RPMI8266 cells contain intermediate proteasomes composed of the immunoproteasome subunit β1i and the constitutive subunit β5.
Discussion
Despite the clear evidence of supporting the presence of intermediate proteasomes, the roles of these additional types of proteasomes in cancer cells are currently unknown. To investigate the functions of these intermediate proteasomes, it is critical to develop a strategy for the determination of proteasome subtypes. In this report, we have demonstrated the feasibility of a FRET-based strategy for determining the catalytic subunit composition of intact 20S proteasome complexes in cancer cells. FRET probes used in this study are selective toward proteasomes, as they are based on peptide epoxyketone backbones, which are well-known for their proteasome specificity.36 Therefore, the FRET-based strategy described here can be applied for the identification of individual proteasome subtypes present in cells. Ultimately, we expect that this study will lead to new insights into the functions and regulation of intermediate proteasomes.
Experimental Section
See the Supporting Information for full synthetic information.
FRET measurement
FRET probes (10 µM) were added to a buffer solution containing 2 µg of rabbit purified 20S constitutive proteasome (Boston Biochem). After incubation of the reaction mixture at room temperature for 1hr, excess FRET probes were removed using a Nanosep centrifugal device (300K Device, Pall Life Sciences). The recovered proteasome samples from the filter device were redissolved in 50 µL of 20S assay buffer (20 mM Tris/Cl pH 8.0, 0.5 mM EDTA, and 0.035 % SDS), and the fluorescence spectra were obtained after excitation at 540 nm using a fluorescence microplate reader (SpectraMax M5).
Enzyme kinetics
Purified 20S human constitutive proteasome and immunoproteasome (R&D Systems) was used to assess the in vitro inhibition of proteasome catalytic activities by FRET probes. Briefly, reactions were setup in a 100 µL total volume in a 96-well format. 20S proteasomes at 0.5 µg/mL in assay buffer (20 mM Tris-HCl, 0.5 mM EDTA, 0.035% SDS except when using Boc-LRR-AMC) were mixed with FRET probes and substrates. The rate of substrate hydrolysis was measured by monitoring the fluorescence of liberated AMC (7-amino-4-methylcoumarin) over a period of 90 minutes once per minute at room temperature. AMC fluorescence was measured using excitation and emission wavelengths of 360 and 460 nm on a SpectraMax M5 fluorescence plate reader (Molecular Devices). The following substrates and concentrations were used: For β1 activity, 100 µM Ac-nLPnLD-AMC, for β2 and β2i activity, 200 µM Boc-LRR-AMC, β5 activity, 20 µM Ac-WLA-AMC, for β1i activity, 100 µM Ac-PAL-AMC, for β5i activity, 100 µM Ac-ANW-AMC.
In-gel fluorescence and immunoblotting assays
In-gel fluorescence and western blotting assays were performed by procedures similar to those previously reported by us.32, 34.
Supplementary Material
Acknowledgements
This work is supported by the National Institutes of Health for financial support of this work through Grant R01 CA128903 (KBK) and R15 CA156601 (WL).
Footnotes
Electronic Supplementary Information (ESI) available: [details of any supplementary information available should be included here]. See DOI: 10.1039/b000000x/
References
- 1.Ciechanover A, Schwartz AL. Proc Natl Acad Sci U S A. 1998;95:2727–2730. doi: 10.1073/pnas.95.6.2727. [DOI] [PMC free article] [PubMed] [Google Scholar]
- 2.Marques AJ, Palanimurugan R, Matias AC, Ramos PC, Dohmen RJ. Chem Rev. 2009;109:1509–1536. doi: 10.1021/cr8004857. [DOI] [PubMed] [Google Scholar]
- 3.Saeki Y, Tanaka K. Methods Mol Biol. 2012;832:315–337. doi: 10.1007/978-1-61779-474-2_22. [DOI] [PubMed] [Google Scholar]
- 4.Dick TP, Nussbaum AK, Deeg M, Heinemeyer W, Groll M, Schirle M, Keilholz W, Stevanovic S, Wolf DH, Huber R, Rammensee HG, Schild H. J Biol Chem. 1998;273:25637–25646. doi: 10.1074/jbc.273.40.25637. [DOI] [PubMed] [Google Scholar]
- 5.Angeles A, Fung G, Luo H. Front Biosci. 2012;17:1904–1916. doi: 10.2741/4027. [DOI] [PubMed] [Google Scholar]
- 6.Huber EM, Basler M, Schwab R, Heinemeyer W, Kirk CJ, Groettrup M, Groll M. Cell. 2012;148:727–738. doi: 10.1016/j.cell.2011.12.030. [DOI] [PubMed] [Google Scholar]
- 7.Murata S, Sasaki K, Kishimoto T, Niwa S, Hayashi H, Takahama Y, Tanaka K. Science. 2007;316:1349–1353. doi: 10.1126/science.1141915. [DOI] [PubMed] [Google Scholar]
- 8.Atkinson SP, Collin J, Irina N, Anyfantis G, Kyung BK, Lako M, Armstrong L. Stem cells. 2012;30:1373–1384. doi: 10.1002/stem.1113. [DOI] [PubMed] [Google Scholar]
- 9.Hensley SE, Zanker D, Dolan BP, David A, Hickman HD, Embry AC, Skon CN, Grebe KM, Griffin TA, Chen W, Bennink JR, Yewdell JW. J Immunol. 2010;184:4115–4122. doi: 10.4049/jimmunol.0903003. [DOI] [PMC free article] [PubMed] [Google Scholar]
- 10.Seifert U, Bialy LP, Ebstein F, Bech-Otschir D, Voigt A, Schroter F, Prozorovski T, Lange N, Steffen J, Rieger M, Kuckelkorn U, Aktas O, Kloetzel PM, Kruger E. Cell. 2010;142:613–624. doi: 10.1016/j.cell.2010.07.036. [DOI] [PubMed] [Google Scholar]
- 11.Dahlmann B, Ruppert T, Kloetzel PM, Kuehn L. Biochimie. 2001;83:295–299. doi: 10.1016/s0300-9084(01)01240-8. [DOI] [PubMed] [Google Scholar]
- 12.Dahlmann B, Ruppert T, Kuehn L, Merforth S, Kloetzel PM. J Mol Biol. 2000;303:643–653. doi: 10.1006/jmbi.2000.4185. [DOI] [PubMed] [Google Scholar]
- 13.Klare N, Seeger M, Janek K, Jungblut PR, Dahlmann B. J Mol Biol. 2007;373:1–10. doi: 10.1016/j.jmb.2007.07.038. [DOI] [PubMed] [Google Scholar]
- 14.Vigneron N, Van den Eynde BJ. Curr Opin Immunol. 2012;24:84–91. doi: 10.1016/j.coi.2011.12.002. [DOI] [PubMed] [Google Scholar]
- 15.Sixt SU, Alami R, Hakenbeck J, Adamzik M, Kloss A, Costabel U, Jungblut PR, Dahlmann B, Peters J. Mediators of inflammation. 2012;2012:204250. doi: 10.1155/2012/204250. [DOI] [PMC free article] [PubMed] [Google Scholar]
- 16.Guillaume B, Chapiro J, Stroobant V, Colau D, Van Holle B, Parvizi G, Bousquet-Dubouch MP, Theate I, Parmentier N, Van den Eynde BJ. Proc Natl Acad Sci U S A. 2010;107:18599–18604. doi: 10.1073/pnas.1009778107. [DOI] [PMC free article] [PubMed] [Google Scholar]
- 17.Yuan F, Ma Y, You P, Lin W, Lu H, Yu Y, Wang X, Jiang J, Yang P, Ma Q, Tao T. Bioscience reports. 2013;33 doi: 10.1042/BSR20130013. [DOI] [PMC free article] [PubMed] [Google Scholar]
- 18.Gohlke S, Mishto M, Textoris-Taube K, Keller C, Giannini C, Vasuri F, Capizzi E, D'Errico-Grigioni A, Kloetzel PM, Dahlmann B. Age. 2013 doi: 10.1007/s11357-013-9543-x. [DOI] [PMC free article] [PubMed] [Google Scholar]
- 19.Zheng J, Dasgupta A, Bizzozero OA. J Neurochem. 2012;121:486–494. doi: 10.1111/j.1471-4159.2012.07699.x. [DOI] [PMC free article] [PubMed] [Google Scholar]
- 20.Bousquet-Dubouch MP, Fabre B, Monsarrat B, Burlet-Schiltz O. Expert Rev Proteomics. 2011;8:459–481. doi: 10.1586/epr.11.41. [DOI] [PubMed] [Google Scholar]
- 21.Kloss A, Meiners S, Ludwig A, Dahlmann B. Cardiovascular research. 2010;85:367–375. doi: 10.1093/cvr/cvp217. [DOI] [PubMed] [Google Scholar]
- 22.Zanker D, Waithman J, Yewdell JW, Chen W. J Immunol. 2013;191:52–59. doi: 10.4049/jimmunol.1300802. [DOI] [PMC free article] [PubMed] [Google Scholar]
- 23.Drews O, Wildgruber R, Zong C, Sukop U, Nissum M, Weber G, Gomes AV, Ping P. Mol Cell Proteomics. 2007;6:2021–2031. doi: 10.1074/mcp.M700187-MCP200. [DOI] [PubMed] [Google Scholar]
- 24.Wang X, Zhao Z, Luo Y, Chen G, Li Z. Proteomics Clin Appl. 2011;5:484–492. doi: 10.1002/prca.201000149. [DOI] [PubMed] [Google Scholar]
- 25.Borissenko L, Groll M. Chem Rev. 2007;107:687–717. doi: 10.1021/cr0502504. [DOI] [PubMed] [Google Scholar]
- 26.Lorenz M, Diekmann S. Methods Mol Biol. 2006;335:243–255. doi: 10.1385/1-59745-069-3:243. [DOI] [PubMed] [Google Scholar]
- 27.Groll M, Heinemeyer W, Jager S, Ullrich T, Bochtler M, Wolf DH, Huber R. Proc Natl Acad Sci U S A. 1999;96:10976–10983. doi: 10.1073/pnas.96.20.10976. [DOI] [PMC free article] [PubMed] [Google Scholar]
- 28.Mirabella AC, Pletnev AA, Downey SL, Florea BI, Shabaneh TB, Britton M, Verdoes M, Filippov DV, Overkleeft HS, Kisselev AF. Chem Biol. 2011;18:608–618. doi: 10.1016/j.chembiol.2011.02.015. [DOI] [PMC free article] [PubMed] [Google Scholar]
- 29.Parlati F, Lee SJ, Aujay M, Suzuki E, Levitsky K, Lorens JB, Micklem DR, Ruurs P, Sylvain C, Lu Y, Shenk KD, Bennett MK. Blood. 2009;114:3439–3447. doi: 10.1182/blood-2009-05-223677. [DOI] [PubMed] [Google Scholar]
- 30.Myung J, Kim KB, Lindsten K, Dantuma NP, Crews CM. Mol Cell. 2001;7:411–420. doi: 10.1016/s1097-2765(01)00188-5. [DOI] [PubMed] [Google Scholar]
- 31.Kenworthy AK. Methods. 2001;24:289–296. doi: 10.1006/meth.2001.1189. [DOI] [PubMed] [Google Scholar]
- 32.Sharma LK, Lee NR, Jang ER, Lei B, Zhan CG, Lee W, Kim KB. Chembiochem. 2012;13:1899–1903. doi: 10.1002/cbic.201200307. [DOI] [PMC free article] [PubMed] [Google Scholar]
- 33.Lei B, Abdul Hameed MD, Hamza A, Wehenkel M, Muzyka JL, Yao XJ, Kim KB, Zhan CG. The journal of physical chemistry. B. 2010;114:12333–12339. doi: 10.1021/jp1058098. [DOI] [PMC free article] [PubMed] [Google Scholar]
- 34.Carmony KC, Kim KB. Cell biochemistry and biophysics. 2013;67:91–101. doi: 10.1007/s12013-013-9626-4. [DOI] [PMC free article] [PubMed] [Google Scholar]
- 35.Carmony KC, Lee DM, Wu Y, Lee NR, Wehenkel M, Lee J, Lei B, Zhan CG, Kim KB. Bioorg Med Chem. 2012;20:607–613. doi: 10.1016/j.bmc.2011.06.039. [DOI] [PMC free article] [PubMed] [Google Scholar]
- 36.Groll M, Kim KB, Kairies N, Huber R, Crews CM. J. Am. Chem. Soc. 2000;122:1237–1238. [Google Scholar]
Associated Data
This section collects any data citations, data availability statements, or supplementary materials included in this article.


