

Abstract
The brain contains multiple yet distinct systems involved in reward prediction. To understand the nature of these processes, we recorded single-unit activity from the lateral prefrontal cortex (LPFC) and the striatum in monkeys performing a reward inference task using an asymmetric reward schedule. We found that neurons both in the LPFC and in the striatum predicted reward values for stimuli that had been previously well experienced with set reward quantities in the asymmetric reward task. Importantly, these LPFC neurons could predict the reward value of a stimulus using transitive inference even when the monkeys had not yet learned the stimulus–reward association directly; whereas these striatal neurons did not show such an ability. Nevertheless, because there were two set amounts of reward (large and small), the selected striatal neurons were able to exclusively infer the reward value (e.g., large) of one novel stimulus from a pair after directly experiencing the alternative stimulus with the other reward value (e.g., small). Our results suggest that although neurons that predict reward value for old stimuli in the LPFC could also do so for new stimuli via transitive inference, those in the striatum could only predict reward for new stimuli via exclusive inference. Moreover, the striatum showed more complex functions than was surmised previously for model-free learning.
Keywords: inference, model-based learning, model-free learning, prefrontal cortex, reward, striatum
Introduction
A fundamental question in animal cognition is how animals deal with inconsistent and incomplete information that they often encounter in their ever-changing environments. One theory is that animals learn every piece of information they encounter, but this would not be very efficient. Alternatively, animals might be able to use inferential reasoning when dealing with fragmentary information to associate a visible stimulus with a future event, without learning their interrelationships directly. Behavioral studies have already demonstrated various types of inference in nonhuman animals, such as transitive inference (Bunsey and Eichenbaum, 1996; McGonigle and Chalmers, 1977), causal reasoning (Blaisdell et al., 2006; Hauser and Spaulding, 2006), and exclusive inference (Call, 2006).
In transitive inference tasks, animals show the ability to make relational links between individual memory traces that share common elements. Animals learn two prerequisites: A→B and B→C, and are able to conclude that A→C. In exclusive inference tasks, animals can select the correct alternative by excluding other potential alternatives. A widely adopted task for studying exclusive inference is the two-cup task (Call, 2006). In this task, apes are presented with two cups. A food reward is surreptitiously hidden inside one of the cups. When the empty cup is shaken and makes no sound, the animals reliably select the alternative cup, providing evidence of exclusive inference. We were interested in the neuronal correlates of these inference processes and whether different brain regions might be involved.
It is known that the prefrontal cortex (PFC) and the striatum are involved in reward prediction processes (Watanabe, 1996; Hollerman et al., 1998; O'Doherty et al., 2003a; Roesch and Olson, 2003; Samejima et al., 2005). Anatomically, the PFC and striatum are tightly connected (Alexander et al., 1986; Yin and Knowlton, 2006). In addition, the lateral PFC (LPFC) has two types of connections with the striatum: a focal projection and a diffuse projection (Ferry et al., 2000; Haber et al., 2006). In the focal projection, LPFC projects primarily to the head of the caudate and part of the rostral putamen. In the diffuse projection, clusters of terminal fibers from the LPFC are distributed widely throughout the striatum. The anatomical data suggest that there are dense convergent and divergent connections from the LPFC to the striatum (Alexander et al., 1986; Haber et al., 2006; Yin and Knowlton, 2006).
Functionally, the striatum is thought to learn action values directly by trial and error without building explicit models of the environment and task (i.e., “model-free learning”; Daw et al., 2005; Ito and Doya, 2011). For example, the striatum uses temporal-difference learning (a type of model-free learning) to guide behavior to maximize future reward by simply reinforcing successful actions (Niv and Schoenbaum, 2008). In contrast, the PFC has been shown to play an important role in model-based learning (Daw et al., 2005; Yamamoto et al., 2011; Pan and Sakagami, 2012), such as in the encoding of abstract rules (White and Wise, 1999; Wallis et al., 2001; Genovesio et al., 2005), in planning behaviors (Sakagami et al., 2006; Rushworth and Behrens, 2008), and in dynamic decision making (O'Doherty et al., 2003b; Barraclough et al., 2004).
On the basis of these observations, we hypothesized that LPFC neurons were involved in a reward inference process that predicted reward value based on knowledge of the causal structure of the task, whereas striatal neurons predicted reward value through direct learning. To test this hypothesis, we recorded single-unit activity from the LPFC and striatum of monkeys performing a sequential paired-association task under an asymmetric reward schedule (Pan et al., 2008). We found that the LPFC neurons we recorded were able to predict the reward value of a stimulus by transitive inference even when the monkeys had not yet directly learned the stimulus–reward contingency, whereas the striatal neurons we recorded were not able to do so. Instead, because paired stimuli always had different reward values (one large and one small), using exclusive inference, these striatal neurons were able to infer the reward value of a stimulus in a given pair after experiencing the alternative stimulus with the alternative reward value directly. These results indicate that the recorded neurons in the LPFC and striatum were involved in different inference processes.
Materials and Methods
Subjects.
Three male Japanese monkeys (Macaca fuscata) served as subjects in this study (Hop, 7.5 kg, Tap, 6.5 kg, and Tom, 8.9 kg). We implanted a head holder and 2 recording chambers (1 in each hemisphere) for each monkey under aseptic techniques with ketamine (4.6–6.0 mg kg−1 by intramuscular injection) and sodium pentobarbital (Nembutal, 4.5–6.0 mg kg−1 by intravenous injection) anesthesia. The size of the chamber was 40 mm (length, anterior–posterior) × 30 mm (width, lateral–medial) and each was implanted with its center located near the end of the principal sulcus, which allowed us to record neural activity in the LPFC and striatum simultaneously from the same chamber. All surgical and experimental protocols were approved by the Animal Care and Use Committees at Tamagawa University and were in accordance with the National Institutes of Health's Guide for the Care and Use of Laboratory Animals.
Behavioral task.
The monkeys were seated in a primate chair (with their heads fixed) inside a completely enclosed, sound-attenuated and electrically shielded room. A 21-inch CRT display (FE220; NEC) with 60 Hz refresh rate was set at a distance 60.0 cm in front of the monkey for the presentation of visual stimuli. Eye movements were monitored by the Eyelink2 system (SR Research) with 500 Hz sample rate. All stimulus presentation and behavioral procedures were controlled by the TEMPO system (Reflective Computing).
Sequential paired-association task.
In this study, the three monkeys were required to learn two associative sequences (Fig. 1A) in a sequential paired-association task (Fig. 1B). Six discriminable icons were used as visual cues counterbalanced across three subjects (a blue question mark and a line drawing of a tower were denoted as A1 and A2; red and green patches as B1 and B2; a white cross and a white circle as C1 and C2). The two correct sequential associations were as follows: A1→B1→C1 and A2→B2→C2. Each sequential paired-association trial (SPAT; Fig. 1B) started with the onset of a white fixation spot (0.21° of visual angle) presented at the center of the monitor. The monkey had to fixate on the spot for a random duration (800–1200 ms) within a virtual fixation window (3° × 3°). Subsequently, the first stimulus cue (e.g., A1) was presented for 400 ms at the center of the display. After a variable delay period (700–1200 ms), the fixation spot disappeared and at the same time the second cues, B1 and B2, were presented pseudorandomly (using a modified Gellerman sequence) at the left and right positions on the CRT (6° of visual angle from center). If the subject made a saccade to the target cue (e.g., B1), this was denoted as the first correct choice. Immediately after the correct first choice, the distracter (e.g., B2) was removed from the display and the monkey continued fixating on the target cue (B1) for another 600 ms. After the disappearance of the target cue (B1), the third cues, C1 and C2, were simultaneously displayed pseudorandomly to the left and right of where the target cue (B1) had appeared (5° of visual angle from the central position of B1). This instructed the monkey to make a further saccadic eye movement to the correct target cue (e.g., C1) in the second choice. After two correct choices, the monkey received a drop of water as a reward and an auditory tone of 1 kHZ at the end of the trial.
Figure 1.

Sequential paired-association task with an asymmetric reward schedule. A, Two associative sequences (A1→B1→C1 and A2→B2→C2) learned by the monkeys. These six icons were termed “old stimuli.” B, Time events in the sequential paired-association trial. The monkeys made a choice by a saccadic eye movement, as indicated by small yellow arrows. C, Examples of new stimuli associated with two color patches (B1 and B2). The monkeys learned each pair of new stimuli (i.e., NS1 and NS2) with B1 or B2 in a delayed matching-to-sample task with a symmetric reward schedule. D, An asymmetric reward schedule was used in each block. There were two types of trials in one block: reward instruction trials and SPATs. In the SPATs, the new stimulus was presented as the first cue. The yellow arrows indicate saccadic eye movement and are not actually shown for in the experiment.
The saccade was judged to be correct if the eye position stayed at least 200 ms within a virtual window (3° × 3° of visual angle) centered on the position of the target stimulus. The monkey had to keep its fixation inside the virtual fixation window during the fixation, cue presentation, and delay periods. If it moved its fixation out of this window, the trial was rejected as a fixation break. When the monkey made a fixation break or an erroneous choice, the trial was aborted and a high tone of 4 kHz indicated an error. In these cases, after a longer intertrial interval (ITI; 6 s—the normal ITI after a correct trial was 3 s), the same trial was repeated until the monkey was able to complete it correctly. The repeated trials after error were referred to as correction trials. Through the SPAT training, the three monkeys learned the two correct associative sequences, A1→B1→C1 and A2→B2→C2. The three monkeys also learned another two sequences, the BCA sequence (B1→C1→A1 and B2→C2→A2) and the CAB sequence (C1→A1→B1 and C2→A2→B2); however, these two sequences were not used in the present study.
Reward instruction trials.
After the learning of the two sequential associations was completed, we introduced an asymmetric reward schedule using reward instruction trials. During reward instruction trials, the monkey was instructed as to which stimulus (C1 or C2) was paired with a large reward (Fig. 1D). This was done by a visually guided saccade task in which, after fixation, C1 or C2 was presented (skipping the A1, A2, and B1, B2 steps) and the monkeys had to saccade to whichever appeared. The different visual stimuli (C1 and C2) were paired with different amounts of water. In one case, C1 was followed with a large reward (0.4 ml) and C2 was paired with a small reward (0.1 ml); in the other case, C1 was followed by a small reward and C2 by a large reward.
Reward-instructed sequential paired-association task with old stimuli.
After having fully acquired how to do both the reward instruction and the sequential paired-association tasks, the three monkeys were required to perform a combination of the two trial types in one block. At the beginning of each block, three or four reward instruction trials were presented for the monkeys to indicate which target (C1 or C2) was paired with the large reward and which was paired with the small reward. Reward instruction trials were then followed by SPATs (8–15 trials). The procedure of SPATs was the same as described above, except that the amount of reward was asymmetric. The asymmetric reward rule was consistent between the two types of trials within one block. For example, in a given block, if C1 was paired with the large reward and C2 with the small reward in reward instruction trials, then the A1→B1→C1 sequence was followed by the large reward and the A2→B2→C2 sequence was paired with the small reward in SPATs. The asymmetric reward schedule was pseudorandomly assigned between blocks.
Training of new stimuli pairings.
The monkeys were trained to learn new stimulus associations in a delayed matching-to-sample task with a symmetric reward schedule. The new stimulus was learned to be associated with one of the two color patches, B1 or B2. In this task, the color patches were always presented on the same side of the screen (e.g., B1 on left, B2 on right) to speed learning. We downloaded 400 icons from the Internet, classified them into 200 new pairs randomly, and examined each pair visually to prevent similar new stimuli from being paired together. These newly learned stimuli will hereafter be referred to as “new stimuli,” whereas the stimuli A1, B1, C1, A2, B2 and C2 will hereafter be referred to as “old stimuli.”
After learning one pair of new stimuli, the monkey moved on to learn another pair of new stimuli, and so on. For this training, we assigned 1 daily session each week to train the monkeys to learn 4–5 pairs of associations between the new stimuli and B1 and B2 without recording. The newly learned stimuli were classified into two groups according to the old stimuli with which they were associated. The new stimuli associated with B1 were classified into the A1 group and the new stimuli associated with B2 were classified into the A2 group. Up to this point, the monkeys had received no direct associations between new stimuli and C1 or C2 and no information about the asymmetric reward schedule with respect to the new stimuli.
Reward-instructed sequential paired-association task with new stimuli.
After having fully acquired the new associations, the monkeys performed the reward-instructed sequential paired-association task with new stimuli (Fig. 1D). This was identical to the reward-instructed SPATs with old stimuli except that, in these SPATs, a newly learned stimulus was presented as the first cue instead of the old stimulus (A1 or A2) and the second cues, B1 and B2 (the two color patches), were always shown in the same fixed positions as during training.
Data acquisition.
Action potentials of single neurons were recorded extracellularly with tungsten electrodes (0.8–1.5 MΩ; FHC) from the LPFCs of the three monkeys (Fig. 3) and the caudate and putamen of the two monkeys (Tap and Tom; Fig. 4). Usually, two microelectrodes, one into the LPFC and the other into the striatum, were used to record single-unit activity. Each electrode was inserted via a guide tube through a grid system (holes: 0.6 mm wide and 1.0 mm apart from center to center; Nakazawa) into the cortical surface, and then each electrode was advanced into the target position independently by means of the electrode drive (NAN Instruments). A Plexon system was used to amplify neuronal action potentials and to discriminate individual spike waveforms online.
Figure 3.

Anatomical location of recording sites in the lateral prefrontal cortices of the three monkeys. A–C, Distribution of recording sites and the distribution of reward neurons in the monkey Tap (A), the monkey Tom (B), and the monkey Hop (C). The empty black circles represent recorded sites at which no reward-related neurons were found. The filled red circles represent recording sites at which reward neurons were found.
Figure 4.

Recording sites in the striatum of the two monkeys (Tap and Tom) plotted on MRI coronal sections. To reconstruct the recording sites based on MR images, we took MR images of the monkeys' brains with inserted markers (see Materials and Methods). A, Coronal MR image of Tap where the anterior commissure (AC) = 0. The long white lines were extensions of those markers. B, C, Locations of recorded neurons in the right and left hemispheres of Tap, respectively. D, Coronal MR image of Tom where AC = 0. The long white lines were extensions of these markers. E, Locations of recorded neurons in the right hemisphere of Tom. White circles represent recorded neurons that showed no reward-modulated activity. Red circles represent reward neurons. AC indicates the anterior commissure; the sections anterior and posterior to the AC are indicated by plus and minus numbers (distances in mm), respectively.
The system then saved the spike timing and selected waveforms (in an 800 μs window) on the Plexon PC together with the timing of task events. The eye movement data and spiking time were also saved on the behavioral control PC (TEMPO client PC). In the caudate and putamen, we recorded the spike activity of presumed projection neurons that showed phasic response to task events and had low spontaneous activity (Hikosaka et al., 1989), but not those of presumed interneurons that showed irregular tonic discharge (Aosaki et al., 1994).
During recording sessions, once a neuron was isolated, its properties were tested in the reward-instructed SPAT with the old stimuli (and here, the positions of the second cues B1 and B2 were pseudorandomized). The first cue was A1 or A2. If the neuron's activity was found to be modulated by the amount of reward, then we continued recording the activity of that neuron while the monkey performed the reward-instructed SPAT with the new stimuli (the positions of the second cues B1 and B2 being fixed). Each pair of new stimuli was tested with only one neuron. A pair of new stimuli was tested repeatedly for at least two blocks for each neuron recorded.
The advantage of the recording method used is that it reduced the number of new stimuli associations that monkeys had to learn in total (they found it quite hard to learn these, so the less they had to learn, the less time and effort required). The disadvantage was that we might have neglected neurons that show reward-modulated activity to the new stimuli, but not to the old stimuli. However, in this study, we were interested in studying neurons related to value coding. These value-coding neurons inherently must respond to the value of both old and new stimuli. The type of neurons that we potentially neglected to record could not be called “value-coding neurons” per se, because they would respond to only the value of the new stimuli, but not the value of the old stimuli. This type of neuron, if it exists, may be more related to “value learning,” a concept we did not aim to address in the current experiment.
Recording maps in the LPFC and striatum.
Figures 3 and 4 show the recorded tracks and distributions of reward neurons in the LPFC (both hemispheres for Tap, the left hemisphere for Hop, and the right hemisphere for Tom) and in the striatum (two hemispheres for Tap and the right hemisphere for Tom), respectively. Confirmation of recording locations was based on magnetic resonance imaging (MRI, 3-T Trio A Tim MRI scanner; Siemens). To reconstruct the recording sites based on MR images, we took MR images of the monkeys' brains with inserted markers. These markers were 21 small silica tubes that had been filled with a special liquid (a phantom solution) and then inserted into the recording grid. These tubes mimicked the recording electrodes and showed higher contrast in MR images (as indicated by the three short gray lines in Fig. 4A,D). The three long white lines in Figure 4, A and D, were extensions of these tube lines. On the basis of the position of the first recorded neuron in the cortex and the position of the first neuron recorded in the striatum, we were able to map neurons in the striatum.
In the prefrontal cortex, we mainly recorded single units from the ventrolateral area (VLPFC, below the principle sulcus). Reward neurons tended to be dispersed widely in the VLPFC, so there was no distinct spatial distribution. In the striatum, we predominately recorded neural activity from the anterior part, anterior to the anterior commissure, including the caudate nucleus and the putamen. This area usually is referred to as the association striatum. Several studies involving monkeys have reported that neurons in this association striatum are related to learning (Hikosaka et al., 1999; Miyachi et al., 2002; Williams and Eskandar, 2006).
Data analysis.
Off-line analysis was performed using custom-made MATLAB (The MathWorks) programs on a PC. To calculate the behavioral performance (correct rate) of the first choice as a function of SPAT order in blocks after reward instruction, the data were averaged across all blocks performed by the monkeys. Using the correction method, we excluded the data in repeated trials (the trials directly after error trials) to calculate the correct rate. We also calculated the behavioral performance in response to new stimuli presented for the first time in SPAT blocks immediately after reward instruction trials. Trials in each of the first SPAT blocks were classified into two sequences: the first trial sequence and the second trial sequence, which are described below. These sequences will hereafter be referred to as N1 and N2 for the first trial sequence and the second trial sequence, respectively. In addition, when we refer to particular trials within a trial sequence, we will put the trial number on the end; for example N1,1 stands for trial 1 in the first trial sequence, N1,2 for trial 2 in the first trial sequence, N2,1 for trial 1 in the second trial sequence, etc.
Each first trial sequence consisted of the very first SPAT within the block (N1,1) and subsequent trials within this block in which the same new stimulus was presented (N1,2, N1,3, etc.; please note that these are not necessarily the second and third trials in the block, but rather the second and third trials in which this stimulus was presented within the block). The second trial sequence included trials in which the alternative new stimulus (N2,1, N2,2 N2,3, etc.; see schematic block in the bottom panel in Fig. 2) was presented as the first cue.
Figure 2.

The effect of reward amount on the behavioral performance of the three monkeys. A, B, The performance of monkey Hop showing the accuracy of the first choice (selection of B on the basis of new stimuli) in SPATs as a function of SPAT order in the first trial sequence (A), and the second trial sequence (B). C, D, Performance of monkey Tap in the first trial sequence (C) and in the second trial sequence (D). E, F, Performance of monkey Tom in the first trial sequence (E) and in the second trial sequence (F). The orange curves represent the correct rate in large reward trials, whereas the blue curves indicate the correct rate in small reward trials. **p < 0.01, Mann–Whitney U test. Error bars indicate SEM. The bottom sketch illustrates the first trial sequence and the second trial sequence. NS1 and NS2 represent two new stimuli in a pair. N1,1, N1,2, and N1,3 indicate the first, second, and third trial in the first trial sequence and N2,1, N2,2, and N2,3 the first, second, and third trial in the second trial sequence.
Overall, for each pair of new stimuli, there was one first trial sequence and one second trial sequence. To calculate the behavioral performance in response to the new stimuli in the first trial sequence, we first determined the accuracy in each trial in each first trial sequence. We then averaged the correct rates across all first trial sequences separately for the large reward condition and the small reward condition (Fig. 2). The behavioral performance in response to the new stimuli in the second trial sequences was calculated in the same way.
For the analysis of neuronal data, we used only correct trials. In this study, we concentrated on neuronal activity in two time epochs: the first cue period and the early delay period. The first cue period occurred from 100 ms to 500 ms after the first cue onset, and the early delay period occurred from 500 ms to 900 ms after the first cue onset.
The activity of each neuron was analyzed by a two-way ANOVA, with old stimuli (A1 vs A2) and reward (large vs small) as the main factors in the first cue period and in the early delay period, respectively. Depending on the results of the ANOVA (p < 0.01), neurons were classified into three types: stimulus neurons, reward neurons and stimulus–reward neurons. Stimulus neurons showed a significant main effect of stimuli (p < 0.01), but no a main effect of reward and no interaction between the two factors. Therefore, stimulus neurons only discriminated the visual properties of stimuli, regardless of reward conditions. Neurons which only showed a significant main effect of reward (p < 0.01) were classified into reward type. This type of neurons predicted whether the amount of reward associated with a stimulus would be large or small, regardless of which stimulus was presented. Stimulus–reward neurons showed a significant interaction between stimuli and reward and/or significant main effects of both stimulus and reward. In this study, we focused on reward neurons. Some neurons showed reward-modulated activity in both the first cue and early delay periods. If a neuron was identified as reward type in the first cue period, it was excluded from the population in the early delay period so that the population neurons in the two periods would not overlap.
Next the activity of the neurons recorded with new stimuli was further analyzed by two-way ANOVAs (new stimulus × reward) in the first cue and early delay periods. Our aim was to examine whether or not reward neurons defined by old stimuli would keep the same response properties for new stimuli. To examine the interaction between stimulus familiarity and reward, we performed a two-way ANOVA using the activity of each neuron that had been recorded for both old and new stimuli. The two main factors were stimulus familiarity (old vs new) and reward amount (large vs small).
The spike density function of single neurons was generated by averaging activities in every 1 ms-bin across trials, and then smoothed by a Gaussian envelope with σ = 30 ms. To generate the population histogram, we first calculated the firing rate of each trial in every 1 ms bin. We then subtracted from this, the mean firing rate from the fixation period (500 ms epoch before the first cue onset). Finally, we averaged the normalized firing rate in every bin across all trials for each neuron and across population neurons, and finally smoothed these data using a Gaussian envelope with σ = 30 ms.
For each reward neuron whose activity was recorded using the new stimuli, we first determined its activity responding to the new stimuli in each trial in the first and second trial sequences. We then normalized the activities by the maximal and minimal responses to the new stimuli in all trials. The normalized activity in each trial was averaged across the first trial sequences (or across the second trial sequences) separately for the preferred reward condition and the nonpreferred reward conditions.
To evaluate the strength of reward modulation of reward neurons, we calculated a normalized reward index for each neuron using the following equation:
where Rpref indicates the activity in the preferred reward condition and Rnon-pref the activity in the nonpreferred reward condition. For each neuron, this reward index was calculated for old and new stimuli, respectively. All trials across blocks were included to calculate the reward index for the old stimuli in the LPFC and striatum. To compute the reward index for the new stimuli, we again included all trials across blocks in the LPFC; however, we excluded the first trials in which the new stimuli were presented for the first time as the first cue in SPATs (i.e., N1,1 and N2,1) in the caudate and putamen.
To calculate the reward discrimination latency of each reward neuron, we performed a sliding receiver operating characteristic (ROC) analysis. For each neuron, we calculated the latency for old stimuli and new stimuli, respectively. The ROC analysis measures the degree of overlap for two distributions of neuronal activity. The advantage of this method is that it is independent of the baseline firing rate and dynamic ranges; it also does not require a normal distribution. To examine the time course of a neuron's reward discrimination ability, we calculated the ROC value (the area under the ROC curve) for the activity in trials with large reward versus trials with small reward over a 100 ms epoch. The window onset was the fixation period of the trial (800 ms fixation period before the presentation of the first cue), and this then stepped forward with every 10 ms interval until the end of the delay. We computed the mean and SD of the sliding ROC values during the fixation period for each neuron and set the threshold at the mean of the ROC values plus 3 SDs. The reward-discrimination latency was defined as the time at which the threshold was exceeded for three consecutive time steps. If a neuron was not able to reach this criterion, it was excluded from the latency count. We also tried setting the number of consecutive time bins as 2 and setting the shifted time window as 50 ms and got consistent results using these different parameters.
Results
Three Japanese monkeys (Hop, Tap, and Tom) were required to perform the reward-instructed sequential paired-association task with old stimuli (the first cue stimuli: A1 and A2. see Materials and Methods). In this task, the monkeys extensively experienced the stimulus–reward reversals block-by-block. Subsequently, the monkeys were required to perform the task but with the new stimulus pairs that had not been presented previously with an asymmetrical reward schedule. In total, we tested 112 pairs of the new stimuli for Hop, 214 for Tap, and 136 for Tom. This allowed us to analyze the behavior and neuronal activity in the SPATs in which a new stimulus was presented for the very first time.
Behavioral results
We found that the behavior of the three monkeys was influenced systematically by the amount of reward. The monkeys showed significantly higher correct rates on the first choice in the larger reward trials for both the old and new stimuli (Mann–Whitney U test, p < 0.01).
We further examined the correct choice rates in response to the initial presentation of the new stimuli in SPATs after reward instruction of C1 and C2 (Fig. 2). The SPATs in each of these blocks were separated into the first and second trial sequences (see Materials and Methods).
We focused our analysis on the first choice performance in the first SPATs in the first and second trial sequences (i.e., the first choices in N1,1 and N2,1). In these specific trials, the new stimuli were presented for the first time, so the monkeys had therefore had no previous opportunity to pair the new stimuli directly with a particular (large or small) amount of reward. Nevertheless, the monkeys showed significantly higher correct rates in the larger reward condition from the first trials in the both trial sequences (Mann–Whitney U test, **p < 0.01, *p < 0.05; Fig. 2), suggesting the possibility that the monkeys could infer the reward correctly. Behaviorally, however, we could not yet easily determine whether the monkeys actually predicted the amount of reward based on the first cues (the new stimuli) or if they were simply relying on associations with the second cues (B1 and B2; old stimuli) to predict the reward.
Evidence for reward inference should ideally be sought in the neuronal data at the time of the first cue presentation; that is, before the monkeys could rely on a second cue so as to recall an already-established reward association (e.g., B1→C1→Reward).
Neural database
Accordingly, we recorded the activity of 546 neurons from the LPFCs of the three monkeys (Hop: 152; Tap: 217; Tom: 177; Fig. 3), and the activity of 366 neurons from the caudate and putamen of two of the monkeys (Tap: caudate: 95, putamen: 160; Tom: caudate: 73, putamen: 38; Fig. 4) while they performed the reward-instructed sequential paired-association task with the old stimuli (the first cues: A1 and A2). The activity of each neuron was analyzed using a two-way ANOVA as follows: stimulus (A1 or A2) × reward (large or small), p < 0.01 in the first cue and early delay periods that were before the second cues. Depending on the ANOVA results, the neurons were classified into three types: stimulus neurons, reward neurons, and stimulus–reward neurons. Tables 1, 2, and 3 show the number of each type of neurons in the LPFC, the caudate, and the putamen, respectively. In this study, we focused on the reward neurons in the LPFC and striatum to investigate how these neurons processed reward information for the new stimuli.
Table 1.
Classification of LPFC neurons in the three monkeys
| Monkey | Recorded neurons | Reward neurons |
Stimulus-reward neurons |
Stimulus neuron |
|||
|---|---|---|---|---|---|---|---|
| First cue period | Early delay period | First cue period | Early delay period | First cue period | Early delay period | ||
| Hop | 152 | 30 (26) | 19 (13) | 17 (11) | 2 (0) | 5 (1) | 1 (1) |
| Tap | 217 | 25 (16) | 23 (17) | 26 (19) | 5 (1) | 15 (7) | 4 (0) |
| Tom | 177 | 37 (21) | 21 (13) | 21 (16) | 3 (0) | 9 (1) | 4 (0) |
| Total | 546 | 92 (63) | 63 (43) | 64 (46) | 10 (1) | 29 (9) | 9 (1) |
Numbers between parentheses indicate the number of neurons tested with new stimuli. Each neuron is assigned to one of the two time periods to avoid double counting (see Materials and Methods).
Table 2.
Classification of caudate neurons in the two monkeys
| Monkey | Recorded neurons | Reward neurons |
Stimulus-reward neurons |
Stimulus neuron |
|||
|---|---|---|---|---|---|---|---|
| First cue period | Early delay period | First cue period | Early delay period | First cue period | Early delay period | ||
| Tap | 95 | 35 (24) | 7 (2) | 14 (6) | 3 (2) | 1 (0) | 1 (0) |
| Tom | 73 | 26 (17) | 9 (7) | 4 (2) | 0 (0) | 1 (0) | 0 (0) |
| Total | 168 | 61 (41) | 16 (9) | 18 (8) | 3 (2) | 2 (0) | 1 (0) |
Numbers between parentheses indicate the number of neurons tested with new stimuli. Each neuron is assigned to one of the two time periods to avoid double counting (see Materials and Methods).
Table 3.
Classification of putamen neurons in the two monkeys
| Monkey | Recorded neurons | Reward neurons |
Stimulus-reward neurons |
Stimulus neuron |
|||
|---|---|---|---|---|---|---|---|
| First cue period | Early delay period | First cue period | Early delay period | First cue period | Early delay period | ||
| Tap | 160 | 39 (27) | 24 (9) | 6 (5) | 4 (1) | 4 (0) | 1 (0) |
| Tom | 38 | 13 (10) | 4 (4) | 0 (0) | 0 (0) | 2 (1) | 0 (0) |
| Total | 198 | 52 (37) | 28 (13) | 6 (5) | 4 (1) | 6 (1) | 1 (1) |
Numbers between parentheses indicate the number of neurons tested with new stimuli. Each neuron is assigned to one of the two time periods to avoid double counting (see Materials and Methods).
In the LPFC, we found 92 reward neurons in the first cue period and 63 reward neurons in the early delay period. There were 61 caudate and 52 putamen reward neurons in the first cue period and 16 caudate and 28 putamen reward neurons in the early delay period. The proportion of reward neurons in the LPFC was significantly lower than those in the caudate and putamen (28.4% [155/546] in the LPFC; 45.8% [77/168] in the caudate, and 40.4% [80/198] in the putamen, χ2 test, p < 0.01). The ratio of reward neurons did not differ significantly between the caudate and putamen (χ2 test, p > 0.2). Approximately half (53.5% or 83/155) of the LPFC reward neurons and three-quarters of the caudate (74% or 57/77) and putamen (77.5% or 62/80) reward neurons showed stronger activity in large versus small reward trials. The ratio in the LPFC was significantly lower compared with the ratio in the caudate (χ2 test, p < 0.01). For the reward neurons in both the LPFC and striatum, we refer to the reward condition that produced higher activity as the “preferred reward condition” and the other reward condition as the “nonpreferred reward condition.”
Next we investigated how many neurons showed significant reward effects in both the first cue and early delay periods. Of the 92 LPFC neurons that showed reward-modulated activities to the old stimuli in the first cue period, 42 (45.7%) of them also showed reward-modulated activities in the early delay period. Of the 61 caudate neurons that showed reward-modulated activity to the old stimuli in the first cue period, 39 (63.9%) of them also showed reward-modulated activities in the early delay period. In addition, of the 52 putamen neurons that showed reward-modulated activity to the old stimuli in the first cue period, 27 (51.9%) of them also showed reward-modulated activities in the early delay period.
In this study, we also recorded the neural activity of these reward neurons with the new stimuli in the LPFC, the caudate and putamen. In the LPFC, 106 out of 155 reward neurons were recorded for both the old and new stimuli (Table 1). In the striatum, 100 (50 neurons from the caudate and 50 neurons from the putamen) of 157 reward neurons were tested with the new stimuli (Tables 2, 3). Each of them was tested with at least one pair of the new stimuli (median number of pairs: 2; range: 1–6).
To determine how familiarity of stimuli affected reward information encoded by these reward neurons, the activity of each of them was analyzed using a two-way ANOAV with two factors, stimulus familiarity (old vs new) and reward (large vs small). Of the 106 LPFC reward neurons, 38 (35.8%) showed only a significant main effect of reward (p < 0.01) and neither significant main effect of familiarity nor any interaction between the two factors (p > 0.01), indicating that these neurons encoded reward information regardless of stimulus familiarity. Approximately 38.7% (41/106) of LPFC reward neurons had significant main effects of reward and stimulus familiarity (p < 0.01), but no significant interaction between them, indicating that these neurons represented the familiarity information and the reward information of stimuli independently. We found that 19 (17.9%) LPFC neurons showed a significant interaction between the two factors of reward and stimulus familiarity (p < 0.01). In addition, four neurons proved only selective to old versus new stimuli and another four had no effects of reward or stimulus familiarity and showed no interaction.
Of the 50 caudate reward neurons, 16 (32%) showed a significant main effect of reward, with no significant main effect of stimulus familiarity and no interaction between the two factors. Seventeen (34%) neurons had significant main effects of reward and familiarity, but displayed no interaction between them. Seventeen (34%) neurons showed a significant interaction between the two factors.
Of the 50 putamen reward neurons, 27 (54%) showed a significant main effect of reward, with no significant main effect of stimulus familiarity and no interaction between the two factors. Twelve (24%) neurons had significant main effects of reward and familiarity, but displayed no interaction between them. Ten (20%) neurons showed a significant interaction between the two factors. One neuron proved only selective to the old versus new stimulus. We found that the fractions of reward neurons with activity that was modulated by the new stimuli did not differ significantly in the first cue and early delay periods in the LPFC (in the first cue period: 40/63 or 63.5%, in the early delay period: 25/43 or 58.1%; χ2 test, p = 0.5785), in the caudate (in the first cue period: 28/41 or 68.3%; in the early delay period: 6/9 or 66.7%, χ2 test, p = 0.9246), or in the putamen (in the first cue period: 19/37 or 51.4%; in the early delay period:3/13 or 23.1%, χ2 test, p = 0.0773). When the ratios within the three areas were compared, the putamen showed a smaller proportion of reward neurons with activity that was sensitive to stimulus familiarity than did the LPFC or the caudate (putamen: 22/50 or 44%, caudate: 34/50 or 68%, LPFC: 65/106 or 61.3%; χ2 test, p = 0.0421). The proportions in the LPFC and caudate did not differ significantly (χ2 test, p = 0.4188).
In the later analysis, we focused on the reward neurons that were recorded for both the old and new stimuli. We collapsed the reward neurons across the two time epochs and across the monkeys because neither the temporal nor the between-subjects factor had a bearing on the results.
Reward neurons in the LPFC and striatum
A typical reward neuron in the LPFC (Fig. 5A) showed significantly higher activity in large than in small reward trials (two-tailed t test, p < 0.01) and no differential activity between the two old stimuli (A1 versus A2) in the first cue period. This neuron showed a similar reward-modulated activity when the new stimuli were presented as the first cue (Fig. 5B). Therefore, it appears that the reward neurons encoded reward-related information associated with the stimuli regardless of their visual properties and regardless of the group to which the stimulus belonged, a type of neural activity that has been observed in previous reports (Watanabe, 1996; Leon and Shadlen, 1999; Kobayashi et al., 2006).
Figure 5.

An example LPFC reward neuron and population histograms. In these figures, activity in the first and repetition trials with new stimuli was included in the analysis. A, B, Response of a LPFC reward neuron to old stimuli (A) or new stimuli (B). All trials were sorted into four conditions based on the first cue stimulus (A1 group vs A2 group) and on the two reward conditions (large vs small reward) and then aligned with the first cue onset. Red lines in the rastergrams mark the onset and offset of the first cue. The orange curves in the histograms represent data from large reward trials and the blue curves represent data from small reward trials. The gray areas indicate the first cue period for analysis of neuronal activity. Three pairs of new stimuli were tested for this neuron (indicated by the three different colors in B). C, D, Population histograms of LPFC reward neurons that showed significant reward modulation for old stimuli in the first cue period (C) and for new stimuli in the first cue period (D). The gray areas denote the first cue period. E, F, Population histograms of LPFC reward neurons that showed significant reward modulation in the early delay period (the gray area), but not in the first cue period for old stimuli (E) and for new stimuli (F). To make the histograms, trials for each cell were sorted by the preferred reward condition (orange curve) and the nonpreferred reward condition (blue curve). In addition, the activity in each trial was normalized by the firing rate during the 500 ms fixation epoch before the first cue onset (indicated by the thick black line).
We found that the majority of the 106 reward neurons in the LPFC (93/106, 87.7%) showed reward-type activity to the new stimuli in the first cue and/or in the early delay periods (two-way ANOVA, stimulus vs reward, p < 0.05). The remaining 13 neurons showed no reward-modulated activity to the new stimuli tested. The population histogram of reward neurons in the LPFC shows that they distinguished the preferred from the nonpreferred reward condition not only for the old stimuli, but also for the new stimuli in both the first cue period (Fig. 5C,D) and in the early delay period (Fig. 5E,F).
An example reward neuron in the caudate showed reward-modulated activity to both the old and new stimuli independent of their visual properties (Fig. 6A,B). All 50 caudate and 90% (45/50) of putamen reward neurons showed reward-modulated activity to the new stimuli in the first cue and/or in the early delay period (two-way ANOVA, stimulus vs reward, p < 0.05). The remaining five putamen neurons showed no reward-modulated activity to the new stimuli tested. The population histogram shows that the caudate and putamen reward neurons discriminated between the two reward conditions on the basis of both the old and new stimuli in the first cue period (Fig. 6C,E) and in the early delay period (Fig. 6D,F).
Figure 6.

Histograms of activity of an example caudate reward neuron and the caudate and putamen reward neuron populations. In these figures, activity in the first and repetition trials of new stimuli were included for analysis. The formats are the same as those in Figure 5. A, B, Single-unit activity of a caudate reward neuron to old stimuli (A) or new stimuli (B) presented as the first cue in SPATs. This neuron was identified as reward type for both old and new stimuli. C, Population histograms of caudate reward neurons that showed significant reward-modulated activity to old stimuli in the first cue period. The left column represents the population histograms for old stimuli and the right column indicates the population histograms for new stimuli. D, Population histograms of caudate reward neurons that showed significant reward-modulated activity to old stimuli in the early delay period (the gray area), but not in the first cue period. The left column represents the population histogram for old stimuli and the right column indicates the population histograms for new stimuli. E, Population histograms of putamen reward neurons that showed significant reward-modulated activity to old stimuli in the first cue period. The left column represents the population histograms for old stimuli and the right column indicates the population histograms for new stimuli. F, Population histograms of putamen reward neurons that showed significant reward-modulated activity to old stimuli in the early delay period, but not in the first cue period. The left column represents the population histogram for old stimuli and the right column indicates the population histograms for new stimuli.
We were interested in whether the reward neurons in these areas could predict the reward value of the first cue stimulus (particularly for the new stimuli) in SPATs after only experiencing reward instruction with C1 and C2. We focused on the neural activity in the first SPAT block in which the new stimuli or the old stimuli were presented for the first time to each recorded neuron (Figs. 7, 8). Notably, in these very first SPATs, the new stimuli were for the first time presented as the first stimulus cues. Therefore, before the end of these specific trials, the monkeys (as well as the neurons) had had no opportunity to associate the new stimulus directly with a particular amount of reward. They also had never experienced any direct pairing between the new stimuli and C1 and C2. As a reference activity, we also calculated the activity of each reward neuron to the old stimuli in the first SPAT block after reward instruction. In these trials, the monkeys and neurons were already well experienced with the old stimuli in the SPATs with asymmetric reward schedules.
Figure 7.
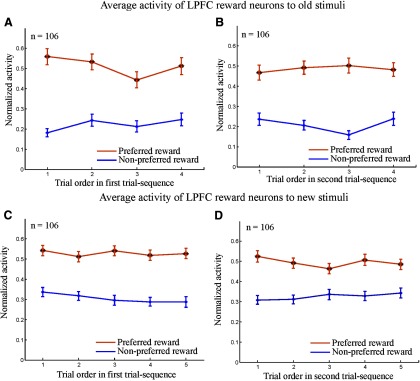
Population activities of LPFC neurons as a function of SPAT order in the first and second trial sequences. Here, the analysis was based solely on the first block of SPATs in which new stimuli (or old stimuli) were presented for the first time for each recorded neuron. A, B, Normalized activity of LPFC reward neurons to old stimuli in the first trial sequence (A) and in the second trial sequence (B). C, D, Normalized activity of the same population neurons to new stimuli in the first trial sequence (C) and in the second trial sequence (D). The normalized activity was sorted into the preferred reward condition (orange curves) and the nonpreferred reward condition (blue curves). Statistical significance was determined by Mann–Whitney U test; *p < 0.05; **p < 0.01. Error bars indicate the SEM.
Figure 8.

Population activities of caudate and putamen neurons as a function of SPAT order in the first and second trial sequences. Here, the analysis was based solely on the first block of SPATs in which new or old stimuli were presented for the first time for each recorded neuron. A, B, Normalized activity of caudate reward neurons to old stimuli in the first trial sequence (A) and in the second trial sequence (B). C, D, Normalized activity of the same caudate neurons to new stimuli in the first trial sequence (C) and in the second trial sequence (D). E, F, Normalized activity of putamen reward neurons to old stimuli in the first trial sequence (E) and in the second trial sequence (F). G, H, Normalized activity of the same putamen neurons to new stimuli in the first trial sequence (G) and in the second trial sequence (H). The normalized activity was sorted into the preferred reward condition (orange curves) and the nonpreferred reward condition (blue curves). Statistical significance was determined by Mann–Whitney U test; *p < 0.05; **p < 0.01. Error bars indicate the SEM.
We found that when an old stimulus was presented as the first cue, reward neurons in the LPFC, caudate, and putamen discriminated the two reward conditions (large and small reward) right from the first SPAT in both the first trial sequence (N1,1; Figs. 7A, 8A,E) and the second trial sequence (N2,1; Figs. 7B, 8B,F). The results of two-way ANOVA (reward vs trial order) showed that the neural activity to the old stimuli had a significant main effect of reward (p < 0.001), but no significant effect of trial order (p > 0.3) and no significant interaction between the two factors (p > 0.3). Further post hoc tests with Bonferroni correction revealed that the reward neurons in the three areas showed significantly higher activity in the preferred reward condition than in the nonpreferred reward condition (p < 0.01). However, regional differences in response activity were found when the new stimuli were presented as the first cue. LPFC reward neurons were able to predict the reward values of the new stimuli from the first SPAT after reward instruction in the both first and second trial sequences (i.e., in both N1,1 and N2,1; Fig. 7C,D) despite the fact that monkeys had never learned the new stimulus–reward contingency directly. The two-way ANOVA (reward vs trial order) demonstrated that the neural activity seen in Figure 7, C and D, had a significant main effect of reward (p < 0.001), but showed neither effect of trial order (p > 0.5) nor interaction (p > 0.4). Post hoc tests with Bonferroni correction indicated that LPFC reward neurons had significantly higher activity in the preferred reward condition compared with the nonpreferred reward condition from the first SPAT (p < 0.01).
In contrast to LPFC reward neurons, during the first trial sequence, the reward neurons in the areas of caudate and putamen did not distinguish the preferred from nonpreferred reward conditions in the first SPAT (i.e., in N1,1 trials; Fig. 8C,G). Using the two-way ANOVA, we were able to show that caudate neural activity (as seen in Fig. 8C), had a significant main effect of reward (p < 0.001) and a significant interaction between reward and trial order (p = 0.0022), but no significant effect of trial order (p > 0.9). Post hoc tests with Bonferroni correction revealed that caudate neurons had no reward-modulated activity in the first trials (p > 0.05), but did show significantly differential activity between the two reward conditions from the second trial in the first-trial sequence (i.e., from N1,2 trials, p < 0.01). The activity of the putamen neurons in Figure 8G showed a significant main effect of reward (p < 0.001) and an interaction of reward and trial order (p = 0.0143), but, again, no significant effect of trial order (p > 0.3). A post hoc test with Bonferroni correction revealed that the putamen neurons showed no reward-modulated activity in the first two trials (i.e., in N1,1 and N1,2 trials; p > 0.05), but that the differential activity between the two reward conditions gradually increased from the third trial onward and reached a significant level in the fourth trial (p < 0.01).
The same populations of neurons in the caudate and putamen predicted reward information for the new stimuli from the first SPATs in the second trial sequence (i.e., in N2,1 trials; Fig. 8D,H), although the monkeys had never learned the new stimulus–reward contingency directly. The results of a two-way ANOVA showed that neural activity (Fig. 8D,H) showed significant main effects of reward (p < 0.01), but no effect of trial order (p > 0.3) and no interaction (p > 0.7) in the second trial sequence. A post hoc test with Bonferroni correction additionally showed that both caudate and putamen neurons had significantly higher activity in the preferred reward condition as opposed to the nonpreferred reward condition from the first trial in the second-trial sequence. These results suggest that the striatal reward neurons used the new stimulus–reward contingency presented in the first trial sequence to then be able to predict the reward information for the other stimulus from each pair shown in the second trial sequence. To determine the consistency of neural response patterns among the three monkeys, we calculated the response patterns of the LPFC and striatal reward neurons in the first and second trial sequences separately for each of the animals. The results from individual monkeys were consistent with the population data from the three monkeys in the LPFC and the two monkeys in the caudate and putamen.
These results demonstrated that both LPFC and striatal neurons could transfer reward information paired with C1 and C2 to well experienced stimuli (A1 and A2) in SPATs. More importantly, the LPFC neurons that responded to reward value for the old stimuli were also able to infer the reward value of the new stimuli on the basis of reward information associated with C1 and C2. They did not require direct experience of the new stimulus–old stimulus (C1 or C2) associations or of the new stimulus–reward contingency to do so. Striatal neurons that responded to reward value for the old stimuli (both in caudate and putamen), however, appeared unable to transfer reward information associated with C1 and C2 to the new stimulus. Nevertheless, these striatal neurons did prove able to use the reward information associated with one stimulus in a pair to infer that for the alternative.
Reward-modulated effects for old stimuli and new stimuli in the LPFC and striatum
To compare reward-modulated neuronal activity to the old stimuli with reward-modulated neuronal activity to the new stimuli, we calculated a normalized reward index for each reward neuron (see Materials and Methods). Figure 9A shows the distribution of reward index values of 106 LPFC reward neurons. It was found that the reward index values were significantly larger for the old than for the new stimuli (Mann–Whitney U test, p < 10−9), indicating that reward neurons showed greater activity difference between the preferred and nonpreferred reward conditions to the old than to the new stimuli. Even excluding the 13 neurons that showed no reward-modulated activity to the new stimuli, the remaining 93 neurons still had stronger reward effects for the old stimuli relative to the new stimuli (Mann–Whitney U test, p < 10−7). We found similar reward-modulated effects in the caudate and putamen. Caudate reward neurons showed significantly greater reward index values for the old stimuli than for the new stimuli (Mann–Whitney U test, p < 0.01; Fig. 9B). This was also true for putamen reward neurons (Mann–Whitney U test, p < 10−7; Fig. 9C). Excluding the five neurons with activity that was not modulated by reward amount for the new stimuli, the remaining 45 putamen neurons still showed larger reward indexes for the old stimuli than for the new stimuli (Mann–Whitney U test, p < 10−5).
Figure 9.

Distributions of reward index values of LPFC, caudate, and putamen neurons. A, Reward index values of LPFC reward neurons for old stimuli (x-axis) and new stimuli (y-axis). B, Reward index values of caudate reward neurons for old stimuli (x-axis) and new stimuli (y-axis). C, Reward index values of putamen reward neurons for old stimuli (x-axis) and new stimuli (y-axis).
We compared further the reward index values in the three brain regions separately for the old and new stimulus conditions. A nonparametric ANOVA test (Kruskal–Wallis test) showed that the reward index values (for both the old and new stimuli) were significantly dependent on the factor of brain area (p < 0.001). A post hoc test with Bonferroni correction revealed that the reward index values in the LPFC were significantly smaller than those in the caudate and putamen (p < 0.01), but that the reward index values in the caudate and putamen did not differ significantly from each other (p > 0.05). These results indicate that, compared with LPFC neurons, striatal reward neurons can better discriminate between the preferred and nonpreferred reward conditions for the old and the new stimuli.
Reward discrimination latency in the LPFC and striatum
To investigate the time course of reward processing in the LPFC and striatum, we calculated the reward discrimination latency to the old and new stimuli for each neuron using the shifted ROC method (Green and Swets, 1988; Freedman et al., 2003; also see Materials and Methods). The shifted time window was set as 100 ms and stepped forward every 10 ms. The mean and SD of the sliding ROC values during the fixation period were calculated for each neuron and the threshold was set at the level of the mean of the ROC values plus 3 SDs. The reward-discrimination latency was defined as the duration from the first stimulus cue onset to the time at which the threshold was exceeded for three consecutive time steps. In the LPFC, of 106 reward neurons, 77 reached the criterion required to calculate the latency for both the old and new stimuli (Fig. 10A,B; Materials and Methods). We found that the reward discrimination latencies to the new stimuli were significantly longer than those to the old stimuli (median latency: 240 ms for the old stimuli and 380 ms for the new stimuli, Mann–Whitney U test, p < 0.001). In the caudate, 43 of 50 reward neurons reached the criterion required to calculate the latency for both the old and new stimuli (Fig. 10D,E). The reward discrimination latencies also differed significantly between the old and new stimuli (Mann–Whitney U test, p < 0.01, median latency: 230 ms for the old stimuli; 290 ms for the new stimuli; Fig. 10F). Finally, 38 putamen reward neurons reached the required threshold to calculate the latency for both the old and new stimuli (Fig. 10G,H). The latencies for the old stimuli were significantly shorter than those for the new stimuli (Mann–Whitney U test, p < 0.01, median latency: 220 ms for old stimuli and 320 ms for new stimuli; Fig. 10I). These results demonstrate that reward neurons in the LPFC, caudate, and putamen discriminated between the two reward conditions earlier in the old stimulus condition than in the new stimulus condition.
Figure 10.

Reward discrimination latencies of reward neurons estimated by a sliding ROC analysis. A, Time course of ROC value of LPFC reward neurons for the old stimuli. Short black lines mark the reward discrimination latency from the first cue onset. The figure was constructed by sorting the neurons by their latency (from minimal to maximal). B, Time course of ROC value of the same population as in A for the new stimuli. Neurons are labeled consistently between figures. For example, the 10th neuron in Fig. 10A is the same neuron as the 10th neuron in Fig. 10B, etc. Short black lines mark the reward discrimination latency for new stimuli from the first cue onset. C, The distribution of reward discrimination latencies of LPFC neurons for the old stimuli (x-axis) and the new stimuli (y-axis). D, E, Time course of ROC value of caudate reward neurons for the old stimuli (D) and for the new stimuli (E), respectively. F, Distribution of reward discrimination latencies of caudate neurons for the old (x-axis) and the new stimuli (y-axis). G, H, Time course of ROC value of putamen reward neurons for the old stimuli (G) and for the new stimuli (H), respectively. I, Distribution of reward discrimination latencies of putamen neurons for the old stimuli (x-axis) and the new stimuli (y-axis).
Next, we investigated whether the reward discrimination latencies in the three brain regions showed significant differences within old and new stimulus conditions. Using the nonparametric Kruskal–Wallis test with a factor of area (LPFC, caudate, putamen), we found that reward discrimination latencies did not differ significantly in the three areas either in the old stimulus condition (p > 0.6) or in the new stimulus condition (p > 0.14). To take into account transient reward neurons, we also calculated the reward discrimination latency for each reward neuron using the ROC method with different parameters. In one case, we set the number of consecutive time steps as two bins. In another case, we set the shifted time window at 50 ms. We obtained similar reward discrimination latencies in the LPFC, caudate, and putamen even when using these different parameters.
Discussion
We observed reward neurons in the LPFC, caudate, and putamen. Reward neurons in these three areas encoded reward-related information that was independent of the visual properties and the group membership of stimuli, a type of neural activity that has been reported previously (Kawagoe et al., 1998; Samejima et al., 2005; Kobayashi et al., 2006). However, we also found that the LPFC reward neurons (defined by reward modulated responses to old stimuli) were able to infer reward values for new stimuli that were presented in the very first SPATs for both first and second trial sequences. In contrast, the observed striatal reward neurons (again, defined by reward-modulated responses to old stimuli) could not predict reward values for new stimuli in the very first SPATs in the first trial sequences, whereas in second trial sequences, they could. These results suggest that the recorded neurons in the LPFC and striatum have different reward prediction mechanisms.
Throughout reward-instructed SPATs with old stimuli (A1 and A2 as the first cues), the monkeys extensively experienced the stimulus–reward reversals block by block. For example, in one block, the A1 group was associated with the large reward and the A2 group with the smaller reward, but in other blocks, this schedule was sometimes reversed. In this paradigm, it was possible for the monkeys to apply a conditional discrimination strategy to predict the reward amount for old stimuli. For example, the monkeys might learn conditional stimulus–reward associations: if C1→LR (large reward), then A1→LR, A2→SR (small reward) and so on, and then memorize all of the conditional associations in a virtual look-up table. By searching such a table, it would be easy for the monkeys to determine which stimulus (A1 or A2) would be paired with a large reward after reward instruction with C1 or C2.
The key advantage of the current task design was the introduction of new stimuli, which prevented any conditional discrimination strategy. The monkeys learned associations between new stimuli and B1 or B2 in a symmetric reward paradigm and, during training, the new stimuli were not paired directly with either an asymmetric amount of reward or with the third cues (C1 and C2). Therefore, when the new stimuli were presented for the first time in SPATs as first cues, the monkeys could not retrieve the new stimuli-reward associations from a virtual look-up table. Therefore, the task with new stimuli ruled out the possibility that the monkeys simply relied on rote memory to predict the amount of reward. Effectively, the monkeys had to integrate several independently acquired associations to infer the reward value of new stimuli. The task with new stimuli also demonstrated that, although recorded LPFC and striatal neurons showed similar response patterns to the well experienced old stimuli, they could be differentiated by their response patterns to the new stimuli.
Some neurophysiological studies in monkeys have reported that, in stimulus-response association learning tasks, striatal neurons acquire the stimulus-response association faster than LPFC neurons. Therefore, the signal from the striatum is suggested to engender learning in the PFC (Pasupathy and Miller, 2005). However, in our observations, the recorded LPFC neurons showed reward-predictive activity one trial earlier (in N1,1) than did the recorded caudate and putamen neurons (which only showed this from N1,2 and N2,1; Figs. 7C, 8E,G). These LPFC neurons seemed to infer the reward value of new stimuli based on already-acquired stimulus–stimulus pairings (e.g., new stimulus→B, B→C) and stimulus–reward associations (e.g., C→reward), rather than by new learning. The recorded LPFC neurons, therefore, appeared to integrate these associations and transfer the reward information to the new stimuli in the first trial sequence, suggesting the involvement of transitive reward inference. Conversely, the recorded striatal neurons did not show any transitive inference ability.
The striatal neurons recorded in the current task did not discriminate the two reward conditions in the very first SPATs in the first trial sequence. Unlike the recorded LPFC neurons, these striatal neurons could not transfer reward information associated with C1 and C2 to the new stimuli by integrating the stimulus–stimulus and stimulus–reward associations. However, after experiencing the new stimulus–reward contingency (in N1,1) directly, the recorded striatal neurons appeared to be able to make predictions for the subsequently presented new stimuli. Therefore, the recorded striatal neurons appeared to able to learn, but not to transitively infer, the relation between a given new stimulus and its reward value, something that is consistent with former studies (Tremblay et al., 1998; Nakamura and Hikosaka, 2006).
More interestingly, these striatal neurons were able to infer reward information for the new stimuli presented in the first SPATs in the second trial sequence (i.e., in N2,1 trials; Fig. 8D,H). In these SPATs, the monkeys had not experienced the contingency between the new stimulus and reward directly, but they had experienced the alternative stimulus from the pair directly with reward (in N1,1 trials). These results suggested that these striatal neurons could use reward information associated with the alternative stimulus to infer that associated with the new stimulus (e.g., if the one stimulus from a pair was associated with large reward, then these striatal neurons could infer that the other stimulus from the pair must be associated with small reward). Our results, therefore, demonstrate the involvement of the recorded striatal neurons in exclusive reward inference, but not in transitive reward inference. Similar studies have also reported that dopaminergic and habenula neurons are able to make similar inferences: when one saccadic direction is rewarded, they learn that the opposite direction is not rewarded in a two-forced saccadic choice task (Bromberg-Martin et al., 2010).
We found an effect of stimulus familiarity (old vs new) in the LPFC, caudate, and putamen. More than 60% of LPFC and caudate reward neurons and ∼45% of putamen reward neurons showed stimulus-familiarity-dependent activity in the first cue period or in the early delay period. The reward index values of the old stimuli were greater than those of the new stimuli in each of the three regions. In addition, their reward discrimination latencies were longer for the new stimuli than for the old stimuli. These results suggested that extensive training of the stimulus and the contingency between the stimulus and reward could modulate reward-related activity in the LPFC, caudate, and putamen.
In this experiment, we selected a neuron for further recording using the new stimuli when its activity was modulated by reward amount using the old stimuli. This recording strategy might have neglected neurons in the LPFC and striatum that showed reward-modulated activity to the new stimuli, but not to old stimuli. Theoretically, the potentially neglected neurons may have two types of activity patterns to the new stimuli, which may affect current conclusions. One is reward-value learning-related neurons and the other is new stimulus specific inference neurons. If the former type exists in the LPFC, we cannot conclude that all of the LPFC neurons that respond to the reward value of new stimulus can do so via transitive inference. This is likely. If the latter type exists in the striatum, we cannot conclusively say that neurons in the striatum are not capable of transitive inference. Intuitively, if neurons can be capable of the transitive inference, the function is likely to work for both old and new stimulus, which is the case in recorded reward neurons in the LPFC, although we cannot deny the possibility of transitive inference neuron in the striatum. In the future, it would be interesting to investigate further how neurons that show no reward-modulated activity with old stimulus respond to the new stimulus.
Several single-unit studies in monkeys have demonstrated that LPFC and striatal neurons encode reward information related to reward type (Watanabe, 1996), amount (Leon and Shadlen, 1999; Roesch and Olson, 2003), and probability (Kawagoe et al., 2998; Samejima et al., 2005) as indicated by conditioned visual stimuli. In the current task design, we could not dissociate whether the neural activity in the LPFC and striatum encoded reward magnitude or reward probability. Although we used 100% reward probability in correct trials, the monkey performed better in large-reward trials than in small-reward trials, indicating that the stimuli presented in large-reward trials also had higher reward probability. Nevertheless, regardless of whether their activity reflects reward magnitude or reward probability, the recorded LPFC neurons encoded reward information of new stimuli in a manner that discriminated the two reward conditions from the first SPATs, whereas the recorded striatal neurons did not.
We also observed that putamen reward neurons needed one more trial to learn the new stimulus–reward contingency in the first-trial sequence than did the caudate reward neurons, suggesting that caudate neurons learned the stimulus–reward association more rapidly. Reward discrimination latencies did not show a significant difference in the three areas either for the old stimuli or for the new stimuli. These results suggest that the reward information is not processed first in one of these areas and then passed onto the others. Therefore, perhaps the LPFC, putamen, and caudate process this information independently. Further investigation of the interactive functions among the three areas will help to classify these issues.
Footnotes
The work was supported by a Grant-in-Aid for Scientific Research on Innovative Areas, a Grant-in-Aid for Scientific Research (A), and the Tamagawa Global Center of Excellence Program from the Ministry of Education, Culture, Sports, Science and Technology. X.P. is supported by the National Nature Science Foundation of China (Grant 11232005), the Fundamental Research Funds for the Central Universities of China, and the Shanghai Pujiang Program (Grant 13PJ1402000). We thank M. Koizumi for technical assistance and D. Palomo and J.E. Taylor for insightful comments and discussion on this manuscript.
The authors declare no competing financial interests.
References
- Alexander GE, DeLong MR, Strick PL. Parallel organization of functionally segregated circuits linking basal ganglia and cortex. Annu Rev Neurosci. 1986;9:357–381. doi: 10.1146/annurev.ne.09.030186.002041. [DOI] [PubMed] [Google Scholar]
- Aosaki T, Tsubokawa H, Ishida A, Watanabe K, Graybiel AM, Kimura M. Responses of tonically active neurons in the primate's striatum undergo systematic changes during behavioral sensorimotor conditioning. J Neurosci. 1994;14:3969–3984. doi: 10.1523/JNEUROSCI.14-06-03969.1994. [DOI] [PMC free article] [PubMed] [Google Scholar]
- Barraclough DJ, Conroy ML, Lee D. Prefrontal cortex and decision making in a mixed-strategy game. Nat Neurosci. 2004;7:404–410. doi: 10.1038/nn1209. [DOI] [PubMed] [Google Scholar]
- Blaisdell AP, Sawa K, Leising KJ, Waldmann MR. Causal reasoning in rats. Science. 2006;311:1020–1022. doi: 10.1126/science.1121872. [DOI] [PubMed] [Google Scholar]
- Bromberg-Martin ES, Matsumoto M, Hong S, Hikosaka O. A pallidus-habenula-dopamine pathway signals inferred stimulus values. J Neurophysiol. 2010;104:1068–1076. doi: 10.1152/jn.00158.2010. [DOI] [PMC free article] [PubMed] [Google Scholar]
- Bunsey M, Eichenbaum H. Conservation of hippocampal memory function in rats and humans. Nature. 1996;379:255–257. doi: 10.1038/379255a0. [DOI] [PubMed] [Google Scholar]
- Call J. Inferences by exclusion in the great apes: the effect of age and species. Anim Cogn. 2006;9:393–403. doi: 10.1007/s10071-006-0037-4. [DOI] [PubMed] [Google Scholar]
- Daw ND, Niv Y, Dayan P. Uncertainty-based competition between prefrontal and dorsolateral striatum systems for behavioral control. Nat Neurosci. 2005;8:1704–1711. doi: 10.1038/nn1560. [DOI] [PubMed] [Google Scholar]
- Ferry AT, Ongür D, An X, Price JL. Prefrontal cortical projections to the striatum in macaque monkeys: evidence for an organization related to prefrontal networks. J Comp Neurol. 2000;425:447–470. doi: 10.1002/1096-9861(20000925)425:3<447::AID-CNE9>3.0.CO;2-V. [DOI] [PubMed] [Google Scholar]
- Freedman DJ, Riesenhuber M, Poggio T, Miller EK. A comparison of primate prefrontal and inferior temporal cortices during visual categorization. J Neurosci. 2003;23:5235–5246. doi: 10.1523/JNEUROSCI.23-12-05235.2003. [DOI] [PMC free article] [PubMed] [Google Scholar]
- Genovesio A, Brasted PJ, Mitz AR, Wise SP. Prefrontal cortex activity related to abstract response strategies. Neuron. 2005;47:307–320. doi: 10.1016/j.neuron.2005.06.006. [DOI] [PMC free article] [PubMed] [Google Scholar]
- Green DM, Swets JA. Signal detection theory and psychophysics (Peninsula Publishing) 1988 [Google Scholar]
- Haber SN, Kim KS, Mailly P, Calzavara R. Reward-related cortical inputs define a large striatal region in primates that interface with associative cortical connections, providing a substrate for incentive-based learning. J Neurosci. 2006;26:8368–8376. doi: 10.1523/JNEUROSCI.0271-06.2006. [DOI] [PMC free article] [PubMed] [Google Scholar]
- Hauser M, Spaulding B. Wild rhesus monkeys generate causal inferences about possible and impossible physical transformations in the absence of experience. Proc Natl Acad Sci U S A. 2006;103:7181–7185. doi: 10.1073/pnas.0601247103. [DOI] [PMC free article] [PubMed] [Google Scholar]
- Hikosaka O, Sakamoto M, Usui S. Functional properties of monkey caudate neurons. I. Activities related to saccadic eye movements. J Neurophysiol. 1989;61:780–798. doi: 10.1152/jn.1989.61.4.780. [DOI] [PubMed] [Google Scholar]
- Hikosaka O, Nakahara H, Rand MK, Sakai K, Lu X, Nakamura K, Miyachi S, Doya K. Parallel neural networks for learning sequential procedures. Trends Neurosci. 1999;22:464–471. doi: 10.1016/S0166-2236(99)01439-3. [DOI] [PubMed] [Google Scholar]
- Hollerman JR, Tremblay L, Schultz W. Influence of reward expectation on behavior-related neuronal activity in primate striatum. J Neurophysiol. 1998;80:947–963. doi: 10.1152/jn.1998.80.2.947. [DOI] [PubMed] [Google Scholar]
- Ito M, Doya K. Multiple representations and algorithms for reinforcement learning in the cortico-basal ganglia circuit. Curr Opin Neurobiol. 2011;21:368–373. doi: 10.1016/j.conb.2011.04.001. [DOI] [PubMed] [Google Scholar]
- Kawagoe R, Takikawa Y, Hikosaka O. Expectation of reward modulates cognitive signals in the basal ganglia. Nat Neurosci. 1998;1:411–416. doi: 10.1038/1625. [DOI] [PubMed] [Google Scholar]
- Kobayashi S, Nomoto K, Watanabe M, Hikosaka O, Schultz W, Sakagami M. Influences of rewarding and aversive outcomes on activity in macaque lateral prefrontal cortex. Neuron. 2006;51:861–870. doi: 10.1016/j.neuron.2006.08.031. [DOI] [PubMed] [Google Scholar]
- Leon MI, Shadlen MN. Effect of expected reward magnitude on the response of neurons in the dorsolateral prefrontal cortex of the macaque. Neuron. 1999;24:415–425. doi: 10.1016/S0896-6273(00)80854-5. [DOI] [PubMed] [Google Scholar]
- McGonigle BO, Chalmers M. Are monkeys logical? Nature. 1977;267:694–696. doi: 10.1038/267694a0. [DOI] [PubMed] [Google Scholar]
- Miyachi S, Hikosaka O, Lu X. Differential activation of monkey striatal neurons in the early and late stages of procedural learning. Exp Brain Res. 2002;146:122–126. doi: 10.1007/s00221-002-1213-7. [DOI] [PubMed] [Google Scholar]
- Nakamura K, Hikosaka O. Facilitation of saccadic eye movements by postsaccadic electrical stimulation in the primate caudate. J Neurosci. 2006;26:12885–12895. doi: 10.1523/JNEUROSCI.3688-06.2006. [DOI] [PMC free article] [PubMed] [Google Scholar]
- Niv Y, Schoenbaum G. Dialogues on prediction errors. Trends Cogn Sci. 2008;12:265–272. doi: 10.1016/j.tics.2008.03.006. [DOI] [PubMed] [Google Scholar]
- O'Doherty JP, Dayan P, Friston K, Critchley H, Dolan RJ. Temporal difference models and reward-related learning in the human brain. Neuron. 2003a;38:329–337. doi: 10.1016/S0896-6273(03)00169-7. [DOI] [PubMed] [Google Scholar]
- O'Doherty J, Critchley H, Deichmann R, Dolan RJ. Dissociating valence of outcome from behavioral control in human orbital and ventral prefrontal cortices. J Neurosci. 2003b;23:7931–7939. doi: 10.1523/JNEUROSCI.23-21-07931.2003. [DOI] [PMC free article] [PubMed] [Google Scholar]
- Pan X, Sakagami M. Category representation and generalization in the prefrontal cortex. Eur J Neurosci. 2012;35:1083–1091. doi: 10.1111/j.1460-9568.2011.07981.x. [DOI] [PubMed] [Google Scholar]
- Pan X, Sawa K, Tsuda I, Tsukada M, Sakagami M. Reward prediction based on stimulus categorization in primate lateral prefrontal cortex. Nat Neurosci. 2008;11:703–712. doi: 10.1038/nn.2128. [DOI] [PubMed] [Google Scholar]
- Pasupathy A, Miller EK. Different time courses of learning-related activity in the prefrontal cortex and striatum. Nature. 2005;433:873–976. doi: 10.1038/nature03287. [DOI] [PubMed] [Google Scholar]
- Roesch MR, Olson CR. Impact of expected reward on neuronal activity in prefrontal cortex, frontal and supplementary eye fields and premotor cortex. J Neurophysiol. 2003;90:1766–1789. doi: 10.1152/jn.00019.2003. [DOI] [PubMed] [Google Scholar]
- Rushworth MF, Behrens TE. Choice, uncertainty and value in prefrontal and cingulate cortex. Nat Neurosci. 2008;11:389–397. doi: 10.1038/nn2066. [DOI] [PubMed] [Google Scholar]
- Sakagami M, Pan X, Uttl B. Behavioral inhibition and prefrontal cortex in decision-making. Neural Netw. 2006;19:1255–1265. doi: 10.1016/j.neunet.2006.05.040. [DOI] [PubMed] [Google Scholar]
- Samejima K, Ueda Y, Doya K, Kimura M. Representation of action-specific reward values in the striatum. Science. 2005;310:1337–1340. doi: 10.1126/science.1115270. [DOI] [PubMed] [Google Scholar]
- Tremblay L, Hollerman JR, Schultz W. Modifications of reward expectation-related neuronal activity during learning in primate striatum. J Neurophysiol. 1998;80:964–977. doi: 10.1152/jn.1998.80.2.964. [DOI] [PubMed] [Google Scholar]
- Wallis JD, Anderson KC, Miller EK. Single neurons in prefrontal cortex encode abstract rules. Nature. 2001;411:953–956. doi: 10.1038/35082081. [DOI] [PubMed] [Google Scholar]
- Watanabe M. Reward expectancy in primate prefrontal neurons. Nature. 1996;382:629–632. doi: 10.1038/382629a0. [DOI] [PubMed] [Google Scholar]
- White IM, Wise SP. Rule-dependent neuronal activity in the prefrontal cortex. Exp Brain Res. 1999;126:315–335. doi: 10.1007/s002210050740. [DOI] [PubMed] [Google Scholar]
- Williams ZM, Eskandar EN. Selective enhancement of associative learning by microstimulation of the anterior caudate. Nat Neurosci. 2006;9:562–568. doi: 10.1038/nn1662. [DOI] [PubMed] [Google Scholar]
- Yamamoto M, Pan X, Nomoto K, Sakagami M. Multiple neural circuits in value-based decision making. In: Delgado MR, Phelps EA, Robbins TW, editors. Decision making, affect and learning: Attention and performance. vol. XXIII. Oxford: Oxford UP; 2011. pp. 355–369. [Google Scholar]
- Yin HH, Knowlton BJ. The role of the basal ganglia in habit formation. Nat Rev Neurosci. 2006;7:464–476. doi: 10.1038/nrn1919. [DOI] [PubMed] [Google Scholar]