

Abstract
The propagation of activity in neural tissue is generally associated with synaptic transmission, but epileptiform activity in the hippocampus can propagate with or without synaptic transmission at a speed of ∼0.1 m/s. This suggests an underlying common nonsynaptic mechanism for propagation. To study this mechanism, we developed a novel unfolded hippocampus preparation, from CD1 mice of either sex, which preserves the transverse and longitudinal connections and recorded activity with a penetrating microelectrode array. Experiments using synaptic transmission and gap junction blockers indicated that longitudinal propagation is independent of chemical or electrical synaptic transmission. Propagation speeds of 0.1 m/s are not compatible with ionic diffusion or pure axonal conduction. The only other means of communication between neurons is through electric fields. Computer simulations revealed that activity can indeed propagate from cell to cell solely through field effects. These results point to an unexpected propagation mechanism for neural activity in the hippocampus involving endogenous field effect transmission.
Keywords: neural, activity, propagation, electric field, hippocampus, epileptiform
Introduction
The hippocampal circuitry is organized into lamellae, parallel strips of tissue (transverse plane) connected along a longitudinal direction (Amaral and Witter, 1989). Normal propagation through the hippocampus transverse plane is known to take place through the well-organized trisynaptic pathway. Propagation of electrical signals takes place also along the longitudinal septal–temporal axis (Gloveli et al., 2005). Epileptiform activity propagates at speeds of ∼0.1 m/s regardless of the experimental model (Table 1), suggesting the possibility of a common mechanism for epileptiform propagation in the hippocampus.
Table 1.
Propagation speeds of different types of activity in hippocampus ∼0.1 m/s
| Type of activity | Direction | Tissue preparation | Speed (m/s) | Reference |
|---|---|---|---|---|
| Electrical induced activation in CA3 cells in the presence of 4-AP | Longitudinally from temporal to septal side of hippocampus | Unfolded hippocampus | 0.09 ± 0.03 | Kibler and Durand, 2011 |
| Synchronous firing induced by stimulating mossy fibers in the presence of picrotoxin | Longitudinal | CA3 longitudinal slices | 0.14 ± 0.04 | Miles et al., 1988 |
| Multiunit activity induced by high K+ aCSF | CA3a-b to CA3c | Transverse slices | 0.07 to 0.1 | Liu et al., 2013 |
| Seizure-like activity induced by low Mg2+ aCSF | Between temporal poles of 2 hippocampus | 2 connected whole hippocampus | 0.1 to 0.15 | Quilichini et al., 2002 |
| Nonsynaptic fast bursting induced by low Ca2+ aCSF | Subicular end of CA1 to CA3 | Transverse slices | 0.1 | Haas and Jefferys, 1984 |
| Naturalistic θ oscillation in hippocampus of living rodent rats | Three directions longitudinally from septal to temporal (θ = 22°, θ = 3°, θ = −17°) | In vivo hippocampus (CA1 area) | 0.087, 0.087, 0.107 | Lubenov and Siapas, 2009 |
| θ oscillation induced by carbachol | Along CA3 cell layer | Transverse slices | 0.119 | Cappaert et al., 2009 |
| Along CA1 cell layer | 0.141 | |||
| Spontaneous response (SR) induced by 4-AP | Longitudinal direction | Unfolded hippocampus | 0.12 ± 0.03 | Current study (Fig. 4B) |
| Transverse direction | 0.10 ± 0.04 | |||
| SR induced by 4-AP with chemical synapses blocked | Longitudinal direction | Unfolded hippocampus | 0.12 ± 0.03 | Current study (Fig. 5D) |
| Transverse direction | 0.08 ± 0.04 | |||
| SR induced by 4-AP with gap junctions blocked | Longitudinal direction | Unfolded hippocampus | 0.10 ± 0.04 | Current study (Fig. 7C) |
| Transverse direction | 0.08 ± 0.02 |
Several studies have suggested that epileptiform activity can be generated by nonsynaptic mechanisms (Rozental et al., 2001; Cruikshank et al., 2004; Haglund and Hochman, 2005; Radman et al., 2007; Fröhlich and McCormick, 2010). One possibility is a propagating wave of increased ion concentration in the extracellular space leading to the extracellular potential changes propagating epileptiform activity (Lian et al., 2001). Another possibility is propagation through gap junctions (Rozental et al., 2001). In addition, electrical fields in the extracellular space surrounding the neurons can be a possible mechanism. Francis et al. (2003) found that extracellular voltages can be modified by the weak electrical fields around the soma and dendrites, and an externally applied electrical field with a similar amplitude could modulate pharmacologically evoked hippocampal network activity (Fröhlich and McCormick, 2010). Under physiological conditions in cortical neurons, endogenous brain activity can causally affect neural function through electrical field effect (Anastassiou et al., 2011). To uncover the common mechanism of propagation of interictal activity, we developed an unfolded hippocampal preparation in combination with a 64-channel microelectrode array (Kibler et al., 2012). Compared with voltage-sensitive dye techniques, the use of a penetrating microelectrode array provides a higher signal-to-noise ratio without concerns for photo-bleaching and tissue toxicity. The epileptogenic compound, 4-AP, generates hyperexcitability by blocking voltage-activated potassium channels and was used to induce propagating epileptiform activity in the hippocampus. As epileptiform activity in the hippocampus travels in both the longitudinal and transverse directions, transverse or longitudinal slices sever axonal pathways, thereby limiting the ability to fully monitor the spontaneous spread of propagation. The unfolded hippocampus (Fig. 1) offers the significant advantage of preserving both longitudinal and transverse pathways, leaving the connectivity between CA1 and CA3 intact (Kibler and Durand, 2011). Electrophysiological experiments to block synaptic transmission and gap junctions as well as computer simulation to test the electrical field effects were used to examine the role of synapses, gap junctions, and electrical field effect, respectively.
Figure 1.
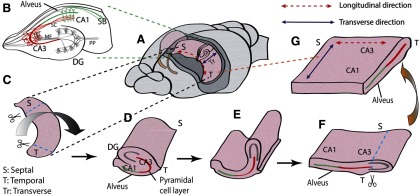
Unfolded hippocampal preparation. A, The two hippocampi were dissected from septal to temporal lobe. B, Typical hippocampal transverse slice with a well-known trisynaptic pathway in the transverse direction. Neural signals coming from the entorhinal cortex propagate through the perforant path (PP) to the granule cells in the DG, to the CA3 through the mossy fibers (MF), to the CA1 neurons, and to subiculum (SB). C, A single whole hippocampus removed using custom-made glass pipette tools. Septal and temporal ends were cut off before unfolding. D, Flipped hippocampus with a clear transverse side. A sharp glass needle was used to cut off the perforant path along hippocampal fissure, and a thin wire loop was inserted into hippocampal fissure to pull over the DG. E, DG was pulled to further flatten the unfolded curved structure. F, After unfolding, the alveus is positioned at the bottom, and the cell layer is nearly flat. The DG was cut off, leaving both CA3 and CA1. G, The final unfolded preparation contains both longitudinal and transverse paths of the pyramidal cells.
Materials and Methods
Tissue preparation.
Experimental protocols were reviewed and approved by the Institutional Animal Care and Use Committee. CD1 mice of either sex from Charles River (P10-P20) were anesthetized using isoflurane and then decapitated. Subsequently, the brain was rapidly removed and chilled in ice-cold (3–4°C) normal artificial CSF (aCSF) for ∼10 s. Next, the brain was sectioned twice, removing the cerebellum and separating the two hemispheres by a midline cutting. Fire-polished glass pipette tools were used to dissect the hippocampus out of the brain. The excised hippocampus was then placed on an ice-chilled glass Petri dish, and the septal and temporal ends were removed. Next, an ultra-fine glass needle was used to transect the perforant path through the hippocampal fissure before a wire loop was inserted to gently pull over the dentate gyrus (DG) and unfold the hippocampus (Kibler and Durand, 2011). Finally, the DG was removed, leaving both CA3 and CA1 intact (Fig. 1). This preparation therefore provides a flat CA1-CA3 plane to observe 2D propagation. Hippocampal transverse slices (Fig. 1B) were prepared as described previously (Lian et al., 2001). The brain was rapidly removed from a mouse and then glued to the stage of a vibratome (VT1000S, Leica Microsystems). Slices were cut to a thickness of 350 μm and then transferred to a bubbled aCSF chamber. Longitudinal slices were cut using a tissue chopper (Stoelting). A single hippocampus was dissected from the brain and cut along the longitudinal direction (see Fig. 6A). All hippocampal preparations were then transferred into a recovery solution of aCSF bubbled with 95% O2/5% CO2 and maintained at a room temperature (25°C) for at least 1 h before recording.
Figure 6.
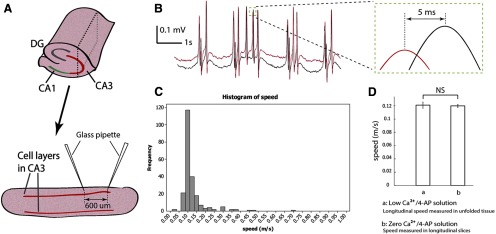
Velocity measurements in longitudinal slices. A, Longitudinal slices (350 μm thick) in CA3 were prepared by cutting the whole hippocampus along the longitudinal directions. The slice shown here was obtained from the plane marked with dashed line in the whole hippocampus. Two glass pipettes were placed 600 μm away by separate micromanipulators. The tips were located in basal dendrites close to the cell layers. B, Longitudinal slices were perfused with zero Ca2+/4-AP solution to block synaptic transmission. An example of the recording from the two glass pipettes is shown here. Similar positive spikes have been observed from the recording of the array (compared with Figs. 1, 3, and 4). Inset, Detail of a paired-spike. Cross-correlation is used to determine the delay. The speed of this example activity is 0.12 m/s. C, Histogram shows the activity detected under zero Ca2+/4-AP solution with EGTA (50 μM) in longitudinal slices (208 paired-spike from 4 slices) has a similar speed distribution as the histogram obtained with the array (Figs. 4B and 5D). The very low signal-to-noise ratio could affect the result of cross-correlation and resulted in some abnormally large speed values, such as 0.45 and 0.7 m/s shown in the figure. D, The speed detected in the longitudinal slices (0.13 ± 0.07 m/s) under zero Ca2+/4-AP solution with EGTA (50 μM) is similar to the longitudinal speed detected in the unfolded hippocampus (0.13 ± 0.03 m/s) from the array in low Ca2+/4-AP solution. NS, Not significant.
Array fabrication.
A custom-made 64-channel microelectrode array has been designed with high aspect ratio spikes as previously described (Kibler et al., 2012). In brief, spike tips have electrically active surfaces, which matched the input impedance of the amplifier. The body of the microelectrode is nonactive and was coated with a biocompatible insulation material. The distance between the centers of two neighboring electrodes is 400 μm in the x-direction and 300 μm in the y-direction in a pattern of an 8 × 8 matrix (Figs. 2A and 3A). The array was built on a transparent Pyrex glass substrate, and the glass chip was then glued and bonded to an open-top ceramic PGA package. A circular bath recording chamber was fixed to the glass substrate around the microelectrode array.
Figure 2.
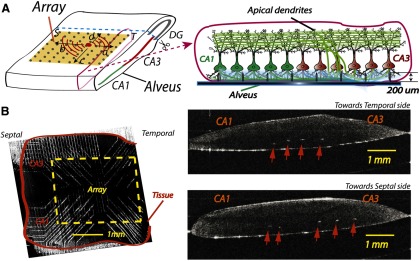
Penetrating microelectrode array for recording. A, Left, Unfolded hippocampus positioned on the microelectrode array. Activity from a spontaneous source (solid dot in the tissue) can travel in four possible directions: a, septal (S) to temporal (T); b, T to S; c, CA3 to CA1; d, CA3 to DG. Right, A transverse cross-section of the unfolded hippocampus with microelectrodes inserted into the tissue. B, A sample of the unfolded hippocampus placed on the array is imaged using OCT. Left, A tissue placed on the array. Right, Transverse slices of the tissue in different positions along the longitudinal directions. The white spots indicated by the arrows are the tips of the microelectrodes. The dark lines in the tissue show the pyramidal cell layers. The microelectrodes, with a height ∼200 μm, usually sit in the basal dendrites below the cell layer.
Figure 3.

A, Left, Picture taken from the bottom of the array. The dashed line indicates the approximate location of the border between CA3 and CA1 when an unfolded tissue was placed on the array. Right, Scanning electron micrograph of the array. Microelectrodes were lined in a matrix pattern with a distance of 400 μm in the x direction and 300 μm in the y direction. The fabrication details have been previously published (Kibler et al, 2012). Inset, A single microelectrode with 20-μm-wide diameter and 200-μm-high, thereby giving a very high aspect ratio of 10. B, As marked in A, channels a–c show the spontaneous responses induced by 4-AP. Top, An expanded view of one group of events from channel a. C, Individual normalization. Top, Sample recordings x, y, and z from 3 different channels in the same time window have different amplitudes. Bottom, Individual signals are normalized before mapping. The average of the signal in the time window (one-fifth of the total time length, shown in the green box) was centered to the middle of the color bar. Every channel was normalized to its own amplitude, which means that the amplitude from the baseline to the peak amplitude would occupy the upper half of the color bar, no matter how large the absolute amplitude of the original signal had been. D, The propagation map of the peak included in the dashed box in B (100 ms time window) for all the 64 channels. Bottom, One channel (from the dot in the first frame) normalized to the color bar. Color maps present the propagation process with a 5 ms time step between frames. The map shows that activity originated in the septal corner in CA3 and propagated from the septal to temporal (dashed line with arrow) area of this tissue and transversely (solid line with arrow) from CA3 to CA1 resulting a diagonal wave front.
Solution preparation.
Normal aCSF buffer consisted of the following (in mm): NaCl 124, KCl 3.75, KH2PO4 1.25, MgSO4 2, NaHCO2 26, dextrose 10, and CaCl2 2. 4-Aminopyridine (4-AP), a blocker of the Kv1 voltage-activated K+ channels, was used to induce epileptiform activity by increasing the resting membrane potential of cells, making the tissue hyperexcitable (Perreault and Avoli, 1989, 1992; Schechter, 1997). From previous studies, the interictal spiking induced by 4-AP was also considered as a spontaneous response and the amplitude of the spontaneous response detected from the pyramidal cells in CA3 was usually larger than that from CA1 (Perreault and Avoli, 1992; Luhmann et al., 2000). 4-AP was dissolved in aCSF to reach a final concentration of 100 μm to make 4-AP aCSF. Low Ca2+/4-AP aCSF consisted of the following (in mm): 4-AP 0.1, NaCl 124, KCl 5.25, KH2PO4 1.25, MgSO4 1.5, NaHCO3 26, dextrose 10, and CaCl2 0.2. Mefloquine, a potential antagonist for trans-membrane proteins Cx36, was used as a gap junction blocker (Cruikshank et al., 2004). Mefloquine/4-AP aCSF was made of the 4-AP aSCF with 50 μm mefloquine (Behrens et al., 2011), and mefloquine was dissolved in 1 ml of DMSO before added into the 4-AP aCSF. Zero Ca2+/4-AP aCSF with EGTA consisted of the following (in mm): 4-AP 0.1, NaCl 124, KCl 5.25, KH2PO4 1.25, MgSO4 1.5, NaHCO3 26, dextrose 10, and EGTA 0.05.
Recordings.
A PGA package connected the array to a circuit board so that each microelectrode was linked to a custom-made amplifier with a gain of 100 and bandpass filter from 1 Hz to 4 kHz (Kibler et al., 2012). Signals from the array were digitized by a DAP 5400a A/D system (Microstar Laboratories). Glass recording electrodes used to record field potentials from the cell layer were pulled from 1.0 mm (O.D.) × 0.5 mm (I.D.) borosilicate glass. Pipettes were filled with 150 mm NaCl solution and an Ag/AgCl wire connected the solution and a HS-2A head stage with a gain of 1 (Molecular Devices). The change of the voltage at the tip of the glass pipette electrode was then detected by an amplifier (AxoClamp 2B) and digitized at 44.1 kHz by an audio tape deck, DTC-ZE 7000 (MicroData Instruments). Stimulation was applied to the mossy fiber tract by passing negative current (400 μA) through a tungsten wire microelectrode (A-M Systems). The unfolded hippocampus was placed on the array with the alveus side at the bottom with electrode tips reaching the basal dendrites below the cell layer. The position of the electrode was confirmed using optical coherence tomography (OCT) (Fig. 2B). A custom-made tissue anchor was used to press the tissue down, securing it onto the array and preventing it from moving while allowing the microelectrodes to penetrate the tissue from the bottom. The tissue anchor was made of an insulated copper wire ring with Nylon fiber mesh glued across it, and the ring was further attached to an extension rod and positioned onto the tissue preparation using a micromanipulator. Normal aCSF was perfused into the chamber that was bubbled with 95% O2/5% CO2, and solution temperature was maintained at 35°C by using a heater with a thermo-regulator. A Michigan shank was inserted into the unfolded hippocampus along the dendritic–soma axis. Electrical field was calculated from potentials measured from two different electrodes on the shank: one in cell layer and one in apical dendrites. The Michigan shank was combined with a multichannel workstation with data acquisition (Alpha Omega).
Propagation mapping and speed analysis.
To analyze the propagation of spontaneous activity, the timing of the wave peaks was extracted from simultaneous recording (Haas and Jefferys, 1984; Holsheimer and Lopes da Silva, 1989) of the 64 recording channels. A color map was made to interpret time information of activity from the 64 channels. Low-pass filtering with a cutoff frequency of 300 Hz was applied in the original data to remove high-frequency noise. Each signal was then normalized while preserving the time information of the peaks (Fig. 3C). The color of each channel at a specific time was displayed simultaneously and represented as a pixel on a spatial map. Interpolation was applied to the original 64-pixel spatial map to provide spatial low pass filtering. To detect the propagation of the interictal spike, the color maps were displayed frame by frame in time series. Then, the speed was calculated in both transverse and longitudinal directions. Cross-correlation was used to determine the time delay between the peaks from the two different channels, and the average speed was calculated by v = L/Δt, where L is the distance from the first to the last channels and Δt is the time difference between the peaks from these two channels (see Fig. 4A).
Figure 4.
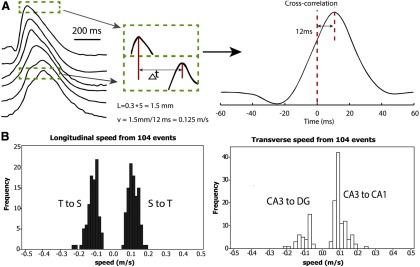
4-AP induced activity propagates at a similar speed in all four directions. A, Left, An example of the speed analysis, which was based on the timing of the peaks of the spontaneous spiking. Recordings obtained from 6 different channels in one row of the microelectrode array. The dashed box represents the peaks from the first and last channel in the same time window. Right, Cross-correlation was applied to the peaks in the time window to determine the time delay. B, Speed histograms of the spontaneous activity induced by 4-AP. The speed was calculated in both longitudinal and transverse axes bidirectionally, giving four propagation directions (also see Fig. 2A): septal-to-temporal (S to T), temporal-to-septal (T to S), CA3-to-CA1 and CA3-to-DG (within CA3, along the direction from CA3 to DG).
Computational modeling.
There is 1 compartment in the soma, 21 in the apical dendrites, and 11 in the basal dendrite. The dendritic cylinders have a diameter of 5.2 μm and length of 735.3 μm for the apical dendrite, and 490.2 μm for the basal dendrite. The passive membrane properties were set to the following values in Table 2. CA1 HPC model used five active currents in the somatic compartment as described previously (Warman et al., 1994; Shuai et al., 2003) in a Ca2+-free solution, as shown in Table 2. The conductances of leakage channels were as follows: gLsoma = 1 mS/cm2 and gLdend = 0.029 mS/cm2 (Migliore et al., 1999; Avoli et al., 2013). The rate functions (i.e., α, β) for all currents are based on previous studies (Avoli et al., 2013). The extracellular voltage Vex at a node of a cell due to the net current from the previous row (for the second and third row only) was calculated with the following equation:
where n is a node of the target cell, i is a node of a cell in the previous row, and the net extracellular voltage Vex(n) at a node n is calculated as a sum of the contribution of all nodes of all cells in the previous row, assuming homogeneous volume conductors and quasistatic formulation of the Maxwell equations. The delays of the resulting action potential of the middle cell in each row were collected, and the propagation speed is calculated using the distance between the middle points of two adjacent somas, 12 μm, divided by the time delays of the action potential peaks. The extracellular field for each row was measured by the virtual electrodes placed 35 μm outside of soma for first point and 127.55 μm above the first point for the second point. The field traveling speed was calculated by using the delays of the falling section of the curves (see Fig. 8B).
Table 2.
Parameters for computational model
| Parameters for passive membrane properties | Parameters for active currents with maximum conductance | ||
|---|---|---|---|
| Somatic membrane resistivity | Rmsoma = 680 Ωcm2 | Fast sodium current INa | gNa = 45 mS/cm2 |
| Somatic membrane capacitance | Cmsoma = 1.0 μF/cm2 | Persistent sodium current INaP | gNaP = 0.3 mS/cm2 |
| Dendritic membrane resistance | Rmdend = 34,200 Ωcm2 | Delayed rectifier current IDR | gDR = 10.0 mS/cm2 |
| Dendritic membrane capacitance | Cmdend = 1.88 μF/cm2 | A-type transient current IA | gA = 7 mS/cm2 |
| Axial (cytoplasmic) resistance | Ri = 530 Ωcm | Muscarinic current IM | gM = 3 mS/cm2 |
Figure 8.
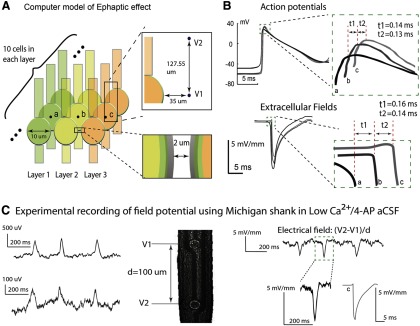
Propagation speed is consistent with electrical field-mediated transmission. A, A computer model was constructed to simulate a Ca2+-free, electrical field communication-only environment. The extracellular voltages V1 and V2 were measured at two points outside of the middle cell in each row. Top inset, The measurement for the center cell c in layer 3. Extracellular field is calculated by finding the spatial first difference of these two extracellular voltages. B, Top, Membrane potentials of the middle cell in each row. All cells in the first row were stimulated by an experimentally acquired extracellular signal. We observed a propagation speed of 0.086 m/s between the center cell (a) of the first row and the second row, and 0.092 m/s between the center cell (b) of the second row and that (c) of the third row. Bottom, Extracellular field waveforms outside of the center cells (a–c) in each row. The amplitudes of the three fields are 7.05, 5.77, and 5.05 mV/mm. The time delays between the first and second and between the second and the third row are 0.16 ms and 0.14 ms, respectively, and the corresponding propagation speeds are 0.075 m/s and 0.086 m/s. C, Experimental recording of field potential from Michigan electrode (left) and relative extracellular electrical field (right) in an unfolded hippocampus. The field amplitude ranges from 3 to 6 mV/mm, and the values are similar to those obtained computationally and shown in B. These results indicate that an electrical field effect could be responsible for propagation with an approximate speed of 0.1 m/s.
The value of factor F was based on the volume density found in previous histology studies. It was suggested that the CA1 neuronal volume density in rat hippocampus ranged from ∼115,000 to 123,000 neurons/mm3 (Ahmad et al., 2002). The thickness of a typical hippocampal slice usually ranges from 400 to 500 μm. With the model network, area equals to ∼4752 μm2 (distance between rows = 3 μm, area = 36 μm × 132 μm a stacking factor between 8 and 13 could be used in the model). For a factor F equal to 13, the delays of the resulting action potential of the middle cell in each row were found to be 0.12 and 0.13 m/s (see Fig. 8B), and the average traveling speed was 0.089 m/s across the three cell rows. The extracellular field for each row was measured 35 μm from the cell, showing a field that matches the amplitude obtained by the Michigan shank (see Fig. 8C). In addition, the average field traveling speed was measured as 0.081 m/s (see Fig. 8B), providing a nearly consistent speed to what was found from action potential peaks.
Results
4-AP-induced activity initiated in CA3 and propagated across the entire unfolded hippocampus at similar speeds
To induce epileptiform activity in the unfolded hippocampus, we incubated the tissue preparation in 4-AP (100 μm)/aCSF at room temperature for 3–5 min. Spontaneous neural activity appeared in the recordings and developed into a stable and large interictal bursting activity with 1–6 peaks in each individual event (Fig. 3B). During the experiments, there was no seizure activity observed and the interictal activity observed was similar to that previously reported (Perreault and Avoli, 1992; Avoli et al., 2013). A custom-made penetrating microelectrode array (Fig. 3A) was used to monitor the activity in this unfolded hippocampus. During an experiment with the same unfolded hippocampus, activity could start from either the septal or the temporal corner in the CA3 region and longitudinally propagate to the temporal or septal area, whereas some spiking activity was detected traveling transversely from CA3 to CA1. Use normalization (Fig. 3C), color maps show that the activity propagated as a diagonal wave across the tissue (Fig. 3D). When the origin of propagation was located within the area of the array, the propagation wave moved longitudinally from the septal to temporal region (51.5%, n = 97), as well as from the temporal to septal region (48.5%, n = 97). We then compared the propagation in the transverse and longitudinal directions (Fig. 4B). An example of the propagating wave is shown in Figure 4A. The speed of propagation in the longitudinal direction was found to be 0.12 ± 0.03 m/s (mean ± SD, n = 194). The speed was further analyzed in the temporal to septal direction (48.5%, 0.11 ± 0.03 m/s, n = 94) and septal to temporal direction (51.5%, 0.12 ± 0.03 m/s, n = 100). Statistical analysis shows that no significant difference was found between the speeds in different directions within longitudinal pathways. In the transverse directions, the speed was found to be very similar (0.10 ± 0.04 m/s, n = 139). Activity moved more frequently from CA3 to CA1 (72.8%, 0.10 ± 0.03 m/s, n = 102); however, activity would sometimes propagate within CA3 from CA3 toward the DG (27.2%, 0.10 ± 0.04 m/s, n = 37) (Fig. 4B). Again, no statistical difference was found between the speeds in these two directions. Together, the data show that spontaneous activity generally originated in the CA3 region and spread in both longitudinal and transverse directions, suggesting that the CA3 area in the hippocampus is the origin of the epileptiform propagation, as has been described previously (Barbarosie and Avoli, 1997; Luhmann et al., 2000). The data also show that the spontaneous activity could propagate in all four directions across the longitudinal and transverse pathways (Fig. 4B) independently of the connectivity. Moreover, the speed of propagation was the same in all directions (isotropic) even though the connectivity is known to be anisotropic: a universal monosynaptic transmission between CA3 to CA1 in the transverse direction and bidirectional in the longitudinal plane.
4-AP-induced epileptiform propagation does not depend on synaptic transmission
To investigate the mechanisms underlying the propagation of these epileptiform waves, we first blocked chemically mediated synaptic transmission without affecting the postsynaptic cells. Therefore, we sought to block presynaptic activity in the 4-AP aCSF solution by lowering the Ca2+ ion concentration, which has been shown to block synaptic transmission in hippocampal transverse slices (Haas and Jefferys, 1984; Lian et al., 2001). To verify that this solution did indeed block synaptic transmission, cathodic stimulation pulses were applied to the mossy fibers to elicit orthodromic responses in CA3 pyramidal cells. After ∼15 min of low Ca2+/4-AP solution perfusion, the evoked orthodromic response was suppressed, with only small residual fluctuation after the stimulus pulse (Fig. 5A). The block of synaptic transmission by low Ca2+ solution was compared with that induced by zero Ca2+ solution with EGTA (50 μm) (Figs. 5B and Fig. 6). No statistical differences between orthodromic response amplitudes were observed between the responses obtained in zero Ca2+ solution and those produced in low Ca2+ solution, showing that low Ca2+ solution effectively blocked synaptic transmission. However, the spontaneous activity was not totally eliminated but decreased by >75% in amplitude after the orthodromic response disappeared with the perfusion of low Ca2+/4-AP aCSF (Fig. 5A).
Figure 5.

Propagation is independent of synaptic transmission. A, Left, Inhibition of synaptic transmission by low Ca2+/4-AP solution perfusion. Orthodromic responses were recorded from pyramidal cells in CA3. The averaged responses shown here are 25 responses from 7 different experiments, for both 4-AP and low Ca2+/4-AP condition. Right, The change of the amplitude of spontaneous responses before and after applying low Ca2+/4-AP solution. B, Left, Synaptic transmission is blocked by low Ca2+/4-AP aCSF. Orthodromic response amplitudes decreased significantly with the perfusion of low calcium solution (25 samples). Data are mean ± SE. **p < 0.001. NS, Not significant. Right, A similar suppression of orthodromic response was observed with perfusion of zero calcium/4-AP aCSF and EGTA (50 μm). C, Wave propagation maps from all 64 channels in the same time window (marked in dashed box in A). Bottom, Coding to the color bar. In this example, the septal side is on the left and temporal side is on the right. Spontaneous activity in low Ca2+/4-AP aCSF initiated in the septal area of CA3 and propagated longitudinally. From 40 ms onward, the activity propagated longitudinally to the temporal side. D, Histograms of the speed recorded in all four directions from 7 different experiments.
Surprisingly, the propagation of this spontaneous activity under low Ca2+/4-AP aCSF solution exhibited a pattern similar to what was observed during perfusion of 4-AP aCSF at normal Ca2+ concentrations (Figs. 3D and 5C). Spontaneous activity traveled mainly longitudinally from septal to temporal regions of the hippocampus (82.4%, n = 74). In a few occasions, propagation in the opposite direction (i.e., from temporal to septal region) was observed as well (17.6%, n = 74). From a velocity analysis of these responses, we could determine that the source of propagation was always in the CA3 region. Thus, the CA3 region seems to be the origin of the epileptiform propagation under these experimental conditions. Transverse waves traveling from CA3 to CA1 (72.9%, n = 48) were observed more frequently than from CA3 to DG (27.1%, n = 48) and often appeared at the beginning and end of a propagation event within CA3. The average speeds for these propagating waves in low Ca2+/4-AP aCSF were 0.12 ± 0.03 m/s in the longitudinal direction (n = 146) and 0.08 ± 0.04 m/s in the transverse direction (n = 96) (Fig. 5D). ANOVA followed by post hoc Tukey's tests showed that transverse propagation (0.07 ± 0.02 m/s) in low calcium solutions was significantly slower than longitudinal propagation (0.13 ± 0.03 m/s). In addition, low Ca2+/4-AP aCSF significantly reduced the speed of the transverse propagation (30%); in contrast, low Ca2+/4-AP aCSF slightly increased (10%) the speed of longitudinal propagation (Fig. 7D).
Figure 7.
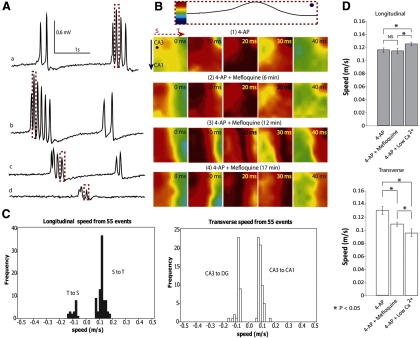
Propagation does not require gap junctions. A, Effect of mefloquine on the amplitude of 4-AP-induced spontaneous activity. Mefloquine has been shown to block the conduction of gap junctions effectively within 3 min (Cruikshank et al., 2004). Signals were obtained from one channel (the dot shown in B) in the array at different times as the tissue was incubated in mefloquine aCSF with 4-AP for >3 min. a, 4-AP aCSF only; b, after perfusion of mefloquine/4-AP aCSF for 6 min; c, after applying mefloquine/4-AP aCSF for 12 min; d, after applying mefloquine/4-AP aCSF for 17 min. The amplitude of the activity decreased with time. B, Top, The normalization of the peak from dashed box in A. The four rows of color maps (1–4) correspond to the peaks highlighted in the dashed boxes in A. Although the amplitude decreased, blockade of gap junctions did not stop the propagation of activity. C, Propagation speed histogram of the spontaneous activity from two unfolded hippocampus preparations after perfusion with mefloquine. The activity still traveled from the septal to temporal side but also traveled from temporal to septal side in a minority of cases. In the transverse direction, the source was always in CA3 and could travel from CA3 to CA1 or CA3 to DG depending on the location of the source. D, 4-AP-induced epileptiform activity was analyzed by separating transverse versus longitudinal propagation directions. Plots show the speed (mean ± SE) in both longitudinal (within CA3) and transverse directions. In the longitudinal direction (top), low Ca2+/4-AP aCSF did speed up propagation, whereas in the transverse direction (bottom), both mefloquine and low-Ca2+ solutions decreased the speed. *p < 0.05.
4-AP-induced epileptiform propagation in the longitudinal pathway is independent of electrical synaptic transmission
We next tested the hypothesis that gap junctions could explain the propagation of interictal activity in the absence of synaptic transmission. The Cx36 trans-membrane protein is highly expressed in the hippocampus (Behrens et al., 2011); therefore, mefloquine, a potent Cx36 antagonist (Cruikshank et al., 2004), was added to the 4-AP aCSF. Recordings from the array indicate that the amplitude of spontaneous activity decreased gradually by 80% following perfusion with 50 μm mefloquine 4-AP/aCSF (Fig. 7A). However, 4-AP-induced propagating activity persisted in the presence of mefloquine. The map of the propagation of a single spike indicates that the propagation waves detected in these experiments primarily traveled longitudinally (Fig. 7B). Additionally, the longitudinal propagation pattern in mefloquine/4-AP aCSF was also found in the spontaneous response in 4-AP aCSF and low Ca2+/4-AP aCSF. The average speeds of propagation along the longitudinal and transverse directions were 0.10 ± 0.04 m/s (n = 102) and 0.08 ± 0.02 m/s (n = 98), respectively (Fig. 7C). ANOVA followed by post hoc tests showed that mefloquine/4-AP aCSF significantly reduced transverse propagation, whereas the longitudinal propagation was unaffected by the gap junction blocker (Fig. 7D).
Propagation can be explained by electrical field effects
The observation that the 4-AP-induced propagation cannot be explained by synaptic transmission, gap junction, or diffusion suggests that electrical field transmission could be responsible because it is the only other known way for neurons to communicate. To test this possibility, we use the low osmolarity 4-AP aCSF to decrease the extracellular space volume, thereby increasing the effect of the electrical field. Experiments were carried out in the longitudinal slice because the field effect is strongest in that direction. Experiments have shown that the time delay between the signals measured from two glass pipettes located along the CA3 layer significantly (p < 0.001) decreased from 13.98 ± 4.08 ms (n = 86 spike-pair from 3 slices) to 9.06 ± 5.18 ms (n = 144 spike-pair from 3 slices in low osmolarity over 10 min) in the 4-AP aCSF with a decrease of the osmolarity by 15%. This decrease corresponds to a speed increase by 35% in lower osmolarity solutions. This result is consistent with the effect of low osmolarity on speed of propagation previously reported (Shahar et al., 2009). Furthermore, a NEURON computational model was developed to simulate a hippocampal CA1 pyramidal neuronal network in a Ca2+-free medium, synaptic transmission independent, and with electrical field coupling as the sole means of communication. The model was based on low-calcium neuron simulation developed earlier (Avoli et al., 2013); the parameters of the model were slightly modified but remained within the physiological ranges (Warman et al., 1994; Migliore et al., 1999). The network layout included three rows of neurons with 10 cells in each row (Fig. 8A) and an arbitrary factor F to simulate the cell density (see Materials and Methods). The network activity was initiated by placing at the first row an electrical field identical to that recorded experimentally by contacts of a Michigan probe placed within an unfolded hippocampus (Fig. 8C). The simulation results indicate that for a value of the factor F = 10 corresponding to a cell density of ∼120,000 cell/mm3 (Ahmad et al., 2002), the electrical field amplitudes were well within the physiological range (∼5 mV/mm) (Fig. 8B). Neural activity (both action potentials and electric fields) could propagate from cell layer to cell layer at a speed similar to that observed experimentally (0.09 m/s) across the three cell layers (Fig. 8B). Together, the experimental and simulation results support the hypothesis that epileptiform activity in low calcium solution propagates through electrical field transmission.
Discussion
Similar speeds have been observed in normal physiological activity and in vitro: theta waves were found to travel in CA1 from 0.087 to 0.107 m/s in freely behaving rats (Lubenov and Siapas, 2009) and theta waves generated by carbachol propagated at 0.119 m/s in CA3 and 0.141 m/s in CA1 in transverse slices (Cappaert et al., 2009) (Table 1). More interestingly, our results also indicate that epileptiform waves propagate at speeds ∼0.1 m/s under several different conditions, including 4-AP, low Ca2+/4-AP, or mefloquine/4-AP (Figs. 4B, 5D, 6C,D, and 7C,D). The fact that 4-AP-induced epileptiform activity could propagate at the same speed in different physiological situations suggests the possibility that a novel nonsynaptic mechanism underlies propagation in neural tissue.
There are four well-known mechanisms of neuronal communication that could mediate propagation of activity between neurons: synaptic transmission, gap junctions, ionic diffusion, and electrical field effects. It has been reported that chemical synapses in the transverse direction and synaptic recurrent excitation in the longitudinal direction in CA3 are responsible for the propagation of seizure-like activity in the hippocampus (Gloveli et al., 2005; Kibler and Durand, 2011). However, the propagation in low Ca2+/4-AP aCSF reported above shows that synaptic transmission is not always required (Haas and Jefferys, 1984; Bikson et al., 1999). In the present study, the activity not only persisted under low Ca2+/4-AP aCSF, but there was a significant increase of propagation speed (Fig. 7D), indicating that the propagation in the hippocampus bypassed chemically mediated synaptic transmission. Synaptic transmission and axonal conduction are normally required for orthodromic activity. Axonal conduction velocity in the hippocampus varies from 0.3 to 0.5 m/s, depending on the specific type of axon investigated (Table 3). Therefore, the speed of epileptiform waves ∼0.1 m/s cannot be explained by pure axonal conduction, either.
Table 3.
Propagation speed for axonal conduction in hippocampus
| Type of activity | Tissue preparation | Speed (m/s) | Reference |
|---|---|---|---|
| The conduction velocity for presynaptic axons | Longitudinal slices in vitro (CA3 area) | 0.48 ± 0.10 | Miles et al., 1988 |
| Action potential velocity in CA3 pyramidal axons | Transverse slices in vitro | From 0.3 to 0.4 | Meeks and Mennerick, 2007 |
| Conduction velocity of alvear compound action potential | Transverse slices in vitro | 0.54 ± 0.14 | Jensen, 2008 |
| Axon propagation along CA3 | Unfolded hippocampus | 0.31 ± 0.08 | Kibler and Durand, 2011 |
The second type of direct neural communication is gap junctions. Connexin-36 is present in gap junctions on mossy fiber axons and was found to play a role in the generation of neural oscillations (Hamzei-Sichani et al., 2007). However, most gap junctions were found between glia cells, not between pyramidal cells. In our study, 4-AP-induced epileptiform activity could still propagate in the presence of mefloquine, suggesting that the propagation detected in this unfolded hippocampus is gap junction independent (Fig. 7A–C). Although the speed of longitudinal propagation was not altered by mefloquine, we did observe a significant reduction of the speed of transverse propagation, indicating that gap junctions could still play a role there (Fig. 7D).
Ionic diffusion has been shown to propagate through neural tissue, but its speed is considerably slower (Table 4). For example, the seizure-like activity caused by the diffusion of the K+ ions propagates at speeds from 0.0004 to 0.008 m/s (Weissinger et al., 2000; Lian et al., 2001). In the low calcium preparation, propagation of activity at a similar low speed (0.001 m/s) has been reported, but at the same time activity was also observed to propagate at higher speeds (0.1 m/s), indicating two different modes of propagation by very different nonsynaptic mechanisms (Haas and Jefferys, 1984). Computer simulations of the diffusion mechanism also predict speeds ∼100 times slower than that reported here (Durand et al., 2010).
Table 4.
Propagation speed for activity conducted by ionic diffusion in hippocampus
| Type of activity | Tissue preparation | Speed (m/s) | Reference |
|---|---|---|---|
| Spontaneous and evoked seizure-like events related to K+ diffusion | Transverse slices | From 0.00044 to 0.0042 | Konnerth et al., 1986 |
| Seizure-like events related to K+ diffusion | Hippocampal cortex slice | From 0.0018 to 0.0083 | Weissinger et al., 2000 |
| Low-Ca2+ bursting corresponding to K+ diffusion | Transverse slices | From 0.00068 to 0.00282 | Lian et al., 2001 |
| Potassium wave propagation velocity | Transverse slices | 0.001 | Durand et al., 2010 |
Having ruled out synaptic transmission, gap junctions, and diffusion as possible mechanisms of epileptiform propagation, we considered the possibility that electrical field effects could mediate propagation within a narrow speed range ∼0.1 m/s in a variety of different settings.
Electrical field effect between neurons is normally thought to be too small to mediate propagation but could be much more relevant here because the cellular packing in the hippocampus is highly structured and dense, and endogenous local fields could have a large effect on synchronization of neurons (Francis et al., 2003). Electrical field effect also has to been shown to effectively synchronize neurons and axons and allow for specific patterns of action potential timing with relatively constant propagation speeds (Bokil et al., 2001; Richardson et al., 2005; Radman et al., 2007). Active networks are susceptible to endogenous or external applied electric fields that initiate small changes in membrane potential in individual neurons (Anastassiou et al., 2010; Fröhlich and McCormick, 2010). In particular, it has been reported that low Ca2+ conditions can increase the volume of cells by affecting Ca2+-K+ pumps (Haas and Jefferys, 1984), lowering the osmolarity in the tissue (Borgdorff et al., 2000; Durand, 2003), and enhancing propagation speed (Shahar et al., 2009). This is in line with our observation that the longitudinal propagation speed through CA3 was significantly higher in low Ca2+/4-AP aCSF (Fig. 7D). A similar effect has been observed in the computational model created for a bundle of axons by changing the extracellular space (Bokil et al., 2001). The amplitudes of the extracellular fields generated in our experiments (3–6 mV/mm) are similar to those known to generate electrical field effects in hippocampal slices (∼5 mV/mm) (Ghai et al., 2000; Radman et al., 2007) and in the cortex (up to 4.52 mV/mm) (Fröhlich and McCormick, 2010). Computer simulations of a group of pyramidal neurons connected solely through electrical field effects did show that neural activity could in fact propagate from layer to layer at the speed observed experimentally (Fig. 8B). Extracellular fields similar in amplitude to those measured in 4-AP are known to modulate neuronal membrane potential via electrical field effect independently of synapses (Francis et al., 2003; Anastassiou et al., 2011). These small fields have also been shown to be able to entrain action potentials (Anastassiou et al., 2011), and neurons can be coupled through electrical field to the frequencies of local field potentials (Jefferys, 1995). In addition, increasing the space between neurons in the model decreased the coupling between neurons and prevented propagation (data not shown). This prediction of the model is validated by experiments that increased the extracellular space using mannitol or furosemide and clearly decreased epileptic activity in the human brain (Haglund and Hochman, 2005).
Conclusion
In conclusion, the results obtained in this study show that 4-AP-induced spontaneous epileptiform activity in an unfolded hippocampus preparation can propagate in both the transverse and longitudinal directions with a speed of 0.1 m/s independently of connectivity. Moreover, this activity propagates at the same speed in the absence of synaptic transmission and gap junctions in the longitudinal plane. Because this speed cannot be accounted for by diffusion or axonal propagation, these results suggest that a nonsynaptic mechanism is responsible for the propagation of this spontaneous activity. This mechanism of propagation is consistent with electrical field transmission but could be limited to the hippocampus proper, where neurons are organized into tight layers. This type of propagation does not limit the role of synaptic transmission in the hippocampus as a means of propagation of epileptiform activity but rather points to the existence of a common underlying mechanism that can synchronize and propagate neural activity in the presence or absence of synaptic transmission. These results therefore reveal a novel mechanism for the propagation of abnormal neural activity in the brain that could lead to the development of new therapeutic modalities for seizure control. The new methods would be aimed at controlling the electrical fields in the extracellular space by manipulating its volume or by adding additional electrical fields to disrupt the spread of epileptiform activity in the hippocampus specifically by interfering with electrical fields of transmission.
Footnotes
This work was supported by National Institutes of Health (National Institute of Neurological Disorders and Stroke) Grant 1R01NS060757-01 and by the E.L. Lindseth endowed chair to D.M.D. We thank Dr. Andrew B. Kibler for the design and fabrication of the microelectrode array and custom-made recording amplifier; Dr. Andrew Rollins's laboratory for help with the OCT imaging; and Drs. M. Bikson, R. Galan, and H. Chiel for their helpful comments in reviewing this manuscript.
The authors declare no competing financial interests.
References
- Ahmad A, Murthy M, Greiner RS, Moriguchi T, Salem N., Jr A decrease in cell size accompanies a loss of docosahexaenoate in the rat hippocampus. Nutr Neurosci. 2002;5:103–113. doi: 10.1080/10284150290018973. [DOI] [PubMed] [Google Scholar]
- Amaral DG, Witter MP. The three-dimensional organization of the hippocampal formation: a review of anatomical data. Neuroscience. 1989;31:571–591. doi: 10.1016/0306-4522(89)90424-7. [DOI] [PubMed] [Google Scholar]
- Anastassiou CA, Montgomery SM, Barahona M, Buzsáki G, Koch C. The effect of spatially inhomogeneous extracellular electric fields on neurons. J Neurosci. 2010;30:1925–1936. doi: 10.1523/JNEUROSCI.3635-09.2010. [DOI] [PMC free article] [PubMed] [Google Scholar]
- Anastassiou CA, Perin R, Markram H, Koch C. Ephaptic coupling of cortical neurons. Nat Neurosci. 2011;14:217–223. doi: 10.1038/nn.2727. [DOI] [PubMed] [Google Scholar]
- Avoli M, Curtis MD, Köhling R. Does interictal synchronization influence ictogenesis? Neurophamacology. 2013;69:37–44. doi: 10.1016/j.neuropharm.2012.06.044. [DOI] [PMC free article] [PubMed] [Google Scholar]
- Barbarosie M, Avoli M. CA3-driven hippocampal-entorhinal loop controls rather than sustains in vitro limbic seizures. J Neurosci. 1997;17:9308–9314. doi: 10.1523/JNEUROSCI.17-23-09308.1997. [DOI] [PMC free article] [PubMed] [Google Scholar]
- Behrens CJ, Ul Haq R, Liotta A, Anderson ML, Heinemann U. Nonspecific effects if the gap junction blocker Meflqoquine on fast hippocampal network oscillation in the adult rat in-vitro. Neuroscience. 2011;192:11–19. doi: 10.1016/j.neuroscience.2011.07.015. [DOI] [PubMed] [Google Scholar]
- Bikson M, Ghai RS, Baraban SC, Durand DM. Modulation of burst frequency, duration, and amplitude in the zero-Ca2+ model of epileptiform activity. J Neurophysiol. 1999;82:2262–2270. doi: 10.1152/jn.1999.82.5.2262. [DOI] [PubMed] [Google Scholar]
- Bokil H, Laaris N, Blinder K, Ennis M, Keller A. Ephaptic interactions in the mammalian olfactory system. J Neurosci. 2001;21:RC173. doi: 10.1523/JNEUROSCI.21-20-j0004.2001. [DOI] [PMC free article] [PubMed] [Google Scholar]
- Borgdorff AJ, Somjen GG, Wadman WJ. Two mechanisms that raise free intracellular calcium in rat hippocampal neurons during hypoosmotic and low NaCl treatment. J Neurophysiol. 2000;83:81–89. doi: 10.1152/jn.2000.83.1.81. [DOI] [PubMed] [Google Scholar]
- Cappaert NL, Lopes da Silva FH, Wadman WJ. Spatio-temporal dynamics of theta oscillations in hippocampal–entorhinal slices. Hippocampus. 2009;19:1065–1077. doi: 10.1002/hipo.20570. [DOI] [PubMed] [Google Scholar]
- Cruikshank SJ, Hopperstad M, Younger M, Connors BW, Spray DC, Srinivas M. Potent block of Cx36 and Cx50 gap junction channels by mefloquine. Proc Natl Acad Sci U S A. 2004;101:12364–12369. doi: 10.1073/pnas.0402044101. [DOI] [PMC free article] [PubMed] [Google Scholar]
- Durand DM. Electric field effects in hyperexcitable neural tissue: a review. Radiat Prot Dosimetry. 2003;106:325–331. doi: 10.1093/oxfordjournals.rpd.a006368. [DOI] [PubMed] [Google Scholar]
- Durand DM, Park EH, Jensen AL. Potassium diffusive coupling in neural networks. Philos Trans R Soc Lond B Biol Sci. 2010;365:2347–2362. doi: 10.1098/rstb.2010.0050. [DOI] [PMC free article] [PubMed] [Google Scholar]
- Francis JT, Gluckman BJ, Schiff SJ. Sensitivity of neurons to weak electric fields. J Neurosci. 2003;23:7255–7261. doi: 10.1523/JNEUROSCI.23-19-07255.2003. [DOI] [PMC free article] [PubMed] [Google Scholar]
- Fröhlich F, McCormick DA. Endogenous electric fields may guide neocortical network activity. Neuron. 2010;67:129–143. doi: 10.1016/j.neuron.2010.06.005. [DOI] [PMC free article] [PubMed] [Google Scholar]
- Ghai RS, Bikson M, Durand DM. Effects of applied electric fields on low-calcium epileptiform activity in the CA1 region of rat hippocampal slices. J Neurophysiol. 2000;84:274–280. doi: 10.1152/jn.2000.84.1.274. [DOI] [PubMed] [Google Scholar]
- Gloveli T, Dugladze T, Rotstein HG, Traub RD, Monyer H, Heinemann U, Whittington MA, Kopell NJ. Orthogonal arrangement of rhythm-generating microcircuits in the hippocampus. Proc Natl Acad Sci U S A. 2005;102:13295–13300. doi: 10.1073/pnas.0506259102. [DOI] [PMC free article] [PubMed] [Google Scholar]
- Haas HL, Jefferys JG. Low-calcium field burst discharges of CA1 pyramidal neurones in rat hippocampal slices. J Physiol. 1984;354:185–201. doi: 10.1113/jphysiol.1984.sp015371. [DOI] [PMC free article] [PubMed] [Google Scholar]
- Haglund MM, Hochman DW. Furosemide and mannitol suppression of epileptic activity in the human brain. J Neurophysiol. 2005;94:907–918. doi: 10.1152/jn.00944.2004. [DOI] [PubMed] [Google Scholar]
- Hamzei-Sichani F, Kamasawa N, Janssen WG, Yasumura T, Davidson KG, Hof PR, Wearne SL, Stewart MG, Young SR, Whittington MA, Rash JE, Traub RD. Gap junctions on hippocampal mossy fiber axons demonstrated by thin-section electron microscopy and freeze fracture replica immunogold labeling. Proc Natl Acad Sci U S A. 2007;104:12548–12553. doi: 10.1073/pnas.0705281104. [DOI] [PMC free article] [PubMed] [Google Scholar]
- Holsheimer J, Lopes da Silva FH. Propagation velocity of epileptiform activity in the hippocampus. Exp Brain Res. 1989;77:69–78. doi: 10.1007/BF00250568. [DOI] [PubMed] [Google Scholar]
- Jefferys J. Nonsynaptic modulation of neuronal activity in the brain: electric currents and extracellular ions. Physiol Rev. 1995;75:689–723. doi: 10.1152/physrev.1995.75.4.689. [DOI] [PubMed] [Google Scholar]
- Jensen AL. Control of axonal conduction by high frequency stimulation. Cleveland: Case Western Reserve University; 2008. p. 202. [Google Scholar]
- Kibler AB, Durand DM. Orthogonal wave propagation of epileptiform activity in the planar mouse hippocampus in vitro. Epilepsia. 2011;52:1590–1600. doi: 10.1111/j.1528-1167.2011.03125.x. [DOI] [PMC free article] [PubMed] [Google Scholar]
- Kibler AB, Jamieson BG, Durand DM. A high aspect ratio microelectrode array for mapping neural activity in vitro. J Neurosci Methods. 2012;204:296–305. doi: 10.1016/j.jneumeth.2011.11.027. [DOI] [PMC free article] [PubMed] [Google Scholar]
- Konnerth A, Heinemann U, Yaari Y. Nonsynaptic epileptogenesis in the mammalian hippocampus in vitro: I. Development of seizurelike activity in low extracellular calcium. J Neurophysiol. 1986;56:409–423. doi: 10.1152/jn.1986.56.2.409. [DOI] [PubMed] [Google Scholar]
- Lian J, Bikson M, Shuai J, Durand DM. Propagation of non-synaptic epileptiform activity across a lesion in rat hippocampal slices. J Physiol. 2001;537:191–199. doi: 10.1111/j.1469-7793.2001.0191k.x. [DOI] [PMC free article] [PubMed] [Google Scholar]
- Liu JS, Li JB, Gong XW, Gong HQ, Zhang PM, Liang PJ, Lu QC. Spatiotemporal dynamics of high-K+-induced epileptiform discharges in hippocampal slice and the effects of valproate. Neurosci Bull. 2013;29:28–36. doi: 10.1007/s12264-013-1304-4. [DOI] [PMC free article] [PubMed] [Google Scholar]
- Lubenov EV, Siapas AG. Hippocampal θ oscillations are travelling waves. Nature. 2009;459:534–539. doi: 10.1038/nature08010. [DOI] [PubMed] [Google Scholar]
- Luhmann HJ, Dzhala VI, Ben-Ari Y. Generation and propagation of 4-AP-induced epileptiform activity in neonatal intact limbic structures in vitro. Eur J Neurosci. 2000;12:2757–2768. doi: 10.1046/j.1460-9568.2000.00156.x. [DOI] [PubMed] [Google Scholar]
- Meeks JP, Mennerick S. Action potential initiation and propagation in CA3 pyramidal axons. J Neurophysiol. 2007;97:3460–3472. doi: 10.1152/jn.01288.2006. [DOI] [PubMed] [Google Scholar]
- Migliore M, Hoffman DA, Magee JC, Johnston D. Role of an A-type K+ conductance in the back-propagation of action potentials in the dendrites of hippocampal pyramidal neurons. J Comput Neurosci. 1999;7:5–15. doi: 10.1023/A:1008906225285. [DOI] [PubMed] [Google Scholar]
- Miles R, Traub RD, Wong RK. Spread of synchronous firing in longitudinal slices from the CA3 region of the hippocampus. J Neurophysiol. 1988;60:1481–1496. doi: 10.1152/jn.1988.60.4.1481. [DOI] [PubMed] [Google Scholar]
- Perreault P, Avoli M. Effects of low concentrations of 4-aminopyridine on CA1 pyramidal cells of the hippocampus. J Neurophysiol. 1989;61:953–970. doi: 10.1152/jn.1989.61.5.953. [DOI] [PubMed] [Google Scholar]
- Perreault P, Avoli M. 4-Aminopyridine-induced epileptiform activity and a GABA-mediated long-lasting depolarization in the rat hippocampus. J Neurosci. 1992;12:104–115. doi: 10.1523/JNEUROSCI.12-01-00104.1992. [DOI] [PMC free article] [PubMed] [Google Scholar]
- Quilichini PP, Diabira D, Chiron C, Ben-Ari Y, Gozlan H. Persistent epileptiform activity induced by low Mg2+ in intact immature brain structures. Eur J Neurosci. 2002;16:850–860. doi: 10.1046/j.1460-9568.2002.02143.x. [DOI] [PubMed] [Google Scholar]
- Radman T, Su Y, An JH, Parra LC, Bikson M. Spike timing amplifies the effect of electric fields on neurons: implications for endogenous field effects. J Neurosci. 2007;27:3030–3036. doi: 10.1523/JNEUROSCI.0095-07.2007. [DOI] [PMC free article] [PubMed] [Google Scholar]
- Richardson KA, Schiff SJ, Gluckman BJ. Control of traveling waves in the mammalian cortex. Phys Rev Lett. 2005;94 doi: 10.1103/PhysRevLett.94.028103. 028103. [DOI] [PMC free article] [PubMed] [Google Scholar]
- Rozental R, Andrade-Rozental AF, Zheng X, Urban M, Spray DC, Chiu FC. Gap junction-mediated bidirectional signaling between human fetal hippocampal neurons and astrocytes. Dev Neurosci. 2001;23:420–431. doi: 10.1159/000048729. [DOI] [PubMed] [Google Scholar]
- Schechter LE. The potassium channel blockers 4-aminopyridine and tetraethylammonium increase the spontaneous basal release of [3H]5-hydroxytryptamine in rat hippocampal slices. J Pharmacol Exp Ther. 1997;282:262–270. [PubMed] [Google Scholar]
- Shahar E, Derchansky M, Carlen PL. The role of altered tissue osmolality on the characteristics and propagation of seizure activity in the intact isolated mouse hippocampus. Clin Neurophysiol. 2009;120:673–678. doi: 10.1016/j.clinph.2009.01.014. [DOI] [PubMed] [Google Scholar]
- Shuai J, Bikson M, Hahn PJ, Lian J, Durand DM. Ionic mechanisms underlying spontaneous CA1 neuronal firing in Ca2+-free solution. Biophys J. 2003;84:2099–2111. doi: 10.1016/S0006-3495(03)75017-6. [DOI] [PMC free article] [PubMed] [Google Scholar]
- Warman EN, Durand DM, Yuen GL. Reconstruction of hippocampal CA1 pyramidal cell electrophysiology by computer simulation. J Neurophysiol. 1994;71:2033–2045. doi: 10.1152/jn.1994.71.6.2033. [DOI] [PubMed] [Google Scholar]
- Weissinger F, Buchheim K, Siegmund H, Heinemann U, Meierkord H. Optical imaging reveals characteristic seizure onsets, spread patterns, and propagation velocities in hippocampal-entorhinal cortex slices of juvenile rats. Neurobiol Dis. 2000;7:286–298. doi: 10.1006/nbdi.2000.0298. [DOI] [PubMed] [Google Scholar]