

Abstract
OBJECTIVE
To examine the association between brain atrophy during life and neuropathology in an elderly population.
DESIGN
Cohort study of community dwelling elderly
PARTICPANTS
Seventy-one healthy elderly were selected from participants of the Oregon Brain Aging Study for having an autopsy, >1 MRI scan and the last MRI scan within 36 months of death.
MAIN OUTCOME MEASURES
The associations between brain volume trajectories (ventricular, total brain and hippocampal) and time interaction terms for neurofibrillary tangles (NFTs), neuritic plaques (NPs), gross infarcts, microinfarcts, amyloid angiopathy, Lewy bodies, APOE ε4 presence, and clinical diagnosis (no cognitive impairment, mild cognitive impairment (MCI) and dementia, as time varying covariates) were examined in mixed effects models, adjusting for duration of follow up and age at death.
RESULTS
Ventricular volume trajectory was significantly associated with age, presence of infarcts, NFT and NP scores, the ε4 allele and dementia diagnosis. Total brain volume trajectory was significantly associated with age, and MCI diagnosis. Hippocampal volume trajectory was significantly associated with amyloid angiopathy.
CONCLUSION
Ventricular volume trajectory is more sensitive than total brain and hippocampal volume trajectories as a marker of accruing Alzheimer disease and vascular pathology in elderly individuals. The association between brain volume trajectories and cognitive impairment (MCI and dementia) remained after controlling for the degree of neuropathology and other covariates. This suggests that there may be other factors, not measured in this study that may be contributing to brain atrophy in those with cognitive impairment.
Search Terms: Alzheimer’s disease, volumetric MRI, cohort studies
Introduction
There is an increasing body of evidence that the clinical syndrome of Alzheimer disease (AD) in the elderly may have a different pathologic correlate compared to younger individuals with AD1–3. The contribution of mixed pathologies, especially AD and vascular pathology, to the clinical dementia syndrome in the elderly has been replicated in several autopsy series4–6. These observations have led to timely editorials and reviews discussing whether: 1) the clinical syndrome of AD across the age spectrum truly represents the same pathophysiological mechanisms, and 2) whether there should be separate interventions aimed at treatment and prevention of AD in young onset (<60 years old), intermediate onset (60–85 years) and late onset (85+) cases7–9.
A related question is that of the neuropathologic correlates of longitudinal brain atrophy in the elderly. Brain volume changes are used as surrogate markers for AD neuropathology in clinical trials and biomarker studies. Yet, the extent to which these changes are due to pathologic features of AD in the aging brain is not well established. This study aims at clarifying the neuropathologic correlates of longitudinal brain atrophy in an elderly community-based population.
To our knowledge, there are only two longitudinal studies that correlated brain atrophy during life with neuropathologic measures obtained after death 10, 11. These studies had discrepant findings. One of these studies found that ventricular and total brain volume changes were associated with both NP and NFT burden in the cognitively impaired (but not intact) individuals11. The other study only found a correlation between NFTs and brain volume changes, but found no correlation between a measure of total amyloid (that includes vascular and both diffuse and neuritic plaques) and brain volume changes 10. We postulate that these discrepancies are a result of the age distribution of study participants in these studies (range 49–101 versus 68.9–106.2 years old), as well as the differences in the timing of MRI scans (in relation to disease status and death). Our study specifically aims at understanding the correlation between AD neuropathology and longitudinal brain atrophy in a homogenous sample of elderly who all had their first scan before onset of dementia. Our hypothesis is that, as has been observed with neuropathologic correlates of cognitive decline in the elderly 12, a mix of AD neuropathology and vascular disease will be associated with brain atrophy over time.
Methods
Participants
Participants were healthy elderly followed as part of the Oregon Brain Aging Study (OBAS) 13. OBAS began in 1989 at the National Institute on Aging’s Alzheimer’s Disease Center at Oregon Health & Science University (OHSU) 14. Community dwelling elderly ≥ 55 years old, who had no functional impairment, with no comorbid illnesses; a baseline Mini-Mental State Examination (MMSE) score >23 15, a Clinical Dementia Rating (CDR) Scale score of 0 16 and exhibited no depression by screening with the Geriatric Depression Scale were included 17. In 2004, entry criteria were modified to include subjects with well-controlled, chronic medical conditions common with advanced age, such as hypertension and coronary artery disease, in order to include participants more representative of the general population. Of the 376 subjects evaluated between 1989 and 2005, 305 met inclusion criteria and were enrolled. Of those 305 who were enrolled, 293 were ≥ 65 years old. Attrition rates caused byloss to follow-up other than death were less than 1% per year. The Institutional Review Boards of OHSU and the Portland Veterans Affairs Medical Center approved the studies. All volunteers signed written informed consent. Volunteers were examined every six months with the MMSE 15, CDR scale16, Cognistat18 and neurological examination. Annually, a detailed battery of neuropsychological tests and brain MRI scans were performed 13,19. Performances on the MMSE and Cognistat were included in the CDR rating. APOE was genotyped using standard methods. Of the 193 OBAS participants who died during follow up, 125 had an autopsy at death. Individuals with autopsy were older at entry to the study, and at death, but showed no differences in sociodemographic parameters, APOE4 allele distribution, duration of follow up and diagnoses compared to those that did not have an autopsy. In this study, participants were categorized into three cognitive groups based on their CDR rating: no cognitive impairment (NCI) (CDR=0), mild cognitive impairment (MCI)(CDR = 0.5 and not meeting diagnostic criteria for dementia), and dementia (CDR ≥ 0.5 and meeting diagnostic criteria for dementia). Diagnoses of possible or probable AD, vascular dementia and mixed dementia were made according to established clinical criteria 20, 21. Each patient had a diagnosis assigned at each MRI time point.
Inclusion & Exclusion Criteria
OBAS volunteers were included if they: 1) had ≥ 2 MRI scans and, the last scan was performed within 36 months of death, 2) had cognitive evaluation done within 24 months of death, 3) had brain autopsy at death. Of the 125 subjects with autopsy, 74 met the above criteria. Three outliers with brain volumes > 3 standard deviations from the mean at any time point were excluded. The remaining 71 volunteers were included in this study.
MRI Methods
MR images were acquired with a1.5-T magnet. The protocol consisted of continuous-slice, multiecho, multiplanar image acquisition, with 4-mm-thick coronal slices and a 24-cm2 field of view using a 256 x 256 acquisition matrix with two excitations (repetition time, 2800 msec; echo time, 30 and 80 msec). To orient the coronal plane, TI-weighted sagittal images (TR = 600 msec, TE = 20 msec); centered in the midsagittal plane were used. REGION, a semi-automated image assessment program, was used for quantitative measurement of brain volumes19, 22. Image analysts were blind to the volunteers’ clinical data and previous imaging results. Image analysis methods have been described previously22. Intra-class correlation coefficient, assessing inter-rater reliability for volume measurements for all regions, was ≥ 0.9. Hippocampal, total brain and ventricular volumes were measured as a proportion of intracranial volume.
Pathological Methods
Brains were examined for NFT and NP pathology and staged by Braak and Braak, and Consortium to Establish a Registry for Alzheimer’s Disease (CERAD) systems 23–25. Neuropathological evaluation has been described previously 26. Brains were examined grossly as well as microscopically after being fixed in neutral-buffered formaldehyde solution for at least 2 weeks. For microscopic evaluation, tissue samples were taken from all cortical lobes bilaterally, frontal lobe white matter, anterior cingulate gyrus, hippocampus, amygdala, bilateral striatum and thalamus, midbrain, pons, medulla, and cerebellum. Plaques and tangles were assessed unilaterally in most cases; cerebrovascular disease was assessed bilaterally. Six-micrometer sections from all these brain regions were stained with hematoxylin and eosin with Luxol fast blue stain for myelin (H&E/LFB). An occipital cortical section was stained with Congo red to evaluate the degree of amyloid angiopathy. A modified Bielschowsky silver impregnation method was used to identify diffuse and neuritic plaques in the frontal and parietal cortex. Selected sections of the hippocampus and neocortical regions were immunostained with antibody to tau (tau2, Sigma, St. Louis, MO). The presence of lacunar infarcts and large vessel strokes were evaluated both by visual inspection and microscopic examination. Lesions were classified as microinfarcts if there was histologic evidence of tissue necrosis and gliosis that was not identified at gross examination of the brain. Subjects were coded to have gross infarcts if lacunes or large vessel infarcts were present. The presence of Lewy bodies was determined histologically in the midbrain and nucleus locus coeruleus by evaluation of H&E/LFB-stained sections and by anti-alpha-synuclein immunohistochemistry performed on sections of amygdala and frontal cortex. Hippocampal sclerosis was coded as present or not present. Braak stages were coded into three groups, low (no NFTs or stage I or II), intermediate (stage III or IV), and high (stage V or VI). NP burden was coded as none or sparse versus moderate or frequent. Because infarcts that occurred acutely or sub-acutely around the time of death were more likely to have occurred after a subject’s last MRI scan, only more remote infarcts were considered for this study. Similarly, cerebellar or brain stem infarcts were not considered for this study, since they would not substantially affect the brain volumes of interest for this study.
Statistical Analyses
Pearson chi-squares, Fisher’s exact test or student’s t-tests were used as appropriate to compare subject characteristics between clinical diagnostic categories (cognitive impairment versus NCI). Mixed-effects models, which allow random intercept and age slope, with each brain volume (ventricular, total brain and hippocampal) as the outcome were run with the following independent variables: time (age at each MRI assessment, centered at age 85), the interaction terms of time with the following covariates: Braak stage (3 categories), plaque burden (2 categories), microinfarcts (3 categories), presence of gross infarcts, Lewy bodies, and amyloid angiopathy, diagnosis at each MRI assessment (time-varying covariate), and APOE genotype (one or more ε4 versus none). We also controlled for age at death and duration of follow-up (time from first MRI to death) as potential confounders. Covariates were selected based on their previously established associations with longitudinal brain volume changes. JMP version 5.0.1a, SAS version 9.2 (SAS Institute, Cary, NC) and R version 2.11 were used for statistical analyses. Significance was set at p<0.017 (0.05/3), the p-value adjusted for three comparisons (i.e., three volumetric measures) using the Bonferroni method.
Results
Participant Characteristics
The mean age at death was 94.7 (SD 5.46) (range 80.1–108.1) years old (Table 1). Volunteers were followed for a mean of 7.68 years (SD 3.59, range 1.5–16.1 years). Of the 71 participants who enrolled cognitively intact, 44 developed cognitive impairment. Of these, 20 had probable or possible AD, 5 had vascular dementia, 16 had MCI, and three had a mixed dementia as their last clinical diagnosis. The mean interval between last MRI and neuropathological evaluation was 15 months.
Table 1.
Subject characteristics
| Total N=71 | Cognitive impairment (CDR 0.5) N=44 | No cognitive impairment (CDR=0) N=27 | p-values a | |
|---|---|---|---|---|
| Women | 57.75% | 59.09% | 55.56% | 0.77 |
| Duration of follow up, yrs | 7.68 (3.59) | 8.42 (3.38) | 6.45 (3.63) | 0.02 |
| Education | 14.50 (2.91) | 14.30 (3.15) | 14.82 (2.49) | 0.48 |
| Age at death | 94.72 (5.46) | 96.36 (5.05) | 92.05 (5.11) | <0.001 |
| Age at onset of cognitive impairment | n/a | 92.47 (5.29) | n/a | n/a |
| Age at last cognitive evaluation | 94.35 (5.49) | 96.01 (5.06) | 91.68 (5.17) | <0.001 |
| Last cognitive evaluation to death, months | 4.44(3.24) | 4.32(3.48) | 4.68 (2.88) | 0.63 |
| Age at first MRI | 88.36 (5.77) | 89.21 (5.32) | 86.98 (6.29) | 0.18 |
| Age at last MRI | 93.38 (5.27) | 94.79 (4.95) | 91.09 (5.05) | 0.003 |
| Time from first MRI to death, yrs | 6.85 (3.86) | 7.77 (3.56) | 5.34 (3.92) | 0.009 |
| Time between first and last MRI, yrs | 5.51 (3.61) | 6.25 (3.46) | 4.32 (3.59) | 0.03 |
| Last MRI to death, months | 15.36 (9.96) | 17.76 (9.96) | 11.52 (8.88) | 0.009 |
| APOE ε4 one or more present | 21.13% | 18.18% | 25.93% | 0.44 |
Numbers are frequency or mean (SD)
CDR: Clinical Dementia Rating
t-test for continuous variables and Pearson chi-square test for categorical variables, unless noted otherwise.
The NCI group had more individuals with lower Braak scores and less individuals with gross infarcts (Table 2).
Table 2.
Pathological parameters in study subjects
| Total N=71 | Cognitive impairment N=44 | No cognitive impairment N=27 | p-valuea | |
|---|---|---|---|---|
| Braak 1–2 or no tangles | 38.03 % | 25.00% | 59.26% | 0.02 |
| Braak 3–4 | 43.66% | 52.27% | 29.63% | |
| Braak 5–6 | 18.31% | 22.73% | 11.11 % | |
| CERAD none or sparse | 56.34% | 54.55% | 59.26 % | 0.69 |
| CERAD moderate or frequent | 43.66% | 45.45% | 40.74% | |
| Gross Infarcts | 33.8 % | 43.18 % | 18.52 % | 0.04 b |
| Microinfarcts none | 53.52% | 52.27% | 55.56% | 0.52 |
| Microinfarcts one | 21.13% | 18.18% | 25.93% | |
| Microinfarcts two or more | 25.35% | 29.55% | 18.52% | |
| Amyloid angiopathy present | 36.62% | 34.09% | 40.74% | 0.62 b |
| Hippocampal sclerosis present | 7.04% | 9.09% | 3.70% | 0.64b |
| Lewy bodies present | 19.72% | 22.73% | 14.81% | 0.54 b |
Pearson Chi-square test unless noted otherwise.
Fisher’s exact test.
Mixed-Effects Models
More ventricular volume enlargement over time was significantly associated with older age, diagnosis of dementia, having gross infarcts, a Braak score of 5 or 6, moderate or frequent NPs, and the presence of the ε4 allele (p<0.017). There was a trend for association with MCI diagnosis (p=0.04). That is, enlargement was accelerated during the period of MCI compared with that of normal cognition.
More total brain volume loss over time was significantly associated with older age and MCI diagnosis (p<0.017). There was a trend for association with dementia diagnosis (p=0.018), presence of gross infarcts (p=0.04), and amyloid angiopathy (p=0.03).
More hippocampal volume loss over time was significantly associated with presence of amyloid angiopathy (p=0.009) (Table 3).
Table 3.
Results of mixed effect models for the outcomes %* ventricular, total brain and hippocampal volume change: interaction effects of age and postmortem pathologies, APOE ε4 and cognitive status.
| % Ventricular Coefficient (SE), p-value | % Total Brain Coefficient (SE), p-value | % Hippocampal Coefficient (SE), p-value | |
|---|---|---|---|
|
| |||
| Age | 0.08(0.02); <0.0001 a | −0.28 (0.07); 0.0001 a | −0.0006(0.0004); 0.14 |
|
| |||
| Age* mild cognitive impairment | 0.009 (0.005); | −0.07 (0.02); | 0.00002 (0.0002); |
| Reference: no cognitive impairment | 0.04 | 0.004a | 0.89 |
|
| |||
| Age* dementia | 0.03 (0.007); | −0.08 (0.04); | −0.000007 (0.0002); |
| Reference: no cognitive impairment | <0.0001a | 0.018 | 0.97 |
|
| |||
| Age* Braak 5–6 | 0.06(0.02); | −0.11(0.09); | 0.0005 (0.0004;) |
| (Reference: Braak none, 1 or 2) | 0.015a | 0.2 | 0.26 |
|
| |||
| Age * Braak 3–4 | −0.004(0.02); | −0.09 (0.06); | 0.0003 (0.0003); |
| (Reference : Braak none, 1 or 2) | 0.79 | 0.11 | 0.35 |
|
| |||
| Age* CERAD moderate or frequent | 0.05 (0.02); | −0.05 (0.06); | −0.0002 (0.0003); |
| (Reference: CERAD none or sparse) | 0.001 a | 0.39 | 0.48 |
|
| |||
| Age* ε4 present | 0.1(0.02); | −0.12 (0.08); | −0.0005 (0.0004); |
| (Reference: no ε4 present) | <0.0001 a | 0.11 | 0.18 |
|
| |||
| Age * gross infarct present | 0.07 (0.02); | −0.12 (0.06); | −0.0004 (0.0003); |
| (Reference: no gross infarct present) | <0.0001 a | (0.04) | 0.17 |
|
| |||
| Age* Lewy Bodies present | −0.008 (0.02); | 0.01 (0.07); | −0.0001 (0.0004); |
| (Reference: no Lewy Bodies present) | 0.65 | 0.84 | 0.73 |
|
| |||
| Age* Amyloid Angiopathy present | 0.01 (0.01); | −0.13 (0.06); | −0.0008 (0.0003); |
| (Reference: no amyloid angiopathy) | 0.44 | 0.03 | 0.009 |
|
| |||
| Age* microinfarcts 2 or more | −0.013 (0.02); | −0.03 (0.07); | −0.0003 (0.0003); |
| (Reference: no microinfarcts) | 0.45 | 0.63 | 0.39 |
|
| |||
| Age* microinfarcts one | −0.005 (0.02); | −0.006 (0.08); | −0.0003 (0.0004); |
| (Reference: no microinfarcts) | 0.82 | 0.94 | 0.43 |
In all models, duration (time from first MRI to death) and age at death were controlled.
proportion of intracranial volume
Significant using Bonferroni multiple comparison adjusted p-value (0.017)
Discussion
In this clinicopathological correlation study examining the neurodegenerative basis of brain atrophy, we observed that of the three volumes measured, ventricular volume trajectory compared to total brain and hippocampal volume trajectories had the strongest association with neuropathologic measures of AD and vascular disease.
There are several plausible explanations why ventricular volume trajectory showed a stronger association with pathologic measures. First it may be due to the simple fact that ventricular volume measurements are more robust compared to other volumetric measurements. Because of the relatively smaller initial volume of the cerebrospinal fluid (CSF) space, the percentage of increase in ventricular volume is proportionally more rapid than percentage loss of brain tissue27. Thus changes over time are easier and more robust to measure with less noise associated with repeated measurements. Alternatively, there may be a biologic explanation: ventricular enlargement is a summary marker of atrophy in both gray matter (as a result of neuropil and neuronal loss) and white matter (as a result of axonal loss) associated with aging as well as changes in CSF production and flow that occur during the aging process 27, 28. It is possible that ventricular volume change correlates well with all of these aging related processes. We also found that the presence of high NP scores was more significantly associated with ventricular volume enlargement compared to NFTs. This contradicts one previous study that found NFTs, but not a measure of total brain amyloid, to be associated with total brain atrophy and ventricular volume change 10. Several differences exist between this previous study and our study that may have led to this discrepancy: the ages of the cohorts (median age at last scan was on average 10 years older and the age range of study participants was narrower in our study (80–106 versus 49–101)), timing of observations (in our study participants were monitored for a longer period of time with initial imaging obtained before onset of dementia), and differences with regard to the assessment of amyloid pathology (NP score in our study, versus a measure of total amyloid density). Two other studies found associations between measures of amyloid (NP scores in one study and 11C-PIB positron emission tomography in the other) and ventricular volume enlargement rates as we did 11, 29.
Another finding worth further discussion is that the presence of amyloid angiopathy was significantly associated with increased hippocampal volume loss, and showed a trend for association with increased total brain volume loss. Two previous studies also found that presence of amyloid angiopathy correlated with smaller cross-sectional hippocampal volumes 30, 31. Some studies suggest that amyloid angiopathy is associated with reduced brain perfusion 32. Additionally, hippocampus seems to be more vulnerable to brain hypoperfusion 33. It is possible that subtle continuous chronic ischemia from amyloid angiopathy may result in atrophy, more selectively observed in the hippocampus. This observation needs further investigation in future studies. Why presence of amyloid angiopathy and not other AD neuropathologic markers correlated with hippocampal atrophy is not clear. One previous study also did not find an association between longitudinal hippocampal volume changes and NFTs and NPs 11. One possible explanation is that hippocampal volume changes due to AD neuropathology occur early on, and plateau preceding changes in other volumes, where as in those with amyloid angiopathy hippocampal volume loss continues. Results also may be influenced by the fact that hippocampal volume may be more prone to variability in longitudinal measurements. This may be related to more noise due to measurement techniques as well as possible biologic fluctuations 34.
Additionally, we found that ventricular volume enlargement accelerated during periods of dementia diagnosis and total brain volume atrophy increased during periods of MCI diagnosis after adjusting for the presence of the neuropathologic measures. This suggests that brain volume changes in those with MCI or dementia cannot be solely explained by the amount of AD or vascular neuropathology. There likely are other factors not measured in this study that may be mediating the degree of brain atrophy in the presence of similar neuropathologic burden. For example, functional polymorphisms in genes in the apoptotic pathway or environmental influences on neurotrophins may mediate the degree of cell loss and in turn brain atrophy in the context of AD neuropathology 34,35. Alternatively, timing of the MRI observations in relation to cognitive evaluations may have contributed to this observation.
We also observed significant associations between the presence of gross infarcts and APOE ε4 allele and ventricular volume trajectories. While it is not surprising to find that macroscopic infarcts are correlated with brain atrophy, it was surprising to find that the presence of the APOE ε4 allele was very strongly associated with rate of change in ventricular volume. This finding was unexpected because it is thought that the effect of the APOE ε4 allele is most salient in young old individuals compared to old old individuals 36. A previous study from our center found a similar APOE ε4 effect on ventricular volume in women 37.
This study has several limitations. Our sample size, although among the largest to assess the clinicopathological correlation of longitudinal brain volume trajectories, was nevertheless too small to examine the effects of less frequent pathologies, such as HS, or categorizing Lewy bodies as cortical versus non-cortical. Additionally, assessments for other markers of pathogenic contributors to dementia such as TDP-43 were not included. Our sample data is derived from volunteers in the ninth through eleventh decades of life, a segment of the population at highest risk for cognitive impairment and death. Conclusions relative to younger at risk individuals remains speculative at this point. The strengths of this study are: 1) use of a well described set of participants who were all enrolled as cognitively intact elderly and followed over a mean of 7.7 years until death with multiple MRI scans and clinical assessments during life; 2) the inclusion of other confounding pathological measures such as vascular disease and Lewy bodies in the analyses; and 3) use of mixed-effects models, which allowed for including participants with different durations of follow-up and for individual differences in time slope (random effects), and adjusting for the changing diagnoses during the duration of follow up.
Our findings suggest that in individuals in the ninth through eleventh decades of life, the trajectory of ventricular volume, but not other regional or total brain volumes, shows the strongest correlation with neuropathologic measures of AD and vascular disease. Given their relative ease of measurement, ventricular volume trajectories can be widely used when providing care or assessing potential new treatments to an increasingly elderly population. Additionally, our data suggest that the brain volume changes over time in those with cognitive impairment are different than those without cognitive impairment even after accounting for the degree of the neuropathologic burden. This suggests that other mechanisms possibly related to cognitive reserve or resistance to atrophy may be modulating brain atrophy.
Figure 1.
Trajectories of ventricular volume change. Dotted lines represent the predicted trajectories based on estimates using the coefficients generated in the mixed effects models and solid lines represent the observed trajectories.
Figure 1 A and B represent trajectories for the Consortium to Establish a Registry for Alzheimer’s Disease (CERAD) neuritic plaque categories; CERAD none or sparse (A), and CERAD moderate or frequent (B).
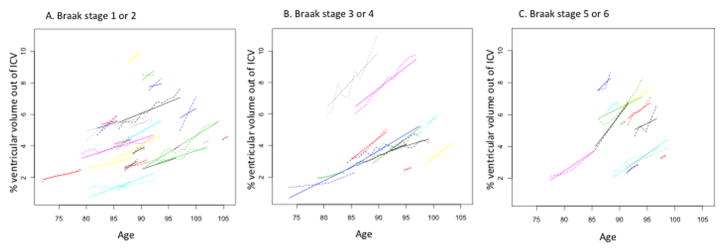
Figure 2.
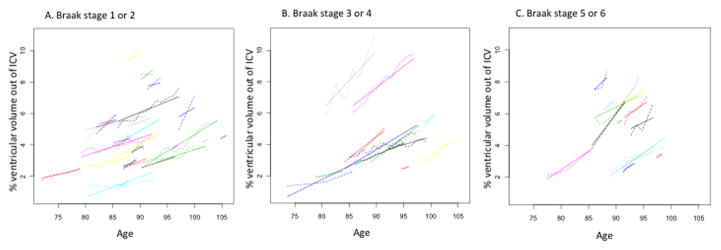
Trajectories of ventricular volume change. Dotted lines represent the predicted trajectories based on estimates using the coefficients generated in the mixed effects models and solid lines represent the observed trajectories.
Figure 2 A, B and C show trajectories for the three Braak groups: Braak none, 1 or 2 (A), Braak 2 or 3 (B), Braak 5 or 6 (C).
Acknowledgments
Funding: This study was supported by funding by the Office of Research and Development (Clinical Science Research and Development), Department of Veterans Affairs and the National Institute on Aging, National Institute of Health, AG08017.
References
- 1.Crystal HA, Dickson D, Davies P, Masur D, Grober E, Lipton RB. The relative frequency of “dementia of unknown etiology” increases with age and is nearly 50% in nonagenarians. Arch Neurol. 2000;57:713–719. doi: 10.1001/archneur.57.5.713. [DOI] [PubMed] [Google Scholar]
- 2.Haroutunian V, Schnaider-Beeri M, Schmeidler J, et al. Role of the neuropathology of Alzheimer disease in dementia in the oldest-old. Arch Neurol. 2008;65:1211–1217. doi: 10.1001/archneur.65.9.1211. [DOI] [PMC free article] [PubMed] [Google Scholar]
- 3.White L, Small BJ, Petrovitch H, et al. Recent clinical-pathologic research on the causes of dementia in late life: update from the Honolulu-Asia Aging Study. J Geriatr Psychiatry Neurol. 2005;18:224–227. doi: 10.1177/0891988705281872. [DOI] [PubMed] [Google Scholar]
- 4.Schneider JA, Aggarwal NT, Barnes L, Boyle P, Bennett DA. The neuropathology of older persons with and without dementia from community versus clinic cohorts. J Alzheimers Dis. 2009;18:691–701. doi: 10.3233/JAD-2009-1227. [DOI] [PMC free article] [PubMed] [Google Scholar]
- 5.Sonnen JA, Larson EB, Crane PK, et al. Pathological correlates of dementia in a longitudinal, population-based sample of aging. Ann Neurol. 2007;62:406–413. doi: 10.1002/ana.21208. [DOI] [PubMed] [Google Scholar]
- 6.White L. Brain lesions at autopsy in older Japanese-American men as related to cognitive impairment and dementia in the final years of life: a summary report from the Honolulu-Asia aging study. J Alzheimers Dis. 2009;18:713–725. doi: 10.3233/JAD-2009-1178. [DOI] [PubMed] [Google Scholar]
- 7.Fotuhi M, Hachinski V, Whitehouse PJ. Changing perspectives regarding late-life dementia. Nat Rev Neurol. 2009;5:649–658. doi: 10.1038/nrneurol.2009.175. [DOI] [PubMed] [Google Scholar]
- 8.Ganguli M, Rodriguez E. Age, Alzheimer’s disease, and the big picture. Int Psychogeriatr. 2011;23:1531–1534. doi: 10.1017/S1041610211001906. [DOI] [PMC free article] [PubMed] [Google Scholar]
- 9.James BD, Schneider JA. Increasing incidence of dementia in the oldest old: evidence and implications. Alzheimers Res Ther. 2010;2:9. doi: 10.1186/alzrt32. [DOI] [PMC free article] [PubMed] [Google Scholar]
- 10.Josephs KA, Whitwell JL, Ahmed Z, et al. Beta-amyloid burden is not associated with rates of brain atrophy. Ann Neurol. 2008;63:204–212. doi: 10.1002/ana.21223. [DOI] [PMC free article] [PubMed] [Google Scholar]
- 11.Silbert LC, Quinn JF, Moore MM, et al. Changes in premorbid brain volume predict Alzheimer’s disease pathology. Neurology. 2003;61:487–492. doi: 10.1212/01.wnl.0000079053.77227.14. [DOI] [PubMed] [Google Scholar]
- 12.Wilson RS, Leurgans SE, Boyle PA, Schneider JA, Bennett DA. Neurodegenerative basis of age-related cognitive decline. Neurology. 2010;75:1070–1078. doi: 10.1212/WNL.0b013e3181f39adc. [DOI] [PMC free article] [PubMed] [Google Scholar]
- 13.Howieson DB, Camicioli R, Quinn J, et al. Natural history of cognitive decline in the old old. Neurology. 2003;60:1489–1494. doi: 10.1212/01.wnl.0000063317.44167.5c. [DOI] [PubMed] [Google Scholar]
- 14.Kaye JA, Oken BS, Howieson DB, Howieson J, Holm LA, Dennison K. Neurologic evaluation of the optimally healthy oldest old. Arch Neurol. 1994;51:1205–1211. doi: 10.1001/archneur.1994.00540240049015. [DOI] [PubMed] [Google Scholar]
- 15.Folstein MF, Robins LN, Helzer JE. The Mini-Mental State Examination. Arch Gen Psychiatry. 1983;40:812. doi: 10.1001/archpsyc.1983.01790060110016. [DOI] [PubMed] [Google Scholar]
- 16.Morris JC. Clinical dementia rating: a reliable and valid diagnostic and staging measure for dementia of the Alzheimer type. Int Psychogeriatr. 1997;9(Suppl 1):173–176. doi: 10.1017/s1041610297004870. discussion 177–178. [DOI] [PubMed] [Google Scholar]
- 17.Yesavage JA, Brink TL, Rose TL, et al. Development and validation of a geriatric depression screening scale: a preliminary report. J Psychiatr Res. 1982;17:37–49. doi: 10.1016/0022-3956(82)90033-4. [DOI] [PubMed] [Google Scholar]
- 18.Kiernan RJ, Mueller J, Langston JW, Van Dyke C. The Neurobehavioral Cognitive Status Examination: a brief but quantitative approach to cognitive assessment. Ann Intern Med. 1987;107:481–485. doi: 10.7326/0003-4819-107-4-481. [DOI] [PubMed] [Google Scholar]
- 19.Mueller EA, Moore MM, Kerr DC, et al. Brain volume preserved in healthy elderly through the eleventh decade. Neurology. 1998;51:1555–1562. doi: 10.1212/wnl.51.6.1555. [DOI] [PubMed] [Google Scholar]
- 20.McKhann G, Drachman D, Folstein M, Katzman R, Price D, Stadlan EM. Clinical diagnosis of Alzheimer’s disease: report of the NINCDS-ADRDA Work Group under the auspices of Department of Health and Human Services Task Force on Alzheimer’s Disease. Neurology. 1984;34:939–944. doi: 10.1212/wnl.34.7.939. [DOI] [PubMed] [Google Scholar]
- 21.Chui HC, Victoroff JI, Margolin D, Jagust W, Shankle R, Katzman R. Criteria for the diagnosis of ischemic vascular dementia proposed by the State of California Alzheimer’s Disease Diagnostic and Treatment Centers. Neurology. 1992;42:473–480. doi: 10.1212/wnl.42.3.473. [DOI] [PubMed] [Google Scholar]
- 22.Kaye JA, Swihart T, Howieson D, et al. Volume loss of the hippocampus and temporal lobe in healthy elderly persons destined to develop dementia. Neurology. 1997;48:1297–1304. doi: 10.1212/wnl.48.5.1297. [DOI] [PubMed] [Google Scholar]
- 23.Braak H, Braak E. Staging of Alzheimer’s disease-related neurofibrillary changes. Neurobiol Aging. 1995;16:271–278. doi: 10.1016/0197-4580(95)00021-6. discussion 278–284. [DOI] [PubMed] [Google Scholar]
- 24.Mirra SS, Heyman A, McKeel D, et al. The Consortium to Establish a Registry for Alzheimer’s Disease (CERAD) Part II. Standardization of the neuropathologic assessment of Alzheimer’s disease. Neurology. 1991;41:479–486. doi: 10.1212/wnl.41.4.479. [DOI] [PubMed] [Google Scholar]
- 25.Consensus recommendations for the postmortem diagnosis of Alzheimer’s disease. The National Institute on Aging, and Reagan Institute Working Group on Diagnostic Criteria for the Neuropathological Assessment of Alzheimer’s Disease. Neurobiol Aging. 1997;18:S1–2. [PubMed] [Google Scholar]
- 26.Green MS, Kaye JA, Ball MJ. The Oregon brain aging study: neuropathology accompanying healthy aging in the oldest old. Neurology. 2000;54:105–113. doi: 10.1212/wnl.54.1.105. [DOI] [PubMed] [Google Scholar]
- 27.Drachman DA. Aging of the brain, entropy, and Alzheimer disease. Neurology. 2006;67:1340–1352. doi: 10.1212/01.wnl.0000240127.89601.83. [DOI] [PubMed] [Google Scholar]
- 28.May C, Kaye JA, Atack JR, Schapiro MB, Friedland RP, Rapoport SI. Cerebrospinal fluid production is reduced in healthy aging. Neurology. 1990;40:500–503. doi: 10.1212/wnl.40.3_part_1.500. [DOI] [PubMed] [Google Scholar]
- 29.Archer HA, Edison P, Brooks DJ, et al. Amyloid load and cerebral atrophy in Alzheimer’s disease: an 11C-PIB positron emission tomography study. Ann Neurol. 2006;60:145–147. doi: 10.1002/ana.20889. [DOI] [PubMed] [Google Scholar]
- 30.Dawe RJ, Bennett DA, Schneider JA, Arfanakis K. Neuropathologic correlates of hippocampal atrophy in the elderly: a clinical, pathologic, postmortem MRI study. PLoS One. 2011;6:e26286. doi: 10.1371/journal.pone.0026286. [DOI] [PMC free article] [PubMed] [Google Scholar]
- 31.Jagust WJ, Zheng L, Harvey DJ, et al. Neuropathological basis of magnetic resonance images in aging and dementia. Ann Neurol. 2008;63:72–80. doi: 10.1002/ana.21296. [DOI] [PMC free article] [PubMed] [Google Scholar]
- 32.Chung YA, OJH, Kim JY, Kim KJ, Ahn KJ. Hypoperfusion and ischemia in cerebral amyloid angiopathy documented by 99mTc-ECD brain perfusion SPECT. J Nucl Med. 2009;50:1969–1974. doi: 10.2967/jnumed.109.062315. [DOI] [PubMed] [Google Scholar]
- 33.Schmidt-Kastner R, Freund TF. Selective vulnerability of the hippocampus in brain ischemia. Neuroscience. 1991;40:599–636. doi: 10.1016/0306-4522(91)90001-5. [DOI] [PubMed] [Google Scholar]
- 34.Erickson KI, Voss MW, Prakash RS, et al. Exercise training increases size of hippocampus and improves memory. Proc Natl Acad Sci U S A. 2011;108:3017–3022. doi: 10.1073/pnas.1015950108. [DOI] [PMC free article] [PubMed] [Google Scholar]
- 35.Erten-Lyons D, Jacobson A, Kramer P, Grupe A, Kaye J. The FAS gene, brain volume, and disease progression in Alzheimer’s disease. Alzheimers Dement. 2010;6:118–124. doi: 10.1016/j.jalz.2009.05.663. [DOI] [PMC free article] [PubMed] [Google Scholar]
- 36.Rebeck GW, Perls TT, West HL, Sodhi P, Lipsitz LA, Hyman BT. Reduced apolipoprotein epsilon 4 allele frequency in the oldest old Alzheimer’s patients and cognitively normal individuals. Neurology. 1994;44:1513–1516. doi: 10.1212/wnl.44.8.1513. [DOI] [PubMed] [Google Scholar]
- 37.Carlson NE, Moore MM, Dame A, et al. Trajectories of brain loss in aging and the development of cognitive impairment. Neurology. 2008;70:828–833. doi: 10.1212/01.wnl.0000280577.43413.d9. [DOI] [PubMed] [Google Scholar]