

Abstract
This report summarizes the establishment of the first national online registry of primary immune deficency in the United Kingdom, the United Kingdom Primary Immunodeficiency (UKPID Registry). This UKPID Registry is based on the European Society for Immune Deficiency (ESID) registry platform, hosted on servers at the Royal Free site of University College, London. It is accessible to users through the website of the United Kingdom Primary Immunodeficiency Network (http://www.ukpin.org.uk). Twenty-seven centres in the United Kingdom are actively contributing data, with an additional nine centres completing their ethical and governance approvals to participate. This indicates that 36 of 38 (95%) of recognized centres in the United Kingdom have engaged with this project. To date, 2229 patients have been enrolled, with a notable increasing rate of recruitment in the past 12 months. Data are presented on the range of diagnoses recorded, estimated minimum disease prevalence, geographical distribution of patients across the United Kingdom, age at presentation, diagnostic delay, treatment modalities used and evidence of their monitoring and effectiveness.
Keywords: human studies, immunodeficiency–primary, infections, intravenous immunoglobulin therapy (IVIG), therapy/immunotherapy
Introduction
Primary immunodeficiencies (PID) are a heterogeneous group of disorders of immune regulation and function. Since Bruton's first description of agammaglobulinaemia as a PID in 1952 1 there has been an explosion of knowledge in this area, with more than 200 gene defects contributing to even more distinct disease phenotypes 2–3. The rarity of many forms of PID requires national and international collaboration to facilitate translational research and to drive improvements in management and therapeutic strategies.
PID encompasses a myriad of presentations ranging from the potentially benign immunoglobulin (Ig)A deficiency to potentially catastrophic diagnoses, such as severe combined immunodeficiency (SCID). They are characterized by increased susceptibility to infection, and through dysregulation of immunity may also predispose to malignancy and autoimmune disease. Humoral immunodeficiencies, in particular common variable immunodeficiency (CVID), are the most frequently encountered PID requiring treatment 4. Treatment for such antibody deficiencies involves regular, lifelong immunoglobulin replacement therapy 5. Management of these rare conditions is resource-intensive, and therefore quality epidemiological data are of paramount importance in making health-care planning decisions.
Epidemiological data on PID are difficult to obtain. Incidences of PID requiring treatment have been determined to range from 1:20 000 to 1:500 000, depending on the exact diagnosis and geographic region. However, it is generally accepted that PID is under-diagnosed and under-reported. Furthermore, data on mortality and morbidity are limited. To address these issues, the European Society for Immunodeficiencies (ESID) set up an internet-based patient registry in 2004. This database aims to provide data on diagnosis, therapy, laboratory indices and outcomes on more than 210 PID entities. The first report of the ESID database was received in 2007 6 and two subsequent updates have been published 7–8. The database now contains more than 18 000 patient entries from 102 centres in 30 different countries and is a powerful tool for PID research across Europe.
The United Kingdom is a major European country involved in the treatment of PID patients. There has been long-standing interest in the development of a national registry for PID in the United Kingdom, with a paper-based system in the 1990s, establishment of paediatric databases in the supraregional specialist centres and involvement in earlier ESID projects 9.
The UK Primary Immunodeficiency Network (UKPIN: http://www.ukpin.org.uk) is a multi-disciplinary organization devoted to those with PID. The network was established to improve PID patients' health through the development of common approaches to management and agreed standards of care. It has 38 member centres throughout the four countries of the United Kingdom. All nurses, scientists and medical practitioners involved in the health care of patients with PID, or in research into these diseases, are eligible for UKPIN membership.
UKPIN recommended the adoption of the ESID online platform for the UK national registry in 2005. For reasons of data control and security it was decided that the United Kingdom PID (UKPID) Registry should run on a dedicated server in the department of the then lead researcher [B.G.: Royal Free site of University College London (UCL)] linked to the European online registry. A member of the ESID database team in Freiburg (D.G.) was involved from the outset in the maintenance of the UK version from a technical and administrative perspective.
Establishment of the Registry was made possible by generous funding from the UK patient support organization at the time, the Primary Immunodeficiency Association. Further financial project support from the Healthcare Quality Improvement Partnership (http://www.hqip.org.uk) was obtained in 2011.
A UKPID Registry management committee was established in early 2008, with representatives of medical and nursing staff as well as patients' charities and the core registry team. Although a small number of centres were submitting their data to ESID prior to 2008, we regard this as the formal date of commencement of the national UKPID Registry. At the time of transfer there were 1095 patients in the database. Access to the UKPID Registry is via the website of UKPIN (http://www.ukpin.org.uk/home/registry-introduction.htm). There is a twice-yearly transfer of UKPID Registry data to the ESID database for those patients who have given their full consent for data-sharing with ESID.
This is the first report of the UKPID Registry. The main aim of the Registry is to act as a data repository that can provide longitudinal data, which is not otherwise available from randomized controlled studies in these rare and heterogeneous disorders. Clinicians may interrogate the database to answer questions relevant to clinical practice for the care of patients with primary immunodeficiency. Additionally, data from this national registry should facilitate meaningful clinical research through the identification of rare/sporadic cases across the country. The data may also be used in health-care planning decisions on the diagnosis and management of these conditions across the United Kingdom.
Materials and methods
The UKPID Registry is a secure, encrypted online registry, hosted on dedicated servers at the Royal Free Hospital site of the University College London, and linked to the ESID database. Database technical structure is identical to that described previously 6–10. Multicentre Research Ethics Committee (MREC) approval was obtained in 2004 for the ESID Online Database (MREC number: 04/MRE07/68). Approvals have been revised regularly to reflect the establishment of a UK-based version and updates on the processes and procedures.
Data are collected via electronic case report forms (CRF). The CRF is identical to the ESID CRF to ensure data conformity and has been described previously 10. Patients are grouped into eight main categories: predominantly antibody deficiencies, predominantly T cell deficiencies, phagocytic deficiencies, complement deficiencies, other well-defined PIDs, autoimmune and immune dysregulation syndromes, defects in innate immunity, and autoinflammatory syndromes. A final, ninth category allows documentation of undefined immunodeficiencies. Within these categories are further subregistries allowing classification of individual PID into International Union of Immunological Sciences (IUIS)-defined clinical entities 11. Each subregistry requires completion of a core data set, allowing gathering of a homogeneous set of information across all PID.
Patient data are entered at registration and clinicians are encouraged to capture each subsequent follow-up visit. Patients' dates of death are recorded on the system when that information becomes available to the documenting centre. Date of diagnosis is defined as the date of diagnosis by a PID specialist in a registered centre.
A retrospective analysis of data was performed; data entries in which gender or date of birth were missing were excluded from the analysis. Analysis of minimum prevalence and incidence of various PID was established. We have analysed data using parametric and non-parametric methods as appropriate. Analysis was undertaken in relation to the numbers of different diseases represented, the geographical distribution of these patients within the United Kingdom, the age and gender distribution, age at onset and diagnostic delay. We also present data on the major therapeutic interventions employed in the management of these patients. Where data are only available for a subset of subjects the denominator is clearly stated in the text.
Data quality
The quality of the data is heavily reliant upon qualified users. UKPIN contracts only with established primary immunodeficiency centres. Password application users have to be validated by their head of department, who countersigns their application. These users are either physicians or delegated assistants who are trained in the documentation of medical data. The UKPIN data administrators offer specific training on the database to help users. Data monitoring is carried out both by the co-ordinator and by a person appointed in each centre. Data quality is ensured only if this monitoring takes place regularly. The database has inbuilt quality assurance features, e.g. mandatory fields which must be completed. Use of logic rules prevents other errors, e.g. year of birth cannot be a future date. If the diagnosis of a PID is refined, e.g. by identification of a genetic mutation, patient data can be transferred to the appropriate subregistry. Users are aware that this database is to be used for long-term documentation and that data have to be updated regularly.
Results
There are 38 recognized immunology centres in the United Kingdom. Twenty-seven of 38 (71%) of these centres have commenced their patients' enrolment. An additional nine centres are completing their ethical and governance applications, indicating that 36 of 38 (95%) of centres are committed to the process.
As of 1 October 2012, 2229 patients from 27 centres have been entered into the UKPID Registry.
We do not have formal data on how often patients decline to have their data entered, but anecdotally this is an extremely uncommon occurrence. The location of these patients is indicated by city in Fig. 1. The size of the circles in each city is directly proportional to the number of patients registered there to date. Two supraregional centres for the diagnosis and management of children with SCID requiring paediatric bone marrow transplantation are located in London and Newcastle upon Tyne. The rate of data accrual is indicated in Fig. 2. It is noteworthy that there appears to have been a significant acceleration in data accrual over the last 12 months.
Figure 1.
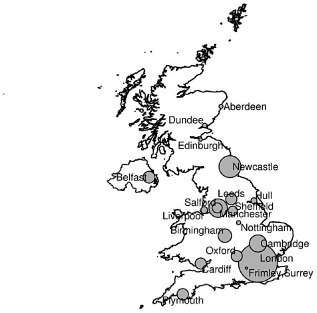
Geographical distribution of patients enrolled in the United Kingdom Primary Immune Deficiency (UKPID) Registry by city of documenting centre. The diameter of the circle is directly proportional to the number of patients enrolled in each centre.
Figure 2.
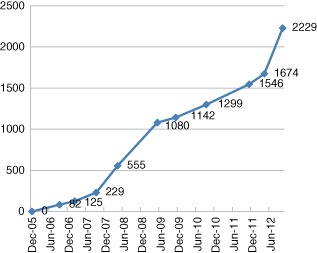
Recruitment of total patient numbers to the United Kingdom Primary Immune Deficiency (UKPID) Registry 2006–12.
Of the 2229 registered patients, 2153 (96·5%) were alive at the time of registration. There were 1067 female and 1162 male patients registered, with 496 (22%) aged 16 years or less. The ratios of females to males in the different age ranges are as follows: ≤16 years = 0·47; ≤18 years = 0·53; 18−29 years = 0·69; ≥30 years = 1.
For 734 patients, data from a single visit are recorded whereas for 1441 patients there are data from more than one visit. No visits are recorded for 54 patients.
A molecular diagnosis was confirmed in 566 of 1966 patients (28·8%). Consanguinity was reported in 27 of 924 patients (2·9%). Two hundred and fifty-three of 1055 patients were identified as familial cases (24%).
The antibody disorders make up the largest group, accounting for 1364 (61%) of registered patients. The diagnostic breakdown into the nine major classification groups is indicated in Fig. 3. The most frequently reported PID entity is CVID, accounting for 810 (36·3%) of the registered patients. The second most frequent diagnosis was hereditary angioedema (HAE/C1-inhibitor deficiency) (n = 178, 8%). Agammaglobulinaemia (n = 120, 5·4%), SCID (n = 109, 4·9%), chronic granulomatous disease (CGD) (n = 79, 3·5%), other hypogammaglobulinaemia (n = 79, 3·5%), specific antibody deficiency (n = 76, 3·4%) and selective IgA deficiency (n = 68, 3·5%) are also frequently registered diagnoses in this UK cohort. The complete list of PID registered is available, with an estimate of minimum individual disease prevalence (Table 1 and Table S1).
Figure 3.
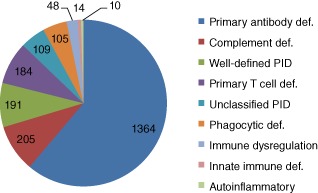
Breakdown of registered patients into the nine major diagnostic categories.
Table 1.
Frequency table for International Union of Immunological Sciences (IUIS) classification and minimum disease prevalence. Estimated minimum prevalence data for primary immunodeficiency (PID) in the United Kingdom based on national population of 63 million
| IUIS classification (1–8) | United Kingdom | France | Germany | ||||||||||||
|---|---|---|---|---|---|---|---|---|---|---|---|---|---|---|---|
| n | Prevalence | n | Prevalence | n | Prevalence | ||||||||||
| Autoinflammatory disorders | 23 | 0·04 | 4 | 0·01* | 52 | 0·06 | |||||||||
| Combined T and B cell immunodeficiencies | 220 | 0·35 | 305 | 0·52 | 73 | 0·05 | |||||||||
| Complement deficiencies | 205 | 0·33 | 42 | 0·06† | 24 | 0·02 | |||||||||
| Congenital defects of phagocyte number, function, or both | 107 | 0·17 | 411 | 0·72 | 130 | 0·16 | |||||||||
| Defects in innate immunity | 1 | 0·00 | 63 | 0·14 | 17 | 0·02 | |||||||||
| Diseases of immune dysregulation | 30 | 0·05 | 218 | 0·31 | 53 | 0·06 | |||||||||
| Other well-defined immunodeficiency syndromes | 308 | 0·49 | 420 | 0·64 | 189 | 0·24 | |||||||||
| Predominantly antibody deficiencies | 1328 | 2·11 | 2022 | 2·93 | 1023 | 1·27 | |||||||||
| All IUIS-classified PID | 2222 | 3·53 | 3417 | 5·32 | 1604 | 2·0 | |||||||||
(Eurostat: http://epp.eurostat.ec.europa.eu). French and German data kindly provided by personal communication from the French National Registry (CEREDIH) and the German National Registry for PID by Dr Nizar Mahlaoui and Dr Benjamin Gathmann. Prevalence per 100 000 population.
Only patients with early-onset. nflammatory bowel disease (patients with chronic infantile neurological cutaneous articular syndrome (CINCA), fibromyalgia (FM), are not included).
Patients with C1q deficiency are not included.
The minimal prevalence of all PID following the currently registered numbers is estimated at 3·5 PID/100 000 of the UK population. The minimal prevalence of predominantly antibody deficiency is 2·1/100 000 in the UK population and that of CVID is 1·3/100 000. The minimum incidence of PID peaked in 2000–08 at 12·5 per 100 000 live births (Fig. 4).
Figure 4.
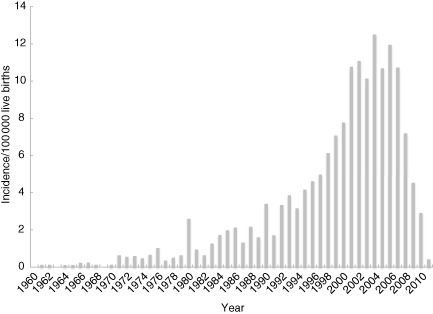
Incidence of patients per 100 000 live births in the the United Kingdom Primary Immune Deficiency (UKPID) Registry 1960–2012.
Diagnostic delay is commonly reported for PID and statistics for delay between onset of symptoms and diagnosis are provided for the more common PID conditions (Table 2). This is broken down further for CVID patients by age at diagnosis and age of onset of symptoms (Table 3). For SCID, even a short diagnostic delay can be significant. Precise date of diagnosis was available on 56 of the 96 SCID cases. For this group the median age of diagnosis for SCID was 97 days [interquartile range (IQR) 30·5–202 days]. Forty-one cases were excluded from the above analysis because recording of date of diagnosis was incomplete, mainly with the day of month not given. In order to check that the analysis based on 55 cases was representative, in those cases where the day of the month of the diagnosis date was missing an arbitrary day of 15th of the month was allocated, and the analysis of delay in diagnosis recalculated on the larger number of cases (n = 77). The results on the larger group were similar, with a median age of diagnosis of 109 days (IQR 31–214 days).
Table 2.
Diagnostic delay for different primary immunodeficiency (PID) expressed as the time between symptom onset and diagnosis in years (median and 25th and 75th quartiles)
| Condition | n | 25th quartile | Median | 75th quartile |
|---|---|---|---|---|
| CVID | 290 | 1 | 5 | 13 |
| Diagnosed ≤16 years | 83 | 0 | 2** | 5 |
| Diagnosed: 17–29 years | 53 | 1·25 | 3** | 10·25 |
| Diagnosed: ≥30 years | 154 | 2·25 | 8** | 23 |
| Hereditary angioedema | 41 | 0 | 2 | 5 |
| Agammaglobulinaemia | 47 | 0 | 1 | 2 |
| Other hypogammaglobulinaemia | 27 | 0 | 1 | 3·5 |
| CGD | 47 | 0 | 1 | 3 |
P < 0·05 for difference between <30 years and >30 years onset of common variable immunodeficiency (CVID) (Mann–Whitney–Wilcoxon test). CGD: chronic granulomatous disease.
Table 3.
Diagnostic delay in common variable immunodeficiency (CVID) (calculated as year of diagnosis – year of onset) by age of onset of symptoms (calculated as year of onset– year of birth) and gender
| CVID subgroup | n | Min | IQR-25 | Median | IQR-75 | Max |
|---|---|---|---|---|---|---|
| Onset < 10 years | 98 | 0 | 1 | 5 | 19 | 56 |
| Male | 54 | 0 | 2 | 7† | 19 | 47 |
| Female | 44 | 0 | 1 | 2·5† | 11·5 | 56 |
| Onset ≤ 16 years | 141 | 0 | 1 | 5 | 19 | 59 |
| Male | 71 | 0 | 1·5 | 7 | 20·5 | 59 |
| Female | 70 | 0 | 1 | 5 | 16·25 | 56 |
| Onset 17–29 years | 58 | 0 | 2 | 4 | 12·75 | 43 |
| Male | 30 | 0 | 2 | 4 | 12·75 | 43 |
| Female | 28 | 0 | 1·75 | 3 | 10·75 | 32 |
| Onset 30–39 years | 40 | 0 | 2 | 5 | 12·25 | 30 |
| Male | 22 | 0 | 1 | 5 | 8·75 | 30 |
| Female | 18 | 0 | 2 | 7 | 16 | 27 |
| Onset 40–49 years | 23 | 0 | 1·5 | 4 | 8 | 19 |
| Male | 10 | 1 | 2 | 3 | 5·75 | 19 |
| Female | 13 | 0 | 1 | 5 | 10 | 17 |
| Onset ≥ 50 years | 30 | 0 | 0·25 | 3 | 5 | 15 |
| Male | 10 | 0 | 1 | 1·5 | 3·75 | 4 |
| Female | 20 | 0 | 0 | 4 | 6 | 15 |
Differences non-significant by Mann–Whitney–Wilcoxon test.
A total of 1358 patients were identified as receiving immunoglobulin replacement therapy, with 815 (60%) receiving this intravenously and 543 (40%) by the subcutaneous route. Of these, 431 (32%) received their treatment at home, predominantly by self-infusion.
Data in relation to dosing interval and dose by body weight were analysed for all antibody-deficient patients and the CVID subgroup; similarly for serum IgG levels and infection rates (Table 4).
Table 4.
Frequency and dose of immunoglobulin replacement as well as trough serum immunoglobulin (Ig)G concentrations and infectious complication in antibody immunodeficiencies
| IVIG | n | Dosing interval | Median interval (days) | |||
| – | – | Median IQR/month | Range | – | ||
| Antibody-deficiency patient | 624 | 1·45 | (1·42–1·45) | 21·4 | ||
| CVID patients | 435 | 1·45 | (1·42–1·45) | 21·4 | ||
| SCIG | n | Dosing interval | Median interval (days) | |||
| – | – | Median IQR/month | Range | – | ||
| Antibody-deficiency patient | 436 | 4·35 | (4·35–4·35) | 7·13 | ||
| CVID patients | 276 | 4·35 | (4·35–4·35) | 7·13 | ||
| IVIG | n | Dose (mg/kg/month) | ||||
| – | – | Median IQR | Range | |||
| Antibody-deficiency patient | 285 | 561·79 | 429·29–694·44 | |||
| CVID patients | 198 | 570·7 | 444·54–700·80 | |||
| SCIG | n | Dose (mg/kg/month) | ||||
| – | – | Median IQR | Range | |||
| Antibody-deficiency patient | 237 | 560·04 | 443·83–719·36 | |||
| CVID patients | 145 | 559·76 | 447·39–704·50 | |||
| IVIG | n | Serum IgG levels (g/l) | ||||
| – | – | Median IQR | Range | |||
| Antibody-deficiency patient | 278 | 9 | 7·07–11·0 | |||
| CVID patients | 191 | 8·7 | 6·7–10·5 | |||
| SCIG | n | Serum IgG levels (g/l) | ||||
| – | – | Median IQR | Range | |||
| Antibody-deficiency patient | 214 | 9·49 | 7·5–11·30 | |||
| CVID patients | 138 | 9·25 | 6·9–11·27 | |||
| IVIG | n | No. of infections recorded since last visit | ||||
| – | – | Median IQR | Range | |||
| Antibody-deficiency patient | 330 | 1 | 1·0–3·0 | |||
| CVID patients | 231 | 2 | 1·0–3·0 | |||
| SCIG | n | No. of infections recorded since last visit | ||||
| – | – | Median IQR | Range | |||
| Antibody-deficiency patient | 245 | 2 | 0·0–4·0 | |||
| CVID patients | 152 | 2 | 0·0–3·0 | |||
CVID: common variable immunodeficiency; IVIG: intravenous immunoglobulin; SCIG: subcutaneous immunoglobulin; IQR: interquartile range.
Serious infection rate was low (median = 0; IQR = 0) for patients with a diagnosis of CVID or antibody deficiency. Serious infection was defined as bacterial pneumonia, bacteraemia or sepsis, osteomyelitis or septic arthritis, visceral abscesses and bacterial meningitis since last visit/year.
For other major health outcomes, those with a prevalence of ≥1% of all reported cases are shown in Table 5. The major concomitant disorders identified are either respiratory, e.g. bronchiectasis and asthma or haematological (splenomegaly and ITP). The annualized rate of infectious complications is given in Fig. S1. The minimum reported incidence of new infections peaks at 1·08/patient/annum in 2008. The majority of reported transplants were bone marrow transplant (64% of episodes), other haematopoietic stem cell (HSC) an additional 29%, with only 4% being a solid organ and 3% HSC with gene therapy. There were only 10 deaths recorded.
Table 5.
Serious health outcomes and interventions for all patients and common variable immunodeficiency (CVID_ subgroup; n represents the number of cases recorded; a single patient may have more than one complication or intervention. Cases with a prevalence of >1% of all reported cases only are shown
| (a) Major diagnosis non-malignant for all patients (n = 2480 cases) and CVID subset (n = 1492 cases) | ||
|---|---|---|
| All patients | ||
| Diagnosis | No. of cases reported | % of all cases reported |
| Bronchiectasis | 457 | 18·43 |
| Asthma | 171 | 6·90 |
| Splenomegaly, not elsewhere classified | 75 | 3·02 |
| Chronic obstructive pulmonary disease, unspecified | 57 | 2·30 |
| Idiopathic thrombocytopenic purpura | 55 | 2·22 |
| Chronic sinusitis | 43 | 1·73 |
| Essential (primary) hypertension | 41 | 1·65 |
| Osteoporosis, unspecified | 38 | 1·53 |
| Epilepsy | 33 | 1·33 |
| Atopic dermatitis | 31 | 1·25 |
| Hypothyroidism, unspecified | 31 | 1·25 |
| Non-insulin-dependent diabetes mellitus | 29 | 1·17 |
| CVID patients | ||
| Diagnosis | No. of cases reported | % of cases reported |
| Bronchiectasis | 294 | 19·71 |
| Asthma | 86 | 5·76 |
| Splenomegaly, not elsewhere classified | 64 | 4·29 |
| Idiopathic thrombocytopenic purpura | 50 | 3·35 |
| Chronic obstructive pulmonary disease, unspecified | 36 | 2·41 |
| Chronic sinusitis | 32 | 2·14 |
| Essential (primary) hypertension | 27 | 1·81 |
| Non-insulin-dependent diabetes mellitus | 23 | 1·54 |
| Osteoporosis, unspecified | 21 | 1·41 |
| Epilepsy | 20 | 1·34 |
| Disease of intestine, unspecified | 18 | 1·21 |
| Hypothyroidism, unspecified | 18 | 1·21 |
| Atopic dermatitis | 16 | 1·07 |
| Iron deficiency anaemia | 16 | 1·07 |
| Vitamin B12 deficiency anaemia | 16 | 1·07 |
| Other autoimmune haemolytic anaemias | 15 | 1·01 |
| (b) Tumour diagnosis in all patients from the registry (n = 120 cases) | ||
| Malignant diagnosis | No. of cases reported | % of all cases reported |
| Carcinoma in situ of skin | 9 | 7·50 |
| Hodgkins disease | 8 | 6·67 |
| B-cell lymphoma, unspecified | 7 | 5·83 |
| Carcinoma in situ of breast | 7 | 5·83 |
| Follicular non-Hodgkins lymphoma, unspecified | 7 | 5·83 |
| Malignant neoplasm of breast | 6 | 5·00 |
| Malignant neoplasm of prostate | 5 | 4·17 |
| Non-Hodgkins lymphoma, unspecified type | 5 | 4·17 |
| Carcinoma in situ of other specified sites | 4 | 3·33 |
| Chronic lymphocytic leukaemia | 4 | 3·33 |
| Carcinoma in situ of other and unspecified digestive organs | 3 | 2·50 |
| Diffuse non-Hodgkins lymphoma | 3 | 2·50 |
| Malignant neoplasm of bronchus and lung | 3 | 2·50 |
| Other specified types of non-Hodgkins lymphoma | 3 | 2·50 |
| Acute lymphoblastic leukaemia | 2 | 1·67 |
| Malignant melanoma of skin | 2 | 1·67 |
| Malignant neoplasm of anus and anal canal | 2 | 1·67 |
| Malignant neoplasm of colon | 2 | 1·67 |
| Malignant neoplasm of stomach | 2 | 1·67 |
| Multiple myeloma | 2 | 1·67 |
| Other disorders of pituitary gland | 2 | 1·67 |
| Other malignant neoplasms of skin | 2 | 1·67 |
| (c) Transplantation activity for all patients (n = 442) | ||
| Type | n | % of reported cases |
| Stem cells: bone marrow | 284 | 64·25 |
| Stem cells: peripheral blood | 69 | 15·61 |
| Stem cells: cord blood | 34 | 7·69 |
| Stem cells: unspecified | 24 | 5·43 |
| Gene therapy | 14 | 3·17 |
| Kidney | 8 | 1·81 |
| Liver | 4 | 0·90 |
| Lung | 4 | 0·90 |
| Heart | 1 | 0·23 |
Discussion
There has been a long-standing recognition of the need for an independent UK national PID Registry, as in other developed countries providing high-quality care for this patient group. The prior establishment of a working ESID platform and the ability to link the UKPID Registry to the larger ESID Registry to facilitate Europe-wide research and collaboration were important factors in its selection.
In 2009 there were seven UK centres contributing data directly to the ESID Registry. The core registry team (V.K., D.G., B.G.) were all based at the Royal Free Hospital (RFH) at the time of inception of UKPID Registry. Despite the fact that national multi-centre approval had been secured, experience demonstrated that many participating centres (both hospital research governance and local research ethics offices) interpreted the protocols individually and often required clarification of certain processes and procedures. This aspect caused and continues to cause delay in the recruitment of some centres. Nevertheless, it has provided a further governance safeguard.
An indication of the success of these early efforts is the fact that at the time of writing, 36 of 38 (95%) UK immunology centres have engaged with this project. It has been noted that the two supraregional centres for paediatric bone marrow transplantation of SCID in the United Kingdom are located in London and Newcastle upon Tyne and these, along with several other large adult PID centres in London, explain the large contribution from those cities. In the rest of the United Kingdom, immunology centres tend to be located in large cities with teaching hospitals, and so one would expect the distribution of patients to reflect that pattern of health-care service delivery. One-fifth of the patients registered are under the age of 16 years, consistent with the demographics of the general UK population. The historic establishment of data entry by the UK supraregional paediatric centres is also reflected in the current age bias within the registry, with one in five subjects under the age of 16.
Data presented at the 2012 ESID biennial conference indicate that the UKPID Registry is now one of the larger national registries in terms of patient recruitment. The total recruitment figure of 2229 patients compares with other national registries, as follows: France n = 4663, Spain n = 1910, Germany n = 1602 and Italy n = 1182, allowing for differences in population size. There has been a steady pattern of data accrual since the start of the project; the rate of increase has increased over the last 12 months with the recruitment of an additional 555 patients. Interrogation of the database indicates that this rapid increase over the past 12 months was not the result of a single factor or a single centre, but rather was the net result of active contribution of 18 of 27 centres. The increase in new patient data entry accounts for patients for whom there is a single visit with no follow-up at data lock.
The age and sex distribution of patients in the UKPID Registry demonstrates demographic shifts in different age ranges. Given that some PID conditions are inherited in an X-linked pattern, it is perhaps not surprising that there is a male predominance below the age of 30 years (overall female : male ratio = 0·59); however, this gender ratio is reversed in the adult population above 30 years (female : male ratio = 1·26). This is an unexpected finding which may be explained partially by the effect of X-linked conditions being less dominant in the older age group. Ascertainment bias in the currently recruited patients or previously unrecognized biases for females to present with adult-onset antibody deficiency are two other possible explanations. In studies of hospitalized patients there was a similar trend in all PID (female : male ratio = 1·13) and for CVID in the United States (NY State) there is evidence for a continuing trend for later onset of symptoms in females and older age at diagnosis 12–13.
The breakdown of diagnosis into the nine most common subgroups (Fig. 3) is consistent with other national registries, in that antibody deficiency syndromes are the most common, accounting for 61% of cases to date. The data collected to date suggest current overall prevalence of PID to be 3·5/100 000 of the population. It is likely that some conditions in which specific treatment is not always required, e.g. IgA deficiency, will be underestimated in this registry, as disorders associated with minimal symptoms may not need referral to secondary care. In 2009, when the ESID Registry last reported Europe-wide data, prevalence (per 100 000 population) was 3·7 in France with a minimum incidence of 12/100 000 live births 8, a 30-year cohort study from the United States at the same time reported a figure of 10·3/100 000 live births, compared to our observed peak incidence in 2000–2008 of 12·5/100 000 live births. In 2010 the French National Registry (CEREDIH) gave an overall prevalence of PID as 4·4/100 000 14. The German registry update of 2012 cites a prevalence of 1·5 per 100 000 population 15. The current UK data, presented with concurrent data from France and Germany (personal communication, B. Gathmann and N. Mahlaoui) is in keeping with these other countries, the prevalence being nearer to that estimated in France. The recent German data suggests that there is likely to be an ascertainment bias due to centres experiencing initial difficulties similar to those experienced in the United Kingdom.
Diagnostic delay (the time from symptom onset to diagnosis) can result in the difference between survival and non-survival in SCID. In this study the median age at diagnosis of SCID was 97 days, with a range 0–1389 days. These data include cases with a known family history and therefore diagnosed at birth, accounting for at least a percentage with very early diagnosis at birth. However, 75% of the cases were diagnosed after 1 month and 37% after 3 months allowing time for potential contraction of life-threatening infections and, in some cases, the administration of bacille Calmette–Guérin (BCG) vaccine. Of the cases with a diagnosis made after 6 months, the diagnosis was T− B+ SCID in 25 of 27 and T− B− SCID in two of 27. T−B+ SCID due to either Janus kinase 3 (JAK3) or interleukin (IL)-2 receptor gene are consistent with a milder phenotype, with previous patients reported as presenting for diagnosis as late as 72 months (2160 days) and with a mean of 7·5 months 16. Although these disorders are usually inconsistent with survival to adulthood if left untreated, with better outcomes when treated before the acquisition of infection, these data provide an insight into the prolonged time to presentation when there is not a relevant family history to guide antenatal testing.
In support of this, the two UK paediatric supraregional centres have previously reported outcomes of SCID in families with more than one affected sibling in the period 1982–2010 17. The median age of diagnosis in probands was 4·6 months (range 0–15 months), while in subsequent affected siblings the median age of diagnosis was 0 days (range 0–29 days). There was a far better outcome in the latter group. The technology for newborn screening for SCID on dried blood spots is now available and this has been introduced in several states in North America 18,19 and is being discussed in several European countries, including the United Kingdom. The sooner this can be implemented, the sooner we will be able to determine if improved outcomes truly correlate with reduced diagnostic delay for this most severe of all PIDs. It is worth noting that at present we do not capture data on patients who have died at the time of diagnosis. This will currently result in an underestimate of the prevalence of severe PID at least until newborn screening is implemented.
Diagnostic delay has long been recognized as an important contributor to morbidity in antibody deficiency 21–22. Time from diagnosis to treatment and suboptimal treatment adversely affect major morbidity and mortality related outcomes, including infectious complications and recognition and survival from malignancy related to immunodeficiency 22–23. Data collected to date indicate that it continues to be a problem, with the median diagnostic delay for CVID in an adult being diagnosed above age 30 years being 8 years; P < 0·05 (Table 2). Reducing the diagnostic delay for CVID and related disorders has been a long-held aspiration of clinical immunologists in the United Kingdom. The most common complication observed was bronchiectasis (at nearly 20% of the cohort), and observationally this is linked to diagnostic delay. These data suggest that progress remains unsatisfactory, at least in the cohort thus far recruited, and it will be important to monitor this indicator carefully as we increase patient recruitment to the registry. An interesting subanalysis of diagnostic delay data was observed when we looked at delay in diagnosis for CVID in relation to gender and age of onset of symptoms (Table 3). It appears that delay is greater for males whose symptoms have been present since early childhood compared to females (not significant). The reasons for this trend towards increased diagnostic delay for boys are not clear. One might speculate that there may be a greater focus on X-linked conditions for symptoms of childhood onset, and perhaps exclusion of these conditions in symptomatic males may lead to other conditions being temporarily overlooked. National surveys have identified gender differences in reported health (38% boys versus 27% girls). Gender-related differences may be due to illness behaviour, reporting and access to health care or gender bias in health-care providers 24.
Other major health outcomes largely reflect a cohort dominated by antibody deficiency, but the relatively high prevalence of cases of autoimmune complications, both solid organ and haematological, correlates with a complex caseload and validates a need to survey for autoimmune phenomena in our patient group. The overall prevalence of malignancies reported was 5% of the patient cohort (unless a single patient has more than one malignant diagnosis). Haematological cancers as a group accounted for 35% of all cases of malignancy with cutaneous malignancy unexpectedly high, at 7·5% of reported cases.
Immunoglobulin replacement therapy is the mainstay of management of the antibody deficiency syndromes. While SCIG has become a widely accepted modality of delivering immunoglobulin treatment, it is interesting to note that in the cohort of patients thus far entered, 60% are receiving intravenous immunoglobulin (IVIG). One would expect that as data entry becomes more complete over time, the proportion of SCIG will rise. A more complete data set will be achieved as the recently contributed centres recruit patients and as with time more longitudinal data are available. Similarly, the United Kingdom has a very active programme of training patients to self-administer their immunoglobulin treatment at home, either as SCIG or IVIG. The current data indicate that immunoglobulin replacement treatment is delivered in hospital for 26% of patients, and at home for 32%. In 43% of patients the place of infusion is not recorded. These data confirm the preference for home therapy in the United Kingdom, with the attendant benefits of patient empowerment.
The dose and serum IgG levels provide useful insight into treatment practice in the United Kingdom. There is very little variation in treatment intervals, with a median dose interval for IVIG of 21·4 days and SCIG of 7·1 days. There is also very little difference in median dose of immunoglobulin between the SCIG and IVIG groups, suggesting that patients are transferred from IVIG to SCIG on the same dose/kg, despite known differences in bioavailability of IgG between the two routes. The recorded serum IgG levels are slightly higher in the SCIG group, which is likely to reflect the differing dose intervals and kinetics of SCIG versus IVIG, and these levels in SCIG patients are not directly comparable to the trough levels in the IVIG treatment group. The median serum levels recorded are certainly within the levels predicted to prevent pneumonia; our observed prevalence of serious infection was low while patients still have some breakthrough infections 25. The annual incidence of new infection per prevalent patient with antibody deficiency in the registry is given in Fig. S1 and demonstrates a peak in reporting with >1 significant new infection per patient in 2008 versus the data in Table 4, which demonstrates nought to four infections since the last visit (with variable time-frames between visits) for patients with antibody deficiency.
The UKPID Registry project has been welcomed by the UK immunology community, as evidenced by the centre enrolment and rapid increase in patient data entry. Because of the longer-standing historic contribution to data from the paediatric centres, at present there is a relative skew to paediatric case load, but this also represents a cohort of patients which will migrate through to adult care and for whom services need to be provided. There remain challenges in terms of assisting and facilitating centres to move towards completion of their data entry. From other sources of information we estimate that there are likely to be between 4000 and 5000 PID patients in the United Kingdom, and we look forward to maximizing data entry over the next 2 years in an effort to capture as much information on this important patient cohort as is possible.
| Centre | No. of patients registered | Centre lead and co-author | Centre | No. of patients registered | Centre lead and co-author | |
|---|---|---|---|---|---|---|
| Royal Free Hospital, UCL London | 456 | Professor B. Grimbacher | 53 | Sheffield Teaching Hospitals NHS Foundation Trust | Dr R. Sargur | |
| Great North Children's Hospital, Newcastle | 263 | Dr M. Slatter | Dr A. R. Gennery | Epsom and St Helier University Hospitals Trust | 23 | Dr G. Hayman |
| Great Ormond Street Hospital and Institute of Child Health, London | 248 | Dr E. G. Davies | Hull and East Yorkshire Hospitals NHS Trust | 21 | Dr M. Abuzakouk | |
| Central Manchester University Hospitals. | 201 | Dr P. Arkwright | Royal Victoria Infirmary, Newcastle | 18 | Dr G. Spickett | |
| Barts and the London NHS Trust | 151 | Dr H. Longhurst | Royal Liverpool and Broadgreen University Hospitals | 14 | Dr C. J. Darroch | |
| Birmingham Heartlands Hospital | 98 | Dr A. Huissoon | Alder Hey Children's Hospital Liverpool | 14 | Dr S. Paulus | |
| Addenbrooke's Hospital, Cambridge | 94 | Dr D. S Kumararatne | Ninewells Hospital Dundee | 12 | Professor S. Marshall | |
| The Royal Hospitals, Belfast | 82 | Dr J. D. M. Edgar | Queen's Medical Centre, Nottingham | 10 | Dr E. M. McDermott | |
| Papworth NHS Foundation Trust, Cambridge | 79 | Dr H. Baxendale | St George's Hospital, London | 9 | Dr P. Heath | |
| Derriford Hospital, Plymouth | 76 | Dr C. Bethune | Aberdeen Royal Infirmary | 9 | Dr R. Herriot | |
| Leeds Teaching Hospitals NHS Trust | 74 | Dr P. Wood | Birmingham City Hospital | 9 | Dr S. Noorani | |
| John Radcliffe Hospital, Oxford | 73 | Dr S. Patel | Scottish National Blood Transfusion Service, Edinburgh | 7 | Professor M. Turner | |
| University Hospital of Wales, Cardiff | 71 | Dr S. Jolles | Frimley Park Hospital, Surrey | 3 | Dr S. Khan | |
| Salford Royal NHS Foundation Trust | 59 | Dr H. Alachkar |
Acknowledgments
Participating centres and co-authors
In addition to the above centres who are actively contributing data, the following nine centres are engaged in securing ethical and governance approvals to enable their participation: Bristol Southmead Hospital; Bristol University Hospital; Brighton and Sussex University Hospital; Dudley Hospital, Birmingham, Gartnavel General Hospital, Glasgow, Leicester Royal Infirmary, Southampton General Hospital, Preston Royal Infirmary and Sheffield Children's Hospital. S.J. is supported by a NISCHR Fellowship.
Disclosure
UKPID is supported by unrestricted educational grants from the following companies: Baxter, CSL Behring, Shire (UK), Grifols, Biotest, Octapharma and BPL. Administrative support is received from British Society for Immunology (BSI). The UKPID Registry has received support funding from the Health Care Quality improvement programme (HQIP). Technical, infrastructure and administrative support are received from European Society for Immune deficiency (ESID) and S.J. is supported by a NISCHR fellowship.
Supporting Information
Incidence of infections per patient per year.
Frequency table for individual diagnosis and disease prevalence. Estimated prevalence data for primary immunodeficiency (PID) in the United Kingdom based on national population of 62 989 550. (Eurostat: http://epp.eurostat.ec.europa.eu)
References
- 1.Bruton OC. Agammaglobulinemia. Pediatrics. 1952;9:722–728. [Google Scholar]
- 2.Chapel H. Classification of primary immunodeficiency diseases by the International Union of Immunological Societies (IUIS) Expert Committee on Primary Immunodeficiency 2011. Clin Exp Immunol. 2012;168:58–59. doi: 10.1111/j.1365-2249.2012.04561.x. [DOI] [PMC free article] [PubMed] [Google Scholar]
- 3.Keerthikumar S, Raju R, Kandasamy K, et al. RAPID: resource of Asian primary immunodeficiency diseases. Nucleic Acids Res. 2009;37:D863–867. doi: 10.1093/nar/gkn682. [DOI] [PMC free article] [PubMed] [Google Scholar]
- 4.Herriot R, Sewell WA. Antibody deficiency. J Clin Pathol. 2008;61:994–1000. doi: 10.1136/jcp.2007.051177. [DOI] [PubMed] [Google Scholar]
- 5.Cunningham-Rundles C. How I treat common variable immune deficiency. Blood. 2010;116:7–15. doi: 10.1182/blood-2010-01-254417. [DOI] [PMC free article] [PubMed] [Google Scholar]
- 6.Eades-Perner AM, Gathmann B, Knerr V, et al. The European internet-based patient and research database for primary immunodeficiencies: results 2004–06. Clin Exp Immunol. 2007;147:306–312. doi: 10.1111/j.1365-2249.2006.03292.x. [DOI] [PMC free article] [PubMed] [Google Scholar]
- 7.Gathmann B, Binder N, Ehl S, Kindle G. The European internet-based patient and research database for primary immunodeficiencies: update 2011. Clin Exp Immunol. 2012;167:479–491. doi: 10.1111/j.1365-2249.2011.04542.x. [DOI] [PMC free article] [PubMed] [Google Scholar] [Retracted]
- 8.Gathmann B, Grimbacher B, Beaute J, et al. The European internet-based patient and research database for primary immunodeficiencies: results 2006–08. Clin Exp Immunol. 2009;157(Suppl. 1):3–11. doi: 10.1111/j.1365-2249.2009.03954.x. [DOI] [PMC free article] [PubMed] [Google Scholar]
- 9.Gooi HC. Primary immunodeficiency register, United Kingdom: update 1992. Immunodeficiency. 1993;4:191–192. [PubMed] [Google Scholar]
- 10.Guzman D, Veit D, Knerr V, et al. The ESID Online Database network. Bioinformatics. 2007;23:654–655. doi: 10.1093/bioinformatics/btl675. [DOI] [PubMed] [Google Scholar]
- 11.Al-Herz W, Bousfiha A, Casanova JL, et al. Primary immunodeficiency diseases: an update on the classification from the International Union of Immunological Societies Expert Committee for Primary Immunodeficiency. Front Immunol. 2011;2:54. doi: 10.3389/fimmu.2011.00054. [DOI] [PMC free article] [PubMed] [Google Scholar]
- 12.Resnick ES, Moshier EL, Godbold JH, Cunningham-Rundles C. Morbidity and mortality in common variable immune deficiency over 4 decades. Blood. 2012;119:1650–1657. doi: 10.1182/blood-2011-09-377945. [DOI] [PMC free article] [PubMed] [Google Scholar]
- 13.Cunningham-Rundles C, Bodian C. Common variable immunodeficiency: clinical and immunological features of 248 patients. Clin Immunol. 1999;92:34–48. doi: 10.1006/clim.1999.4725. [DOI] [PubMed] [Google Scholar]
- 14.The French national registry of primary immunodeficiency diseases. Clin Immunol. 2010;135:264–272. doi: 10.1016/j.clim.2010.02.021. [DOI] [PubMed] [Google Scholar]
- 15.Gathmann B, Grimbacher B, Kindle G, et al. The German National Registry for Primary Immunodeficiencies (PID) Clin Exp Immunol. 2013;173:372–380. doi: 10.1111/cei.12105. [DOI] [PMC free article] [PubMed] [Google Scholar]
- 16.Notarangelo LD, Mella P, Jones A, et al. Mutations in severe combined immune deficiency (SCID) due to JAK3 deficiency. Hum Mutat. 2001;18:255–263. doi: 10.1002/humu.1188. [DOI] [PubMed] [Google Scholar]
- 17.Brown L, Xu-Bayford J, Allwood Z, et al. Neonatal diagnosis of severe combined immunodeficiency leads to significantly improved survival outcome: the case for newborn screening. Blood. 2011;117:3243–3246. doi: 10.1182/blood-2010-08-300384. [DOI] [PubMed] [Google Scholar]
- 18.Buckley RH. The long quest for neonatal screening for severe combined immunodeficiency. J Allergy Clin Immunol. 2012;129:597–604. doi: 10.1016/j.jaci.2011.12.964. [DOI] [PMC free article] [PubMed] [Google Scholar]
- 19.Mallott J, Kwan A, Church J, et al. Newborn screening for SCID identifies patients with ataxia telangiectasia. J Clin Immunol. 2013;33:540–549. doi: 10.1007/s10875-012-9846-1. [DOI] [PMC free article] [PubMed] [Google Scholar]
- 20.Chase NM, Verbsky JW, Routes JM. Newborn screening for SCID: three years of experience. Ann NY Acad Sci. 2011;1238:99–105. doi: 10.1111/j.1749-6632.2011.06241.x. [DOI] [PubMed] [Google Scholar]
- 21.Wood P. Primary antibody deficiencies: recognition, clinical diagnosis and referral of patients. Clin Med. 2009;9:595–599. doi: 10.7861/clinmedicine.9-6-595. [DOI] [PMC free article] [PubMed] [Google Scholar]
- 22.Spickett GP, Askew T, Chapel HM. Management of primary antibody deficiency by consultant immunologists in the United Kingdom: a paradigm for other rare diseases. Qual Health Care. 1995;4:263–268. doi: 10.1136/qshc.4.4.263. [DOI] [PMC free article] [PubMed] [Google Scholar]
- 23.Wood P, Stanworth S, Burton J, et al. Recognition, clinical diagnosis and management of patients with primary antibody deficiencies: a systematic review. Clin Exp Immunol. 2007;149:410–423. doi: 10.1111/j.1365-2249.2007.03432.x. [DOI] [PMC free article] [PubMed] [Google Scholar]
- 24.Richter M, Rathman K, Nic Gabhainn S, Zambon A, Boyce W, Hurrelmann K. Welfare state regimes, health and health inequalities in adolescence: a multilevel study in 32 countries. Sociol Health Illn. 2012;34:858–879. doi: 10.1111/j.1467-9566.2011.01433.x. [DOI] [PubMed] [Google Scholar]
- 25.Orange JS, Grossman WJ, Navickis RJ, Wilkes MM. Impact of trough IgG on pneumonia incidence in primary immunodeficiency: a meta-analysis of clinical studies. Clin Immunol. 2010;137:21–30. doi: 10.1016/j.clim.2010.06.012. [DOI] [PubMed] [Google Scholar]
Associated Data
This section collects any data citations, data availability statements, or supplementary materials included in this article.
Supplementary Materials
Incidence of infections per patient per year.
Frequency table for individual diagnosis and disease prevalence. Estimated prevalence data for primary immunodeficiency (PID) in the United Kingdom based on national population of 62 989 550. (Eurostat: http://epp.eurostat.ec.europa.eu)