

Abstract
Although reduced natural killer (NK) cell levels have been reported consistently in patients with coronary artery disease (CAD), the clinical significance and persistence of this immune perturbation is not clarified. In this study we characterized the NK cell deficit further by determining (i) differentiation surface markers and cytokine profile of NK cell subsets and (ii) ability to reconstitute NK cell levels over time. Flow cytometry was used to analyse NK cell subsets and the intracellular cytokine profile in 31 patients with non-ST elevation myocardial infarction (non-STEMI), 34 patients with stable angina (SA) and 37 healthy controls. In blood collected prior to coronary angiography, the proportions of NK cells were reduced significantly in non-STEMI and SA patients compared with controls, whereas NK cell subset analyses or cytokine profile measurements did not reveal any differences across groups. During a 12-month follow-up, the proportions of NK cells increased, although not in all patients. Failure to reconstitute NK cell levels was associated with several components of metabolic syndrome. Moreover, interleukin (IL)-6 levels remained high in patients with sustained NK cell deficit, whereas a decline in IL-6 (P < 0·001) was seen in patients with a pronounced increase in NK cells. In conclusion, we found no evidence that reduction of NK cells in CAD patients was associated with aberrations in NK cell phenotype at any clinical stage of the disease. Conversely, failure to reconstitute NK cell levels was associated with a persistent low-grade inflammation, suggesting a protective role of NK cells in CAD.
Keywords: coronary artery disease, cytokines, inflammation, leukocytes, natural killer cell
Introduction
Natural killer (NK) cells are key players in the innate immune response, exhibiting potent cytotoxic function 1. In addition, NK cells produce a variety of cytokines and can thereby act as regulators of both innate and adaptive immunity 2. In peripheral blood, NK cells normally constitute approximately 15% of lymphocytes. Two major subsets are defined on the basis of CD56 expression: CD56bright and CD56dim cells, the latter comprising > 90% of NK cells 3. Increasing evidence suggests that CD56bright cells are the precursors of CD56dim cells 4. The maturational stage of CD56dim NK cells can be characterized further by CD57 expression, as this surface receptor is present on terminally differentiated CD56dim NK cells 5. The CD56bright NK cells have long been considered the main source of cytokine production, whereas the CD56dim subset has been associated predominantly with cytotoxicity. However, recent studies indicate that the CD56dim cells, in particular the CD56dimCD57+ subset, are also a source of interferon (IFN)-γ 5. Moreover, NK cell function is mediated by a variety of inhibitory and activating receptors on the cell surface. The expression of so-called killer immunoglobulin-like receptors (KIR) is determined genetically, but can be modulated by viral infections such as cytomegalovirus (CMV) 6–7
NK cells may play an important, but hitherto less well-known, role in chronic inflammatory conditions, such as atherosclerosis. In previous cross-sectional studies, several investigators have reported a reduction in NK cells and a concomitant loss of NK cell activity in patients with coronary artery disease (CAD) compared with healthy controls 8,9. Furthermore, the NK cell deficit seems to be more pronounced in patients with acute settings of CAD 10–11. However, the persistence and clinical relevance of these NK cell changes are not known. While experimental studies of NK cell depletion in rodents show inconsistent results (reviewed in Galkina 12, studies in humans indicate that well-preserved NK cell numbers and function are markers of healthy ageing, whereas decreased NK cell levels or function are associated with chronic inflammatory diseases such as rheumatoid arthritis, multiple sclerosis and psoriasis 13–14. A protective and immunoregulatory role of NK cells has also been shown in experimental models of autoimmune diseases 15,16, and recently in patients with rheumatoid arthritis where NK cell numbers were related inversely to disease activity 18. Interestingly, NK cells producing T helper type 2 (Th2) cytokines have been associated with remission of inflammatory diseases 19–20. Moreover, a functional subset of NK cells producing both IFN-γ and IL-17 was identified recently in multiple sclerosis 21.
Our aim in this study was to assess whether low NK cell levels in CAD patients represented a permanent phenomenon or fluctuated over time, depending on clinical disease activity or other factors. An additional aim was to determine if the NK cell status, based on differentiation surface markers and cytokine profile, differed between patients with non-ST elevation myocardial infarction (non-STEMI), stable angina (SA) and controls.
Material and methods
Subjects
The study population consisted of 31 patients with non-STEMI, 34 patients with SA and 37 healthy control subjects. Coronary angiograms were performed in all patients at day 1. Blood samples were always collected immediately prior to coronary angiography, and in non-STEMI patients within 24 h from admission. The patients were followed longitudinally; after 3 months samples were collected in 16 non-STEMI and 29 SA patients, and after 12 months in 15 non-STEMI and 28 SA patients. The non-STEMI patients were included if they had a diagnosis based on typical electrocardiographic (ECG) changes (ST-T segment depression and/or T-wave inversion) and elevated troponins. The SA patients were referred for elective coronary angiography if they had effort angina classes II or III, in accordance with Canadian Cardiovascular Society Classification, and objective signs of ischaemia based on exercise testing or myocardial scintigraphy. Patients were excluded if they had severe heart failure or severe left ventricular systolic dysfunction, immunological disorders, neoplastic disease, evidence of acute or recent (<2 months) infection, recent major trauma, surgery or revascularization procedure and treatment with immunosuppressive or anti-inflammatory agents (except low-dose aspirin). Loss to follow-up was due mainly to geographic or logistic factors. The age- and sex-matched control subjects, selected randomly from a population-based register representing the hospital recruitment area, were healthy and received no medication according to questionnaires. The study was conducted in accordance with the ethical guidelines of Declaration of Helsinki, and the research protocol was approved by the Ethical Review Board of Linköping University. Written informed consent was obtained from all study participants.
Because NK cell levels show biological variation over time 22 we wanted, as a reference, to examine the current variation in healthy controls. We therefore repeatedly performed flow cytometric analyses of fresh blood samples from seven healthy subjects (five women and two men, median age 42 years, range 35–55) over a 5-year period (2007–11) and determined the coefficients of variation (CV), defined as standard deviation divided by the mean expressed as a percentage. These analyses, being part of the quality assessment programme according to ISO/IEC 17025 standards, were performed in parallel with the patient samples.
Monoclonal antibodies and in-vivo lymphocyte profiles
Lymphocyte and NK subpopulations were measured by multi-colour combinations. The following monoclonal antibodies were used: CD3-fluorescein isothiocyanate (FITC) (cloneSK7), CD57-FITC (clone HNK-1), human leucocyte antigen D-related (HLA-DR)-FITC (clone L293), anti-Hu KIR (NKB1)-FITC (DX9), CD16/56-phycoerythrin (PE) [clone B73·1/neural cell adhesion molecule (NCAM) 16·2], CD69-PE (clone L78), NKAT2-PE (clone DX27), CD3-peridinin chlorophyll protein (PerCP) (clone SK7), CD45-PerCP (clone 2D1), CD56-PE-Cy7 (NCAM 16·2), CD19-allophycocyanin (APC) (clone SJ2SC1), CD56-APC (clone NCAM 16·2) and CD94-APC (clone HP-3D9) All monoclonal antibodies were purchased from BD Biosciences (San José, CA, USA). NKG2a-PE (clone Z199) purchased from Beckman Coulter Inc (Fullerton, CA, USA). A description of panels of antibodies is included in the online Supporting information (Table S1).
To determine the number of lymphocytes, a Trucount™ tube (BD Biosciences), containing an exact number of lyophilized beads, was used. In the same tube, numbers and proportions of leucocyte populations were assessed based on CD45+ and side-scatter characteristics. The absolute number of cells from this tube was then applied in all other tubes. Fifty μl of ethylenediamine tetraacetic acid (EDTA) blood was added to appropriate amounts of each antibody and incubated for 15 min in the dark at room temperature (RT). After incubation, erythrocytes were lysed with 450 μl FACS™ Lysing Solution (BD Biosciences) for 15 min at RT in darkness. Tubes without beads were washed with phosphate-buffered saline with 2% human serum albumin, resuspended in wash buffer and analysed immediately.
Whole blood stimulation and detection of intracellular cytokines
This substudy included 10 non-STEMI patients, 14 SA patients and 12 controls. For detection of intracellular cytokines, the FastImmune protocol (BD Biosciences) for whole blood stimulation was followed. In brief, heparinized whole blood was stimulated ex vivo for 6 h at 37°C and 5% CO2 with anti-CD28/CD49d (BD Biosciences), 50 ng/ml phorbol 12-myristate 13-acetate (PMA; Sigma, St Louis, MO, USA) and 1 μg/ml ionomycin (Sigma) in the presence of 10 μg/ml brefeldin A (BD Biosciences). Stimulated and unstimulated samples were then incubated for 15 min at RT with EDTA solution (BD Biosciences) followed by lysis of erythrocytes and fixation of cells for 10 min in RT with FACS™ Lysing Solution (BD Biosciences). The samples with stimulated cells were stored immediately at −70°C. After thawing, cells were permeabilized for 10 min at RT with permeabilizing solution 2 (BD Biosciences). They were washed and subsequently stained for IFN-γ, tumour necrosis factor (TNF), interleukin (IL)-10, IL-13 or IL-17A, followed by staining of surface markers, including early activation marker CD69, for 30 min at RT. After washing, cells were resuspended in 1% paraformaldehyde/phosphate-buffered saline and analysed immediately by flow cytometry. Cytokine-producing cells were identified by a six-colour staining system using anti-cytokine PE, CD3-FITC (clone SK7), CD69-PE-Cy7 (clone FN50), CD4-APC (clone SK3), CD8-APC-H7 (clone SK1) and CD56 Horizon V450 (clone B159). For cytokine staining, antibodies to IFN-γ-PE (clone 25723·11), TNF-PE (clone 6401·1111, IL-10-PE (clone JES3-9D7), IL-13-PE (clone JES10-5A2) and IL-17A-PE (clone SCPL1362) were used. All monoclonal antibodies were purchased from BD Biosciences (San José, CA). A description of antibody panels is included in the online Supporting information (Table S2).
Flow cytometry analysis
The analyses of lymphocytes and cytokine-producing cells were performed on a FACSCanto A or FACSCanto II (BD Biosciences) equipped with an argon laser 488 nm, a red laser 633 nm and a violet laser 405 nm. Control of the instrument settings was performed daily with seven-colour Setup Beads™ or FACSDiva™ software or Cytometer Setup and Tracking beads™ (BD Biosciences) and Cytometer Setup and Tracking™ software, according to the standard procedure. Acquisition was performed until 10 000 lymphocytes were recorded. Data analyses were performed with FACSDiva™ (BD Biosciences) software. Fluorescence minus one (FMO) gating strategy was used to discriminate stained cells with a continuous expression from the negative to the positive population. Dot-plots showing FMO gating strategy for CD69 and HLA-DR are included in the online Supporting information (Fig. S1).
Assays for IL-6, IL-15 and cytomegalovirus serology in plasma
The concentrations of IL-6 and IL-15 were measured in plasma using a chemiluminiscence-based enzyme-linked immunosorbent assay (ELISA) (QuantiGlo chemiluminiscent ELISAs; R&D Systems, Abingdon, UK) with a detection limit of 0·048 pg/ml and 1·03 pg/ml, respectively. Anti-CMV IgG was detected in plasma samples by chemiluminescent microparticle immunoassay (CMIA) (Architect, Abbott Laboratories, Abbott Park, IL, USA). Antibody levels ≥ 6·0 IU/ml were considered positive.
Statistical methods
IBM spss statistics version19 (SPSS Inc., Chicago, IL, USA) was used for statistical analyses. The χ2 test was used for nominal data. Differences between all three groups were analysed with the Kruskal–Wallis test and, if P-values were <0·10, the Mann–Whitney U-test was used for between-group analyses. Wilcoxon's signed-ranks test was used for pairwise comparisons. For correlation analyses, Spearman's rank correlation method was used. Statistical significances were set at a two-tailed P-value of <0·05. Values are given as median (interquartile range).
Results
Characteristics of patients and controls
The characteristics of patients (at day 1) and controls are listed in Table 1. At day 1, 10 (29%) SA patients and 15 (48%) non-STEMI patients underwent percutaneous coronary intervention while 16 (47%) SA patients and five (16%) non-STEMI patients were referred for coronary bypass surgery. Seven SA patients and 10 non-STEMI patients received optimized anti-anginal therapy only. Blood samples were always collected prior to coronary investigation. All patients were on low-dose aspirin and various combinations of β-blockers, calcium-antagonists and nitrates. Compared with non-STEMI patients, SA patients were, to a larger extent, treated long-term, i.e. >2 months, with statins. However, at 3 months follow-up, 96% of the SA patients and 100% of the non-STEMI patients received statins, resulting in similar low-density lipoprotein (LDL) cholesterol levels in both groups. Remnant cholesterol [calculated as total cholesterol minus high-density lipoprotein (HDL) cholesterol minus LDL cholesterol] was raised in the patient groups compared to controls. The proportions of CMV seropositive individuals were similar in the three groups and did not change over 12 months.
Table 1.
Clinical and laboratory characteristics of coronary artery disease (CAD) patients (at day 1) and controls.
| Non-STEMI (n = 31) | SA (n = 34) | Controls (n = 37) | P-value | |
|---|---|---|---|---|
| Age, years | 69 (50–83) | 63 (44–77) | 63 (45–77) | n.s. |
| Female (%) | 23 | 18 | 24 | n.s. |
| Smokers (%) | 23c | 15c | 3 | <0·001 |
| Waist circumference (cm) | 98 (93–108)a | 102 (94–108)b | 94 (89–99) | 0·006 |
| Hypertension (%) | 35c,d | 71c | 0 | <0·001 |
| Diabetes (%) | 10 | 12 | 0 | n.s. |
| Prior history of CAD, % | 13 | 24 | 0 | n.s. |
| Normal left ventricular systolic function (%) | 65 | 62 | – | n.s. |
| Left ventricular systolic dysfunction, mild/moderate, (%) | 29/6 | 29/9 | – | n.s. |
| Statin treatment % | 41c,e | 79c | 0 | <0·001 |
| CMV IgG seropositive % | 76 | 86 | 85 | n.s. |
| Total cholesterol, mmol/l | 5·3 (4·4–6·4) | 5·0 (4·1–5·5) | 5·5 (4·9–6·4) | n.s. |
| LDL cholesterol, mmol/l | 3·3 (1·9–4·1) | 2·7 (2·2–3·5) | 3·4 (2·8–4·0) | n.s. |
| HDL cholesterol, mmol/l | 1·3 (1·0–1·5) | 1·2 (1·1–1·4) | 1·4 (1·2–1·8) | n.s. |
| Triglycerides, mmol/l | 1·4 (1·2–1·8)a | 1·4 (1·1–1·9)a | 1·1 (0·9–1·6) | 0·009 |
| Remnant cholesterol, mmol/l | 0·7 (0·5–1·1)a | 0·7 (0·5–1·2)b | 0·6 (0·3–0·7) | 0·008 |
| Cystatin C, mg/l | 1·1 (1·0–1·3) | 1·1 (1·0–1·2) | 1·1 (1·1–1·2) | n.s. |
| IL-6, pg/ml | 4·0 (1·7–7·5)c | 3·2 (2·0–6·5)c | 1·4 (1·0–2·2) | <0·001 |
| IL-15, pg/ml | 3·1 (2·7–3·6) | 2·9 (2·3–3·2) | 2·5 (2·2–3·2) | n.s. |
The values are given as median (interquartile range).
P < 0·05;
P < 0·01;
P < 0·001 compared to controls and
P < 0·01;
P < 0·001 compared to stable angina (SA). P-value column refers to Kruskal–Wallis test for ordinal data and χ2 test for nominal data, comparing non-ST elevation myocardial infarction (non-STEMI), SA and control groups. Normal left ventricular systolic function: ejection fraction ≥ 55%, mild left ventricular systolic dysfunction: ejection fraction 45–54%, moderate left ventricular systolic dysfunction: ejection fraction 30–44%. CMV: cytomegalovirus; LDL: low-density lipoprotein; HDL: high-density lipoprotein; Ig: immunoglobulin; n.s.: not significant.
Circulating NK cells and characterization of NK cell phenotype based on surface markers
The total numbers of lymphocytes did not differ significantly between groups at day 1 (Table 2). The proportions of NK cells were decreased significantly in both patient groups compared with controls. However, the distribution of CD56bright and CD56dim subsets within the NK cell population did not differ between the three groups, nor did the distribution of CD57+ cells or CD57− cells within the CD56dim population [representative flow cytometry plots in Fig. 1 and in the online Supporting information (Fig. S2)]. The proportions of NK cells expressing the early activation marker CD69 and late activation marker HLA-DR were low, with no differences between patients and controls (Table 2). Representative dot-plots are included in the online Supporting information (Fig. S2). We also assessed a limited number of inhibitory receptors. KIR-NKAT2 was expressed by a third of the CD56dim population, while KIR-NKB1 was expressed by 5–10%. Also, the NKG2a/CD94 complex was expressed by a third of the CD56dim population. There were no significant differences between the three groups regarding KIR or NKG2a/CD94 (data not shown). The proportions of T cells (Table 2) were significantly higher in both non-STEMI and SA patients compared to controls, while the proportions of B cells did not differ between groups. The expression of activation markers CD69 and HLA-DR on T cells was similar in patients and controls (Table 2).
Table 2.
Lymphocytes and lymphocyte subpopulations in coronary artery disease (CAD) patients and controls.
| Non-STEMI (n = 31) | SA (n = 34) | Controls (n = 37) | P-value | |
|---|---|---|---|---|
| Lymphocytes, cells/μl | 2332 (1717–2782) | 1996 (1308–2749) | 1967 (1415–2430) | n.s. |
| NK cells (CD3−16/56+) | 12 (9·8–15)b | 12 (9·1–18)a | 18 (11–29) | 0·010 |
| NKbright | 4·4 (3·2–7·3) | 3·7 (2·2–6·6) | 4·3 (2·6–6·9) | n.s. |
| NKdim | 96 (93–97) | 96 (93–98) | 96 (93–97) | n.s. |
| NKdim57− | 55 (36–69) | 49 (36–66) | 46 (31–59) | n.s. |
| NKdim57+ | 45 (31–64) | 51 (34–65) | 54 (41–70) | n.s. |
| NK 69+ | 2·1 (0·6–5·3) | 1·8 (0·8–3·5) | 1·3 (0·6–2·3) | n.s. |
| NK HLA-DR+ | 4·1 (2·3–8·8) | 5·0 (3·0–7·5) | 3·0 (1·9–5·5) | n.s. |
| T cells (CD3+) | 76 (68–80)b | 75 (71–80)b | 65 (60–79) | 0·001 |
| CD3+69+ | 0·3 (0·2–0·6) | 0·4 (0·2–0·8) | 0·7 (0·4–1·0) | n.s. |
| CD3+HLA-DR+ | 13 (6·4–16) | 13 (7·5–12) | 11 (8·3–17) | n.s. |
| B cells (CD3−19+) | 8·7 (7·8–12) | 11 (6·8–12) | 9·6 (7·5–14) | n.s. |
Values are given as median (interquartile range) and (except for lymphocyte numbers) refer to percentages of the parent population.
P < 0·05;
P < 0·01 compared with controls. P-value column refers to Kruskal–Wallis test comparing non-ST elevation myocardial infarction (non-STEMI), stable angina (SA) and control groups. NK: natural killer; HLA-DR: human leucocyte antigen D-related; n.s.: not significant.
Figure 1.
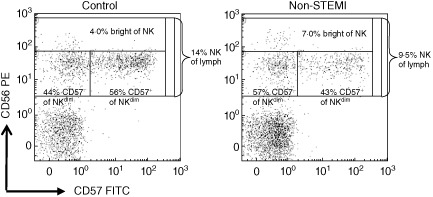
Gating strategies of natural killer (NK) subpopulations. Representative examples of dot plots from one healthy control and one non-ST elevation myocardial infarction (non-STEMI) patient. The CD3− lymphocytes were initially gated and then analysed in a plot of CD56 and CD57 expression. The total NK cell proportion was 14% of lymphocytes in the control and 9·5% in the patient. NK subpopulations were first evaluated according to CD56 expression showing 4·0% CD56bright in the control and 7·0% CD56bright in the patient, expressed as the percentage of NK cells. Next, CD56dim cells were divided according to CD57 expression showing 44% CD57− and 56% CD57+, respectively, in the control and 57% CD57− and 43% CD57+, respectively, in the patient, expressed as percentage of CD56dim cels.
Characterization of NK cell phenotype based on intracellular cytokine staining
The intracellular staining of cytokines after PMA stimulation ex vivo did not reveal any significant changes between the three groups. In all 36 individuals, IFN-γ was detected in 32 (23–44)% of CD56dim NK cells and 38 (27–52)% of CD56bright NK cells (P < 0·05 between cell populations), whereas TNF was detected in 9·9 (4·9–16)% of CD56dim NK cells and 10 (6·1–19)% of CD56bright NK cells [not significant (n.s.) between cell populations]. The intracellular staining of IL-10, IL-13 and IL-17A was low (<0·4%) in both CD3−CD56dim and CD3−CD56bright NK cells in all groups.
Longitudinal follow-up of circulating NK cells and NK cell subsets
Lymphocyte subpopulations during follow-up are presented in Table 3. NK cell levels increased significantly within both the non-STEMI and SA group and data are therefore presented for the whole patient population. There was no significant variation over time regarding proportions of NK cell subsets, including CD56bright cells, CD56dim cells and CD56dimCD57− cells, nor were there any changes in KIR or NKG2a/CD94 expression (data not shown). The proportions of T cells and B cells showed significant decreases over time. The expression of activation markers CD69 and HLA-DR did not show any alterations over time, either on NK cells or on T cells (Table 3). Conversely, IL-6 levels in non-STEMI and SA patients at day 1 declined significantly (P < 0·01 for both groups) reaching levels of 1·9 (1·4–3·0) and 2·1 (1·1–3·0) pg/ml at 12 months, respectively. The levels of IL-15 did not change over time (data not shown).
Table 3.
Longitudinal follow-up of lymphocyte populations in non-ST elevation myocardial infarction (non-STEMI), stable angina (SA) patients.
| Day 1 | 3 months | 12 months | P-value | |
|---|---|---|---|---|
| Lymphocytes cells/μl | 2103 (1564–2594) | 1914 (1490–2610) | 2254 (1449–2883) | n.s. |
| NK cells, % | 12 (9·2–16) | 14 (9·9–20) | 16 (11–20) | 0·001 |
| NK 69+ | 1·2 (0·5–2·8) | 1·2 (0·2–2·9) | 1·6 (0·8–5·1) | n.s. |
| NK HLA-DR+ | 4·1 (2·4–8·3) | 4·3 (1·9–6·4) | 4·1 (1·9–6·3) | n.s. |
| T cells, % | 75 (68–79) | 75 (69–79) | 74 (68–78) | 0·041 |
| CD3+69+ | 0·4 (0·2–0·6) | 0·3 (0·1–0·9) | 0·4 (0·3–0·8) | n.s. |
| CD3+HLA-DR+ | 12 (7·4–16) | 10 (5·5–17) | 12 (8·1–17) | n.s. |
| B cells, % | 11 (7·8–13) | 9·1 (5·8–12) | 10 (6·4–12) | <0·001 |
Values are given as medians (interquartile range). P-value refers to Wilcoxon comparing differences within the CAD group at day 1 and 12 months. NK: natural killer; HLA-DR: human leucocyte antigen D-related; n.s.: not significant.
Subdivision of patients into NK cell ‘increase group’ and NK cell ‘non-increase group’
Because NK cells were shown to be the lymphocyte population with the highest variation in our previous study, we tested if this was also true with the currently used instrument and settings. In 228 samples from seven control subjects collected over 5 years, in parallel with the study, the total CVs for proportions of various cell subsets differed, from 3 (2–4)% for CD3+ cells to 20 (18–22)% for NK cells, which is in line with our previous results; 4 (1–9)% for CD3+ cells and 22 (14–30)% for NK cells. For the patients in the present study, the total CV for NK cell proportions (based on the three sample occasions) was 22 (13–30)%. Thus, based on the high variation of NK cells, we wanted to create two clearly distinguished groups. By dividing patients into tertiles based on the percentage change in NK cell levels after 12 months we created one NK cell ‘increase group’ (upper tertile, n = 14) in whom NK cells increased by 83 (range 53–97)% and one ‘non-increase group’ (lower tertile, n = 14) in whom NK cells decreased by – 11 (range −26 to −0) %. Clinical and laboratory characteristics of the upper and lower tertiles are given in Table 4. Waist circumferences were significantly higher in the NK cell ‘non-increase group’, as were triglycerides (TG) levels at day 1 (Table 4). TG levels decreased in both groups but remained significantly higher in ‘non-increase group’ at 3 months. At day 1, remnant cholesterol (as a measure of cholesterol in triglyceride-rich lipoproteins) was significantly higher in the NK cell ‘non-increase’ group compared with controls (P 0·004), while the NK cell ‘increase group’ did not differ from controls. At day 1, IL-6 levels were equally high in both groups but showed a significant decline within the NK cell ‘increase group’ only (P < 0·01). At 3 months, IL-6 levels were significantly higher in the NK cell ‘non-increase group’ compared with the NK cell ‘increase group’ and also compared with controls (P < 0·01 for both comparisons). Conversely, IL-15 did not differ between the two groups at any time-point (data not shown). The expression of activation markers CD69 and HLA-DR on NK cells and T cells did not differ between NK cell ‘non-increase group’ or NK cell ‘increase group’ at any time-point (data not shown). In the whole patient cohort, there were no significant correlations between NK cell subsets and clinical or laboratory characteristics, including CMV seropositivity. Levels of IL-6 correlated with waist circumference (r = 0·30, P < 0·05), cystatin C levels (r = 0·31, P < 0·05) and IL-15 levels (r = 0·32, P < 0·05). IL-6 levels also correlated inversely at the 3-month follow-up with the proportions of CD56dimCD57− cells (r = −0·45, P < 0·01).
Table 4.
Clinical and laboratory characteristics of non-ST elevation myocardial infarction (non-STEMI), stable angina (SA) patients divided on the basis of % change in NK cells over 12 months.
| ‘Increase group’ | ‘Non-increase group’ | P-value | |
|---|---|---|---|
| Upper tertile (n = 14) | Lower tertile (n = 14) | ||
| Age, years | 61 (58–71) | 66 (58–72) | n.s. |
| Female (%) | 26 | 26 | n.s. |
| Smokers (%) | 21 | 21 | n.s. |
| Waist circumference (cm) | 94 (90–104) | 104 (97–110) | 0·036 |
| Hypertension (%) | 64 | 64 | n.s. |
| Diabetes (%) | 0 | 14 | n.s. |
| ACS as index event, % | 43 | 29 | n.s. |
| Prior history of CAD, % | 14 | 36 | n.s. |
| Normal left ventricular systolic function (%) | 86 | 71 | n.s. |
| Left ventricular systolic dysfunction, mild/moderate, % | 7/7 | 29/0 | n.s. |
| Statin treatment, % | |||
| Day 1 | 50 | 64 | n.s. |
| 3 months | 86 | 93 | n.s. |
| CMV IgG seropositive % | 71 | 86 | n.s. |
| LDL cholesterol, mmol/l | |||
| Day 1 | 3·6 (2·6–4·2) | 2·5 (2·3–3·4) | n.s. |
| 3 months | 2·4 (1·9–3·2) | 2·1 (1·6–2·4) | n.s. |
| HDL cholesterol, mmol/l | |||
| Day 1 | 1·4 (1·2–1·5) | 1·2 (1·0–1·5) | n.s. |
| 3 months | 1·4 (1·2–1·6) | 1·2 (1·0–1·4) | n.s. |
| Triglycerides, mmol/l | |||
| Day 1 | 1·3 (1·0–1·8) | 1·6 (1·4–2·6) | 0·038 |
| 3 months | 1·0 (0·9–1·3) | 1·5 (1·2–2·0) | 0·005 |
| Remnant cholesterol, mmol/l | |||
| Day 1 | 0·7 (0·5–1·1) | 0·8 (0·6–1·3) | n.s. |
| 3 months | 0·5 (0·4–0·7) | 0·7 (0·5–1·6) | n.s. |
| Cystatin C, mg/l | |||
| Day 1 | 1·2 (0·9–1·3) | 1·1 (1·0–1·2) | n.s. |
| 3 months | 1·1 (0·9–1·3) | 1·1 (1·1–1·3) | n.s. |
| IL-6, pg/ml | |||
| Day 1 | 3·8 (1·7–5·3) | 4·3 (2·3–6·7) | n.s. |
| 3 months | 1·7 (1·0–2·3) | 3·0 (2·4–4·0) | 0·003 |
Values are given as medians (interquartile range). P-value refers to Mann–Whitney test for ordinal data and χ2 test for nominal data, comparing ‘increase group and ‘non-increase group’. ACS: acute coronary syndrome; CAD: coronary artery disease; CMV: cytomegalovirus; LDL: low-density lipoprotein; HDL: high-density lipoprotein; IL: interleukin; Ig: immunoglobulin.
Discussion
Reduced proportions of NK cells in peripheral blood were seen in both non-STEMI patients and in patients with symptomatic stable angina. These findings are in agreement with previous reports of reduced NK cell levels in patients with CAD 8–11. However, in this longitudinal study we show for the first time that proportions of NK cells in CAD patients are restored to levels similar to controls over 1-year follow-up. The recovery of NK cells in non-STEMI patients suggests that reduced levels are associated with disease activity. Unexpectedly, SA patients also showed an increase in NK cells over time, a phenomenon that may be explained by clinical improvement, i.e. relief of angina due to coronary intervention and optimized medication. Interestingly, an inverse association between NK cell levels and disease activity was demonstrated recently in patients with rheumatoid arthritis 18. These authors showed that an increase in NK cell levels after rituximab treatment was a predictor of clinical response, as assessed by disease activity score.
However, not all patients showed an increase in NK cells during follow-up. The so-called NK cell ‘non-increase group’ was characterized by larger waist circumference and higher TG levels, i.e. features associated with the metabolic syndrome. Levels of remnant cholesterol were also higher in the NK cell ‘non-increase’ group. Remnant cholesterol is an indicator of atherogenic lipoproteins, and has been associated with the metabolic syndrome 23–24. Moreover, we found that IL-6 levels remained at a significantly higher level during follow-up in the NK cell ‘non-increase group’, while IL-6 levels were normalized in those with reconstituted NK cell levels. In addition, higher IL-6 levels at 3 months were associated with lower proportions of CD56dimCD57− cells, which may point towards a lower NK cell proliferation rate in the NK cell ‘non-increase group’ 4–25. On the basis of experimental studies, a proinflammatory state may inhibit NK cell development and shorten the survival of NK cells 26. Metabolic syndrome is associated with low-grade systemic inflammation and, interestingly, it has been reported that obese subjects with metabolic syndrome have significantly lower NK cell levels than obese subjects without metabolic syndrome 27. It was also shown recently that TNF in plasma correlated negatively with proportions of NK cells and positively with Tim-3 expression on NK cells in CAD patients 10. In contrast to IL-6, IL-15 in plasma did not show any correlations with NK cell changes in our cohort. IL-15 is a cytokine that has been associated specifically with survival of NK cells 3. However, it may be difficult to draw any conclusions from measurements of IL-15 in plasma, as a substantial amount of the cytokine is receptor-bound.
A remodelling of NK cell subsets, involving a decrease in CD56bright NK cells and a concomitant increase in CD56dimCD57+ NK cells, has been associated with a lower proliferation rate of NK cells ageing as well as CMV seropositivity 4. However, in this study we did not find any evidence that the distributions of CD56bright cells, CD56dimCD57− cells and CD56dimCD57+ cells differed between patients and controls, nor did NK cell subsets correlate with CMV seropositivity.
NK cells expressing the activation markers CD69 and HLA-DR are detected at low levels in circulating blood, but have been shown to increase in acute inflammatory conditions such as hepatitis and influenza 28–29. However, our results suggest that the low-grade systemic inflammation in CAD is not sufficient to enhance the expression of CD69 or HLA-DR either on circulating NK cells or on T cells. Previous studies have shown increased expression of these activation markers on circulating T cells in patients with acute coronary events 30,31. Explanations behind our discrepant finding may include such factors as blood sampling times and therapeutic regimens. Nevertheless, an increased activation of NK cells may exist in CAD patients, as suggested by Hou et al. 10. In line with this, we have reported that the expression of the IL-18 receptor is increased on NK cells in non-STEMI patients 11 and, furthermore, that NK cells in both non-STEMI and SA patients are more prone to activation by IL-2 compared with controls 8. Interestingly, Ammirati et al. 33 reported previously that the T cell receptor zeta-chain, a master sensor and regulator of immune activity, was down-regulated on NK cells in patients with acute myocardial infarction.
Our data do not indicate that the expression of KIRs and CD94/NKG2a was affected during different stages of CAD, nor that it was related to CMV seropositivity. However, it should be emphasized that we analysed a limited panel of NK inhibitory receptors. The expression of inhibitory and activating receptors on NK cells in CAD still remains to be elucidated.
Both CD56bright cells and CD56dim cells were capable of producing IFN-γ and TNF. As expected, more cells within the CD56bright subset produced IFN-γ 4. However, other cytokines, including IL-10, IL-13 and IL-17A, were not detected under our assay conditions. The presence of NK2 cells (producing Th2 cytokines) and NK17/NK1 cells (producing IFN-γ and IL-17) have been described in multiple sclerosis and Behçet's disease 19,20. There are several reasons why these cytokine profiles were not detected in our study. One explanation comprises the differences in pathology, another the fact that we performed only short-term stimulations in order to keep the in-vivo phenotype as intact as possible.
To summarize, there was no evidence for alterations in either cytokine profile or distribution of NK cell subsets in acute or stable conditions of CAD. The proportions of major NK cell subsets were low in both non-STEMI and SA patients prior to coronary investigation but increased during a 12-month follow-up. However, failure to reconstitute NK cell levels seemed to be associated with persistent low-grade systemic inflammation, thus being in line with low NK cell levels as a negative marker in CAD. It remains to be clarified whether the NK cell deficit has clinical relevance in the atherosclerotic process or mainly represents an epiphenomenon.
Author contributions
K. B. performed the experiments. K. B., J. E. and L. J. designed and wrote the paper.
Acknowledgments
This study was supported by the Medical Research Council of Southeast Sweden. It was also funded by the Swedish Research Council, the Heart-Lung Foundation and the County of Östergötland.
Disclosures
The authors have no conflicts of interest to declare.
Supporting Information
Additional Supporting information may be found in the online version of this article at the publisher's website:
Fluorescence minus one (FMO) gating strategy.
Proportions of T cells, natural killer (NK) cells and subsets in patients and controls
Table S1. Monoclonal antibodies and in-vivo lymphocyte profiles.
Table S2. Whole blood stimulation and detection of intracellular cytokines.
References
- 1.Shereck E, Satwani P, Morris E, Cairo MS. Human natural killer cells in health and disease. Pediatr Blood Cancer. 2007;49:615–623. doi: 10.1002/pbc.21158. [DOI] [PubMed] [Google Scholar]
- 2.Yokoyama WM, Kim S, French AR. The dynamic life of natural killer cells. Annu Rev Immunol. 2004;22:405–429. doi: 10.1146/annurev.immunol.22.012703.104711. [DOI] [PubMed] [Google Scholar]
- 3.Cooper MA, Fehniger TA, Caligiuri MA. The biology of human natural killer-cell subsets. Trends Immunol. 2001;22:633–640. doi: 10.1016/s1471-4906(01)02060-9. [DOI] [PubMed] [Google Scholar]
- 4.Gayoso I, Sanchez-Correa B, Campos C, et al. Immunosenescence of human natural killer cells. J Innate Immun. 2011;3:337–343. doi: 10.1159/000328005. [DOI] [PubMed] [Google Scholar]
- 5.Lopez-Verges S, Milush JM, Pandey S, et al. CD57 defines a functionally distinct population of mature NK cells in the human CD56dimCD16+ NK-cell subset. Blood. 2010;116:3865–3874. doi: 10.1182/blood-2010-04-282301. [DOI] [PMC free article] [PubMed] [Google Scholar]
- 6.Radaev S, Sun PD. Structure and function of natural killer cell surface receptors. Annu Rev Biophys Biomol Struct. 2003;32:93–114. doi: 10.1146/annurev.biophys.32.110601.142347. [DOI] [PubMed] [Google Scholar]
- 7.Bjorkstrom NK, Riese P, Heuts F, et al. Expression patterns of NKG2A, KIR, and CD57 define a process of CD56dim NK-cell differentiation uncoupled from NK-cell education. Blood. 2010;116:3853–3864. doi: 10.1182/blood-2010-04-281675. [DOI] [PubMed] [Google Scholar]
- 8.Jonasson L, Backteman K, Ernerudh J. Loss of natural killer cell activity in patients with coronary artery disease. Atherosclerosis. 2005;183:316–321. doi: 10.1016/j.atherosclerosis.2005.03.011. [DOI] [PubMed] [Google Scholar]
- 9.Hak L, Mysliwska J, Wieckiewicz J, et al. NK cell compartment in patients with coronary heart disease. Immun Ageing. 2007;4:3. doi: 10.1186/1742-4933-4-3. [DOI] [PMC free article] [PubMed] [Google Scholar]
- 10.Hou N, Zhao D, Liu Y, et al. Increased expression of T cell immunoglobulin- and mucin domain-containing molecule-3 on natural killer cells in atherogenesis. Atherosclerosis. 2012;222:67–73. doi: 10.1016/j.atherosclerosis.2012.02.009. [DOI] [PubMed] [Google Scholar]
- 11.Backteman K, Andersson C, Dahlin LG, Ernerudh J, Jonasson L. Lymphocyte subpopulations in lymph nodes and peripheral blood: a comparison between patients with stable angina and acute coronary syndrome. PLOS ONE. 2012;7:e32691. doi: 10.1371/journal.pone.0032691. [DOI] [PMC free article] [PubMed] [Google Scholar]
- 12.Galkina E, Ley K. Immune and inflammatory mechanisms of atherosclerosis (*) Annu Rev Immunol. 2009;27:165–197. doi: 10.1146/annurev.immunol.021908.132620. [DOI] [PMC free article] [PubMed] [Google Scholar]
- 13.Perricone R, Perricone C, De Carolis C, Shoenfeld Y. NK cells in autoimmunity: a two-edged weapon of the immune system. Autoimmun Rev. 2008;7:384–390. doi: 10.1016/j.autrev.2008.03.002. [DOI] [PubMed] [Google Scholar]
- 14.Tobin AM, Lynch L, Kirby B, O'Farrelly C. Natural killer cells in psoriasis. J Innate Immun. 2011;3:403–410. doi: 10.1159/000328011. [DOI] [PubMed] [Google Scholar]
- 15.Zhang B, Yamamura T, Kondo T, Fujiwara M, Tabira T. Regulation of experimental autoimmune encephalomyelitis by natural killer (NK) cells. J Exp Med. 1997;186:1677–1687. doi: 10.1084/jem.186.10.1677. [DOI] [PMC free article] [PubMed] [Google Scholar]
- 16.Leavenworth JW, Wang X, Wenander CS, Spee P, Cantor H. Mobilization of natural killer cells inhibits development of collagen-induced arthritis. Proc Natl Acad Sci USA. 2011;108:14584–14589. doi: 10.1073/pnas.1112188108. [DOI] [PMC free article] [PubMed] [Google Scholar]
- 17.Flodstrom-Tullberg M, Bryceson YT, Shi FD, Hoglund P, Ljunggren HG. Natural killer cells in human autoimmunity. Curr Opin Immunol. 2009;21:634–640. doi: 10.1016/j.coi.2009.09.012. [DOI] [PubMed] [Google Scholar]
- 18.Lurati A, Bertani L, Marrazza M, Re KA, Bompane D, Scarpellini M. NK cell count as predictor of clinical response in patients with rheumatoid arthritis treated with rituximab. Biologics. 2012;6:83–87. doi: 10.2147/BTT.S29079. [DOI] [PMC free article] [PubMed] [Google Scholar]
- 19.Takahashi K, Miyake S, Kondo T, et al. Natural killer type 2 bias in remission of multiple sclerosis. J Clin Invest. 2001;107:R23–29. doi: 10.1172/JCI11819. [DOI] [PMC free article] [PubMed] [Google Scholar]
- 20.Yamaguchi Y, Takahashi H, Satoh T, et al. Natural killer cells control a T-helper 1 response in patients with Behcet's disease. Arthritis Res Ther. 2010;12:R80. doi: 10.1186/ar3005. [DOI] [PMC free article] [PubMed] [Google Scholar]
- 21.Pandya AD, Al-Jaderi Z, Hoglund RA, et al. Identification of human NK17/NK1 cells. PLOS ONE. 2011;6:e26780. doi: 10.1371/journal.pone.0026780. [DOI] [PMC free article] [PubMed] [Google Scholar]
- 22.Backteman K, Ernerudh J. Biological and methodological variation of lymphocyte subsets in blood of human adults. J Immunol Methods. 2007;322:20–27. doi: 10.1016/j.jim.2007.01.021. [DOI] [PubMed] [Google Scholar]
- 23.Varbo A, Benn M, Tybjaerg-Hansen A, Jorgensen AB, Frikke-Schmidt R, Nordestgaard BG. Remnant cholesterol as a causal risk factor for ischemic heart disease. J Am Coll Cardiol. 2013;61:427–436. doi: 10.1016/j.jacc.2012.08.1026. [DOI] [PubMed] [Google Scholar]
- 24.Satoh A, Adachi H, Tsuruta M, et al. High plasma level of remnant-like particle cholesterol in the metabolic syndrome. Diabetes Care. 2005;28:2514–2518. doi: 10.2337/diacare.28.10.2514. [DOI] [PubMed] [Google Scholar]
- 25.Lutz CT, Karapetyan A, Al-Attar A, et al. Human NK cells proliferate and die in vivo more rapidly than T cells in healthy young and elderly adults. J Immunol. 2011;186:4590–4598. doi: 10.4049/jimmunol.1002732. [DOI] [PMC free article] [PubMed] [Google Scholar]
- 26.Lutz CT, Quinn LS. Sarcopenia, obesity, and natural killer cell immune senescence in aging: altered cytokine levels as a common mechanism. Aging (Albany NY) 2012;4:535–546. doi: 10.18632/aging.100482. [DOI] [PMC free article] [PubMed] [Google Scholar]
- 27.Lynch LA, O'Connell JM, Kwasnik AK, Cawood TJ, O'Farrelly C, O'Shea DB. Are natural killer cells protecting the metabolically healthy obese patient? Obesity (Silver Spring) 2009;17:601–605. doi: 10.1038/oby.2008.565. [DOI] [PubMed] [Google Scholar]
- 28.Evans JH, Horowitz A, Mehrabi M, et al. A distinct subset of human NK cells expressing HLA-DR expand in response to IL-2 and can aid immune responses to BCG. Eur J Immunol. 2011;41:1924–1933. doi: 10.1002/eji.201041180. [DOI] [PMC free article] [PubMed] [Google Scholar]
- 29.Jost S, Quillay H, Reardon J, et al. Changes in cytokine levels and NK cell activation associated with influenza. PLOS ONE. 2011;6:e25060. doi: 10.1371/journal.pone.0025060. [DOI] [PMC free article] [PubMed] [Google Scholar]
- 30.Ammirati E, Cianflone D, Banfi M, et al. Circulating CD4+CD25hiCD127lo regulatory T-cell levels do not reflect the extent or severity of carotid and coronary atherosclerosis. Arterioscler Thromb Vasc Biol. 2010;30:1832–1841. doi: 10.1161/ATVBAHA.110.206813. [DOI] [PubMed] [Google Scholar]
- 31.Ammirati E, Cianflone D, Vecchio V, et al. Effector memory T cells are associated with atherosclerosis in humans and animal models. J Am Heart Assoc. 2012;1:27–41. doi: 10.1161/JAHA.111.000125. [DOI] [PMC free article] [PubMed] [Google Scholar]
- 32.Caligiuri G, Paulsson G, Nicoletti A, Maseri A, Hansson GK. Evidence for antigen-driven T-cell response in unstable angina. Circulation. 2000;102:1114–1119. doi: 10.1161/01.cir.102.10.1114. [DOI] [PubMed] [Google Scholar]
- 33.Ammirati E, Vermi AC, Cianflone D, et al. Expansion of T-cell receptor zeta dim effector T cells in acute coronary syndromes. Arterioscler Thromb Vasc Biol. 2008;28:2305–2311. doi: 10.1161/ATVBAHA.108.174144. [DOI] [PubMed] [Google Scholar]
Associated Data
This section collects any data citations, data availability statements, or supplementary materials included in this article.
Supplementary Materials
Fluorescence minus one (FMO) gating strategy.
Proportions of T cells, natural killer (NK) cells and subsets in patients and controls
Table S1. Monoclonal antibodies and in-vivo lymphocyte profiles.
Table S2. Whole blood stimulation and detection of intracellular cytokines.