

Abstract
This work tests the hypothesis that language skill depends on the ability to incorporate streams of sound into an accurate temporal framework. We tested the ability of young English-speaking adults to process single time intervals and rhythmic sequences of such intervals, hypothesized to be relevant to the analysis of the temporal structure of language. The data implicate a specific role for the ability to process beat-based temporal regularities in phonological language and literacy skill.
Keywords: Auditory timing, Beat, Language, Reading, Regularity, Rhythm
The role of the suprasegmental temporal structure of a language in speech production as well as perception has been a matter of debate for several decades (Dauer, 1983; Grabe & Low, 2002; Nolan & Asu, 2009; Rosen, 1992). Rhythmic cues have been shown to be relevant to both adult (Smith, Cutler, Butterfield, & Nimmo-Smith, 1989) and infant speech processing (Jusczyk et al., 1992). However, behavioral evidence for a link between the processing of temporal, i.e. rhythmic regularity and speech-and-language skills is surprisingly scarce. Previous work has tended to look at the processing of single sounds or pairs of those (Goswami et al., 2002; Moore, Ferguson, Edmondson-Jones, Ratib, & Riley, 2010; Tallal, 1980; Walker, Hall, Klein, & Phillips, 2006). A role for rhythm processing has been the focus of three recent investigations of children's language and literacy skills. Strait, Hornickel and Kraus (2011) demonstrated correlations between the detection of rhythmic changes in short musical excerpts and neuroelectric brainstem correlates of speech regularity processing across 42 “good and poor readers” aged 8 to 13. Consistent with this, Huss, Verney, Fosker, Mead, and Goswami (2011) found co-existing language impairments and deficits in metrical musical perception (rhythmic change detection) for sequences with varying degrees of musical meter. The authors report group-level deficits in dyslexic compared to control children, plus a significant correlation with phonological and literacy measures across groups (n = 64; age 8–13). They further present a regression analysis of metrical musical perception against basic auditory measures, highlighting the relevance of rise-time processing, i.e., of the sharpness of the “beat” within amplitude-modulated stimuli (see also Richardson, Thomson, Scott, & Goswami, 2004). Our recent study of a large cohort of 11-year-olds determined adaptively measured thresholds for detecting changes in the time structure in single-interval and rhythmic multiple-interval stimuli (Grube, Kumar, Cooper, Turton, & Griffiths, 2012). The data from the large subsample of 210 typically developing 11-year-olds showed a correlation with language and literacy skills for the processing of short, isochronous sequences but not for longer sequences with a roughly regular or metrical beat. This work assesses the relationship of phonological language and literacy skill and temporal regularity processsing of such longer, more complex sequences in young adults. Rhythmic-sequence analysis was tested for three types of temporal regularity: (1) a roughly regular beat, mimicking the quasi-regular structure of speech; (2) a “tempo contour” composed of a gradual change in tempo likely to occur also in speech; and (3) a metrical beat, representative of the hierarchical time structure typical for Western music, the temporal processing of which may rely on shared mechanisms with those underlying speech and language processing. A task of single, subsecond time-interval discrimination was performed as a non-rhythmic control task of perceptual timing. Across the four rhythm and timing tasks, the duration of the inter-onset intervals ranged from 180 to ∼580ms, corresponding to the time intervals between suprasegmental markers or stressed syllables in spoken speech (Grabe & Low, 2002; Rosen, 1992; Scott, 1982), as well as those perceived as a musical beat (Drake, Jones, & Baruch, 2000; London, 2004). The work is therefore a direct test of a hypothesized role for rhythmic-regularity processing in early adult language and literacy skills, and incorporates tests of the relevance of quasi-regular beats, gradual tempo contours, and metrical beat structure.
METHODS
Participants
The study was conducted in 28 undergraduate students (18 to 24 years, mean age 20.9; 10 males). The research was approved by the ethics committee of Newcastle University.
Auditory timing tasks
Testing was performed in a quiet room. Tasks were implemented in MATLAB 6.1. Stimuli were created at 44.1-kHz sampling rate (16-bit resolution), delivered via external soundcard (Edirol UA-4FX) and closed headphones (Sennheiser HD 265 linear) at approximately 80 dB rms sound pressure level. All stimuli were composed of 200-Hz pure tones (100ms, including 20ms ramps). Any task-specific roving applied to the stimuli was balanced and fixed across subjects.
Tasks were based on a two-alternative forced-choice paradigm. The order of stimuli was determined pseudo-randomly, and subjects indicated the perceived target position by corresponding number-key press. Target-to-reference differences were supra-threshold initially and adaptively controlled following a two-down-one-up algorithm (Levitt, 1971), using a larger step size before the fourth reversal and a smaller one thereafter. Thresholds were estimated as the mean of the last six reversals (70.9% correct). Inter-stimulus and inter-trial intervals were 1500ms. Total duration for all four tasks was ∼45 minutes.
The single-interval task (50 trials; Grube, Cooper, Chinnery, & Griffiths, 2010) required subjects to indicate which of two time intervals marked by pairs of tones was longer. The reference inter-onset-interval ranged from 300 to 600ms. The silent interval within the target was longer by 90% of the reference's initially, and adaptively changed in steps of 12% and 6%.
The regularity task (see Figure 1b; 40 trials; Grube et al., 2010) required subjects to indicate which of two 11-tone sequences was more regular. Sequences were based on an underlying regular beat of 400-ms inter-onset-interval. The reference had an average irregularity of ±30%, due to shortening or lengthening of individual intervals by 15 to 45% each, rendering the beat imperceptible (Madison & Merker, 2002). The target had 0% irregularity initially, adaptively adjusted in steps of 4% and 2.5%.
Figure 1.
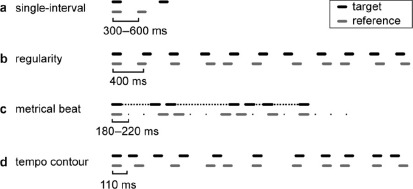
Schematic depiction of auditory timing tasks. (a) single time-interval duration discrimination, using pairs of tones and a reference inter-onset-interval of 300 to 600 ms; (b) regularity detection, using sequences of 11 tones and an underlying beat of 400 ms inter-onset-interval; (c) metrical pattern discrimination, using a reference sequence with a metrical beat of four and an underlying beat of 180 to 220 ms; (d) tempo contour detection, using sequences of 11 tones with a succession inter-onset-intervals controlled by an algorithm for scaling noise. Depicted are one reference and one target examplar each with their relevant features. Horizontal lines: Tones (200 Hz; 100 ms).
The metrical pattern task (see Figure 1c; 40 trials; Grube et al., 2010) required subjects to indicate which of three rhythmic sequences was “different”. The reference had a metrical beat of four induced by the temporal spacing of seven tones (for more details see Grube & Griffiths, 2009). There was an extra reference presented first to minimize uncertainty. The target (second or third) had a change in timing such that the long intervals were not multiples of the underlying beat (180 to 220ms). The change in long intervals (lengthening or shortening; balanced across the sequence) was 65% initially, adaptively adjusted in steps of 12% and 6%.
The tempo-contour detection task (see Figure 1d; 40 trials) required subjects to identify the target with a more gradual change in tempo compared to a reference with randomly changing tempo (see Figure 1d). The tempo contours were created using an algorithm for scaling noise (1/fn) to compose sequences of varying inter-onset-interval duration; the same algorithm we previously used in the creation of pitch sequences with varying degree of melodic contour, with n = 0 creating a random sequence, and increasingly higher values creating increasingly more ordered contours (Overath et al., 2007). The reference n = 0, the target an initial value of 2.1, adaptively adjusted in steps of 0.3 and 0.1.
Tests of language, literacy, and intellectual skill
Five phonological language and literacy tests were used, which were all standardized tests with the exception of (4): (1) irregular word reading, i.e., words with atypical grapheme to phoneme translations, combining the NART (Nelson & Willison, 1991), WRAT (Wilkinson, 1993), and WTAR (Wechsler, 2001) (118 items in total); (2) non-word reading based on Olson, Forsberg, & Wise (1994), as used by Foxton et al. (2003) but extended to contain 120 items (30 each with two, three, or four syllables in randomized order); (3) word/non-word reading from the PALPA (Kay, Coltheart, & Lesser, 1992; 160 items); (4) reading of a difficult English poem containing ∼800 examples of irregular spelling and pronunciation, in misleading order (“The Chaos,” Gerard Nolst Trenité); (5) digit span (WAIS, 32 items). The reading tasks were scored as the number of errors (incorrect items); digit-span was scored as the number of correct items. Non-verbal intellectual skill was measured using a shortened version of Raven's Advanced Progressive Matrices (Raven, Court, & Raven, 1988), scored as the number of items correct (18 items; 20 min).
Statistical data analysis
Correlation analysis used Spearman's rho, due to significant deviations from normal distribution (see Table 1; Kolmogorov-Smirnoff Test). The one-tailed version was used based on expecting a positive correlation between better performance on language and auditory tasks, with a significance limit of p < .05 and Bonferroni-correction for n = 4, i.e., the number of correlations carried out for each language-based measure. A Principal Component Analyses (PCA) was carried out on the five language-based measures, to extract an underlying principle mechanism and test for correlation with auditory skill. PCA decomposes the data matrix X of size (N × m), with N being the number of observations (subjects) and m the number of variables (measures):
TABLE 1.
Descriptive statistics for the four auditory timing tasks: Single-interval timing, Metrical pattern discrimination; Tempo contour detection; and the five phonological tasks: Irregular word reading, Word/non-word reading, Non-word reading, Poem reading, Digit span. We report median values and mean absolute deviation (MAD), minimum and maximum, due to a number of deviations from normal distributions, marked by an asterisk next to the median* (Lilliefors Kolmogorov-Smirnoff test, p < .05). 1Note that regularity detection, digit span and Raven's scores are the only measures featuring larger values corresponding to better performance; all others feature smaller values for better performance (auditory: Thresholds; phonological and literacy: Number or incorrect items)
| Median | MAD | Min. | Max. | |
|---|---|---|---|---|
| Single time-interval (thr. in %) | 14.0 | 7.9. | 4.0 | 60.0 |
| Sequence regularity (thr. in %)1 | 20.25 | 2.9 | 26.6 | 14.7 |
| Metrical beat (thr. in %) | 15.5 | 5.8 | 4.0 | 47.0 |
| Tempo contour (thr. in n) | .92* | .26 | .6 | 1.9 |
| Irregular word reading (incorrect) | 35.0* | 9.0 | 17.0 | 49.0 |
| Word/non-word reading (incorrect) | 5.0* | 3.3 | 1.0 | 20.0 |
| Non-word reading (incorrect) | 14.5* | 9.1 | 4.0 | 61.0 |
| Poem reading (incorrect) | 21.5 | 6.6 | 7.0 | 38.0 |
| Digit span (correct)1 | 19.5 | 2.6 | 12.0 | 26.0 |
| Raven's short version (correct)1 | 10.5 | 9.5 | 7.0 | 16.0 |
where T is the scores matrix of size (N × d) with d (≤ m) being the number of components retained in the PCA model, P the loading matrix (size m × d) and E an error matrix.
RESULTS
Correlations were analyzed between auditory timing measures and both the raw language and literacy scores and a composite measure: The first principal component of phonological skill (P-PC1). P-PCI explained 65% of the variance with equal loadings across all five tests.
In support of our hypothesis, two of the three measures of rhythmic sequence processing were significantly correlated with phonological language and literacy skills (see Table 2). Regularity detection and metrical pattern processing correlated most consistently with the test-specific language-based measures and the P-PC1. Regularity detection correlated significantly with irregular word and non-word reading before and after Bonferroni correction, with poem reading and digit span before but not after Bonferroni correction, and borderline signficantly with word/non-word reading. Metrical pattern discrimination correlated significantly with the reading of the difficult poem before and after Bonferroni correction, and with irregular-word and non-word reading before but not after. In contrast, no single significant correlation was found between the contour detection task and the language-related measures. Single-interval timing correlated significantly only with irregular word and the difficult poem reading and P-PC1, but only before Bonferroni correction. The average rho values across the five measures of phonological language and literacy skill were: .4 for metrical pattern discrimination; .39 for regularity detection; .03; .22 for single-interval timing; .03 for tempo contour detection.
TABLE 2.
Correlations between auditory timing and phonological language and literacy measures. Listed are Spearman's rho correlation coefficients and corresponding p values (rho/p, 1-tailed) for task-specific measures and the first principle phonological component (P-PC1) before and after partialling out non-verbal intelligence (first and second row within each cell). Significance level was p < .05; marked in bold are those that survive Bonferroni-correction, in brackets those that were not significant, grayed out those that had a correlation coefficient < .22, i.e., explaining less than 5% of variance, and/or a p value > .2. 1Note that sign of scores was reversed for regularity detection and digit span (see Table 1), so that smaller (more negative) values represented better performance for all variables and that positive correlation coefficients would throughout denote correlations in the hypothesized direction
| Irregular word reading | Word/non-word reading | Non-word reading | Poem reading | Digit span1 | P-PC1 | |
|---|---|---|---|---|---|---|
| Single time interval | .35 / .033 | (.23 / .119) | (.01 / .483) | .34 / .040 | (.16 / .203) | .31 / .053 |
| Sequence regularity1 | .45 / .008 | (.30 / .059) | .43 / .011 | .40 / .017 | .36 / .031 | .51 / .003 |
| Metrical beat | .42 / .013 | (.30 / .064) | .38 / .025 | .59 / .000 | (.29 / .066) | .56 / .001 |
| Tempo contour | (.10 / .306) | (.05 / .410) | (−.07 / .633) | (.19 / .169) | (−.13 / .742) | (.08 / .339) |
In order to test for a possible confounding effect of non-verbal intellectual skill, we assessed univariate, one-tailed correlations with the Raven's score. Of the four auditory timing measures, regularity and contour detection showed a trend of a positive correlation (regularity: rho = .24, p = .103; tempo contour: rho = .35, p = .036), whilst the single-interval and metrical timing did not (single time-interval: rho = −.14, p = .766; metrical pattern: rho = −.04, p = .586). The language-based measures showed no positive correlation with the Raven's score, but negative trends instead (irregular words: rho = −.18, p = .824; words/non-words: rho = −.17, p = .917; non-words: rho = −.31, p = .948; difficult poem: rho = .02, p = .459; digit span: rho = −.21, p = .856). Partial correlations between the auditory and language-related measures of phonological language and literacy skill had no discernible effect compared to the orginal outcomes presented in Table 2, except a general increase in correlations for the detection of regularity. Average correlation coefficients after partialling out non-verbal intellectual skill were: .45 for regularity detection; .38 for metrical pattern discrimination; .20 for single-interval timing; .09 for tempo contour detection. The partial, task-specific correlation coefficients for regularity detection were: Irregular word reading, rho = .52 (p = .003, surviving Bonferroni correction); word/non-word reading, rho = .36 (p = .031); non-word reading, rho = .55 (p = .002, surviving Bonferroni correction); poem reading, rho = .41 (p = .017); digit span, rho = .43 (p = .012, surviving Bonferroni correction).
The correlation between regularity detection and P-PC1 explained 26% of the variance before, and 36% after partialling out non-verbal intellectual skill. The correlation between metrical pattern discrimination and P-PC1 explained 31% of the variance, with no change due to partialling out non-verbal intellectual skill.
GENERAL DISCUSSION
The data show a significant relationship between phonological language and literacy skill and both the auditory cognitive ability to analyze temporal, beat-based regularity and metrical patterns in young adults. The data suggests a role for of the analysis of event structure over time in speech and language processing, at the hundreds-of-milliseconds level over a few seconds at a time. The findings support the existence of a shared mechanism of beat-based regularity processing supporting rhythm perception as well as speech and language skills: The use of temporal regularities as a “scaffolding” to structure input and output in time. The strongest correlation was observed between the metrical beat and the poem, a special instance of the “feeling of the (musical) beat” leading us to synchronize our movements with it. The causality of the synergistic effects between auditory, language, and musical skills remains to be further explored (c.f. Strait et al., 2011; Strait, O'Connell, Parbery-Clark, & Kraus, 2013). The lack of correlation for the analysis of a gradually changing tempo contour, despite comparable range of inter-onset-interval durations, sequence length, and complexity and their relevance to music (Levitin, Chordia, & Menon, 2012), supports the interpretation that the ability to analyze specifically those temporal structures with a regular, or quasi-regular beat is relevant to speech and language skills. This finding is consistent with recent models of oscillatory brain reflecting the suprasegmental analysis of speech engaged by its quasi-rhythmic structure (Abrams, Nicol, Zecker, & Kraus, 2009; Giraud & Poeppel, 2012; Luo & Poeppel, 2007; Morillon et al., 2010). Activity at frequencies in the theta range (3–8Hz), is assumed as the “master” oscillation processing the equivalent modulation frequencies, the most prominent energy fluctuations in speech corresponding to the syllable level (Ghitza, 2013; Ghitza, Giraud, & Poeppel, 2012), whilst delta oscillations (1–3Hz) would relate to the next higher level, i.e., that of stress timing. Our beat-based regularity and metrical tasks tap directly into the generic, underlying mechanisms of temporal regularity processing at these frequencies, likely achieved by one common subsystem of beat-based timing (Grube et al., 2010; Teki, Grube, & Griffiths, 2012).
The present data demonstrate a clear correlation between the processing of beat-based temporal regularities in generic, pre-phonemic auditory stimuli and language skill in early adulthood, whilst no corresponding correlations were found in our work in a large cohort of 11-year-olds (Grube et al., 2012). The data available support a link between higher levels of rhythmic complexity and language skill emerging in early adulthood, warranting further testing of the causality of this link.
REFERENCES
- Abrams D. A., Nicol T., Zecker S., Kraus N. Abnormal cortical processing of the syllable rate of speech in poor readers. The Journal of Neuroscience. 2009;29:7686–7693. doi: 10.1523/JNEUROSCI.5242-08.2009. [DOI] [PMC free article] [PubMed] [Google Scholar]
- Dauer R. M. Stress-timing and syllable-timing reanalyzed. Journal of Phonetics. 1983;11(1):51–62. [Google Scholar]
- Drake C., Jones M. R., Baruch C. The development of rhythmic attending in auditory sequences: Attunement, referent period, focal attending. Cognition. 2000;77:251–288. doi: 10.1016/s0010-0277(00)00106-2. [DOI] [PubMed] [Google Scholar]
- Foxton J. M., Talcott J. B., Witton C., Brace H., McIntyre F., Griffiths T. D. Reading skills are related to global, but not local, acoustic pattern perception. Nature Neuroscience. 2003;6:343–344. doi: 10.1038/nn1035. [DOI] [PubMed] [Google Scholar]
- Ghitza O. The theta-syllable: A unit of speech information defined by cortical function. Frontiers in Psychology. 2013;4:138. doi: 10.3389/fpsyg.2013.00138. [DOI] [PMC free article] [PubMed] [Google Scholar]
- Ghitza O., Giraud A. L., Poeppel D. Neuronal oscillations and speech perception: Critical-band temporal envelopes are the essence. Frontiers in Human Neuroscience. 2012;6:340. doi: 10.3389/fnhum.2012.00340. [DOI] [PMC free article] [PubMed] [Google Scholar]
- Giraud A. L., Poeppel D. Cortical oscillations and speech processing: Emerging computational principles and operations. Nature Neuroscience. 2012;15(4):511–517. doi: 10.1038/nn.3063. [DOI] [PMC free article] [PubMed] [Google Scholar]
- Goswami U., Thomson J., Richardson U., Stainthorp R., Hughes D., Rosen S., Scott S. K. Amplitude envelope onsets and developmental dyslexia: A new hypothesis. Proceedings of the National Academy of Sciences USA. 2002;99:10911–10916. doi: 10.1073/pnas.122368599. [DOI] [PMC free article] [PubMed] [Google Scholar]
- Grabe E., Low E. L. Durational variability in speech and the rhythm class hypothesis. In: Gussenhoven C., Warner N., editors. Papers in laboratory phonology. Vol. 7. Berlin, New York: Mouton de Gruyter; 2002. [Google Scholar]
- Grube M., Cooper F. E., Chinnery P. F., Griffiths T. D. Dissociation of duration-based and beat-based auditory timing in cerebellar degeneration. Proceedings of the National Academy of Science USA. 2010;107:11597–11601. doi: 10.1073/pnas.0910473107. [DOI] [PMC free article] [PubMed] [Google Scholar]
- Grube M., Griffiths T. D. Metricality-enhanced temporal encoding and the subjective perception of rhythmic sequences. Cortex. 2009;45:72–79. doi: 10.1016/j.cortex.2008.01.006. [DOI] [PubMed] [Google Scholar]
- Grube M., Kumar S., Cooper F. E., Turton S., Griffiths T. D. Auditory sequence analysis and phonological skill. Proceedings of the Royal Society Biological Sciences. 2012;279:4496–4504. doi: 10.1098/rspb.2012.1817. [DOI] [PMC free article] [PubMed] [Google Scholar]
- Huss M., Verney J. P., Fosker T., Mead N., Goswami U. Music, rhythm, rise time perception and developmental dyslexia: Perception of musical meter predicts reading and phonology. Cortex. 2011;47:674–689. doi: 10.1016/j.cortex.2010.07.010. [DOI] [PubMed] [Google Scholar]
- Jusczyk P. W., Hirsh-Pasek K., Nelson D. G., Kennedy L. J., Woodward A., Piwoz J. Perception of acoustic correlates of major phrasal units by young infants. Cognitive Psychology. 1992;24:252–293. doi: 10.1016/0010-0285(92)90009-q. [DOI] [PubMed] [Google Scholar]
- Kay J., Coltheart M., Lesser R. PALPA: Psycholinguistic assessments of language processing in aphasia. Hove, UK: Psychology Press; 1992. [Google Scholar]
- Levitin D. J., Chordia P., Menon V. Musical rhythm spectra from Bach to Joplin obey a 1/f power law. Proceeding of the National Academy of Sciences USA. 2012;109:3716–3720. doi: 10.1073/pnas.1113828109. [DOI] [PMC free article] [PubMed] [Google Scholar]
- Levitt H. Transformed up-down methods in psychoacoustics. Journal of Acoustic Society of America. 1971;49:467–477. [PubMed] [Google Scholar]
- London J. Hearing in time. New York, NY: Oxford University Press. 2004.
- Luo H., Poeppel D. Phase patterns of neuronal responses reliably discriminate speech in human auditory cortex. Neuron. 2007;54:1001–1010. doi: 10.1016/j.neuron.2007.06.004. [DOI] [PMC free article] [PubMed] [Google Scholar]
- Madison G., Merker B. On the limits of anisochrony in pulse attribution. Psychological Research. 2002;66(3):201–207. doi: 10.1007/s00426-001-0085-y. [DOI] [PubMed] [Google Scholar]
- MatLab (6.1) [Computer software] http://www.mathworks.com/products/matlab/?s_tid=hp_fp_ml.
- Moore D. R., Ferguson M. A., Edmondson-Jones A. M., Ratib S., Riley A. Nature of auditory processing disorder in children. Pediatrics. 2010;126:e382–390. doi: 10.1542/peds.2009-2826. [DOI] [PubMed] [Google Scholar]
- Morillon B., Lehongre K., Frackowiak R. S., Ducorps A., Kleinschmidt A., Poeppel D., Giraud A. L. Neurophysiological origin of human brain asymmetry for speech and language. Proceedings of the National Academy of Science USA. 2010;107:18688–18693. doi: 10.1073/pnas.1007189107. [DOI] [PMC free article] [PubMed] [Google Scholar]
- Nelson H. E., Willison J. R. National adult reading test manual. 2nd ed. Windsor: NFER-Nelson; 1991. [Google Scholar]
- Nolan F., Asu E. L. The pairwise variability index and coexisting rhythms in language. Phonetica. 2009;66(1–2):64–77. doi: 10.1159/000208931. [DOI] [PubMed] [Google Scholar]
- Olson R., Forsberg H., Wise B. Measurement of word recognition, orthographic, and phonological skills. In: Reid Lyon G., editor. Frames of reference for the assessment of learning disabilities: New views on measurement issues. Baltimore, MA: Paul H. Brookes; 1994. pp. 243–277. [Google Scholar]
- Overath T., Cusack R., Kumar S., von Kriegstein K., Warren J. D., Grube M., Carlyon R. P., Griffiths T. D. An information theoretic characterisation of auditory encoding. PLoS Biology. 2007;5:e288. doi: 10.1371/journal.pbio.0050288. [DOI] [PMC free article] [PubMed] [Google Scholar]
- Raven J. C., Court J. H., Raven J. Raven's progressive matrices and vocabulary scales. London: H. K. Lewis & co; 1988. [Google Scholar]
- Richardson U., Thomson J. M., Scott S. K., Goswami U. Auditory processing skills and phonological representation in dyslexic children. Dyslexia. 2004;10:215–233. doi: 10.1002/dys.276. [DOI] [PubMed] [Google Scholar]
- Rosen S. Temporal information in speech: Acoustic, auditory and linguistic aspects. Philosophical Transactions of the Royal Society Lond. B Biological Sciences. 1992;336:367–373. doi: 10.1098/rstb.1992.0070. [DOI] [PubMed] [Google Scholar]
- Scott D. R. Duration as a cue to the perception of a phrase boundary. Journal of the Acoustical Society of America. 1982;71:996–1007. doi: 10.1121/1.387581. [DOI] [PubMed] [Google Scholar]
- Smith M. R., Cutler A., Butterfield S., Nimmo-Smith I. The perception of rhythm and word boundaries in noise-masked speech. Journal of Speech and Hearing Research. 1989;32:912–920. doi: 10.1044/jshr.3204.912. [DOI] [PubMed] [Google Scholar]
- Strait D. L., Hornickel J., Kraus N. Subcortical processing of speech regularities underlies reading and music aptitude in children. Behavioral and Brain Functions. 2011;7(1):44. doi: 10.1186/1744-9081-7-44. [DOI] [PMC free article] [PubMed] [Google Scholar]
- Strait D. L., O'Connell S., Parbery-Clark A., Kraus N. Musicians’ enhanced neural differentiation of speech sounds arises early in life: Developmental evidence from ages 3 to 30. Cerebral Cortex. 2013. doi 10.1093/cercor/bht103. [DOI] [PMC free article] [PubMed]
- Tallal P. Auditory temporal perception, phonics, and reading disabilities in children. Brain and Language. 1980;9:182–198. doi: 10.1016/0093-934x(80)90139-x. [DOI] [PubMed] [Google Scholar]
- Teki S., Grube M., Griffiths T. D. A unified model of time perception accounts for duration-based and beat-based timing mechanisms. Frontiers in Integrative Neuroscience. 2012;5:90. doi: 10.3389/fnint.2011.00090. [DOI] [PMC free article] [PubMed] [Google Scholar]
- Walker K. M., Hall S. E., Klein R. M., Phillips D. P. Development of perceptual correlates of reading performance. Brain Research. 2006;1124(1):126–141. doi: 10.1016/j.brainres.2006.09.080. [DOI] [PubMed] [Google Scholar]
- Wechsler D. Wechsler test of adult reading: WTAR: The Psychological Corporation; 2001. [Google Scholar]
- Wilkinson G. S. Wide range achievement test: WRAT-3: The Psychological Corporation; 1993. [Google Scholar]