Abstract
We have developed a method that employs nanocapsules, optical trapping, and single-pulse laser photolysis for delivering bioactive molecules to cells with both high spatial and temporal resolutions. This method is particularly suitable for a cell-culture setting, in which a single nanocapsule can be optically trapped and positioned at a pre-defined location next to the cell, followed by single-pulse laser photolysis to release the contents of the nanocapsule onto the cell. To parallelize this method such that a large array of nanocapsules can be manipulated, positioned, and photolyzed simultaneously, we have turned to the use of spatial light modulators and holographic beam shaping techniques. This paper outlines the progress we have made so far and details the issues we had to address in order to achieve efficient parallel optical manipulations of nanocapsules and particles.
Keywords: Nanocapsules, optical trapping, optical tweezers, spatial light modulators, holographic techniques
1. INTRODUCTION: SINGLE-SITE DELIVERY OF BIOLOGICAL STIMULI USING NANOCAPSULES AND OPTICAL MANIPULATIONS
The biological cell is a highly heterogeneous structure and consists of interacting signaling networks that are tightly organized and controlled over space and time. Our group has been interested in developing techniques that are capable of probing the structure of biological signaling networks with high spatial and temporal resolution. Towards this end, we have developed a method that employs nanocapsules as physical cages to entrap bioactive molecules within the capsules until the capsules are burst open using a single nanosecond laser pulse1–8. Our strategy for using nanocapsules in an in vitro cell culture setting is shown in figure 1. Here, a single nanocapsule is optically trapped then placed at the desired position with respect to a cell. Once positioned, a single nanosecond laser pulse is applied to photolyze the nanocapsule so as to release the contents of the nanocapsule onto the cell.
Figure 1.
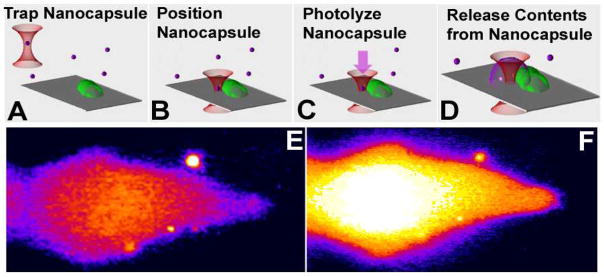
(A–D) Schematic showing the optical trapping of a single nanocapsule (A), positioning of the nanocapsule next to a biological cell (B), application of a single UV laser pulse to photolyze the capsule (C), which then causes the release of the contents of the nanocapsule onto the cell (D). (E, F) Experimental images showing a fluo3-loaded CHO-M1 cell before (E) and after (F) release of carbachol from the nanocapsule (upper right circle) onto the cell. Calcium response is clearly visible in the CHO-M1 cell in response to activation by carbachol from the nanocapsule1,2.
We have demonstrated that this method can release the contents of a nanocapsule onto cells with sub-micron spatial resolution and sub-microsecond temporal resolution1–8. We have also delivered a wide range of bioactive stimuli to cells, including small molecules and large protein biomolecules. We have designed and formed nanocapsules using various approaches, such as self assembly and colloidal templating, and with different materials, including lipid bilayers, silica, and polymers2–5. However, so far, we have been only able to trap, position, and photolyze one nanocapsule at a time. Below, we describe our progress towards parallelization of this technique by exploiting advances in spatial light modulators and holographic beam shaping techniques, such that an array of nanocapsules can be positioned around the cell in parallel for subsequent timed delivery of their contents to the cell. This capability is particularly relevant for applications that require the delivery of multiple stimuli to cells for probing the interactions between signaling pathways.
2. CALIBRATION AND OPTIMIZATION OF SLM
Spatial light modulators (SLMs) have matured over the past years and are rapidly becoming the device of choice for implementing parallel optical trapping. There are, however, a number of technical issues in using SLMs that must be addressed in order to achieve efficient parallel optical manipulations. One issue is that SLMs have a wavelength sensitive refractive index leading to wavelength sensitive retardation properties. In addition, the liquid crystal inside the device has a non-linear response of phase retardation against the applied voltage signal. These two problems result in large decreases in diffraction efficiency, uniformity, and pattern fidelity of the light distributions formed at the object plane.
For these two reasons the system must be optimized for a single wavelength. The device is directly addressed by the red channel of the RGB signal from a graphics card that is then converted to a voltage signal by the driving unit. It is this gray-level-to-voltage conversion that must be linearized and set to a maximum of 2π for the particular wavelength light to be used with the device. Once known, the correct conversion between gray level and phase retardation can be loaded onto the non-volatile EEPROM on the SLM driver as a Look Up Table (LUT).
2.1 Method to measure gray-level-to-phase conversion curve
The addressability of the SLM allows a simple interferometer to be set up without using any mechanical moving parts. Adapting the method of Kohler et al.9, we constructed an interferometer and introduced phase retardation between the two beams by varying the gray level addressed on the SLM. Varying the phase retardation on one half of the SLM in uniform increments as the other half is kept constant displaces the interference fringe pattern at the focus of the lens laterally by a fraction of the full 2π range.
Initially, we placed a linear LUT on the EEPROM and varied the gray level from 0 to 255 on one half of the SLM. Extracting a single line from the same location in each resulting interference pattern, and stacking them vertically gives figure 2. The horizontal axis describes the fringe position and the vertical describes the gray level.
Figure 2.
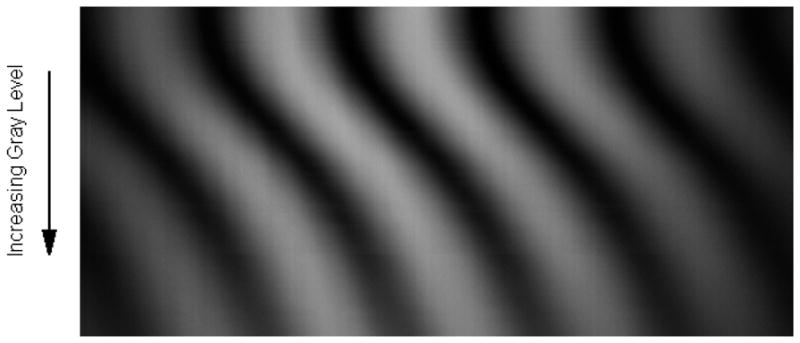
Movement of interference fringes as a function of gray level applied to one half of the SLM. Each horizontal line, one pixel high, represents a data point for one set of fringes for a given gray level.
We wrote a LabVIEW program to fit the fringe intensity as a function of pixel coordinate for each line in the image, which should be given by
From these fits, we extracted the phase retardation as a function of the applied gray value (figure 3).
Figure 3.
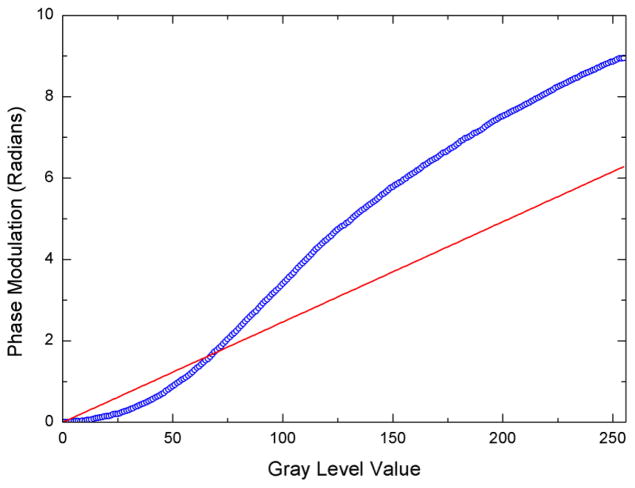
Blue circles: Phase modulation achieved as a function of gray level addressed to the SLM via the red channel of the external monitor. Red solid line: Ideal phase modulation desired is linear and reaches a maximum of 2π.
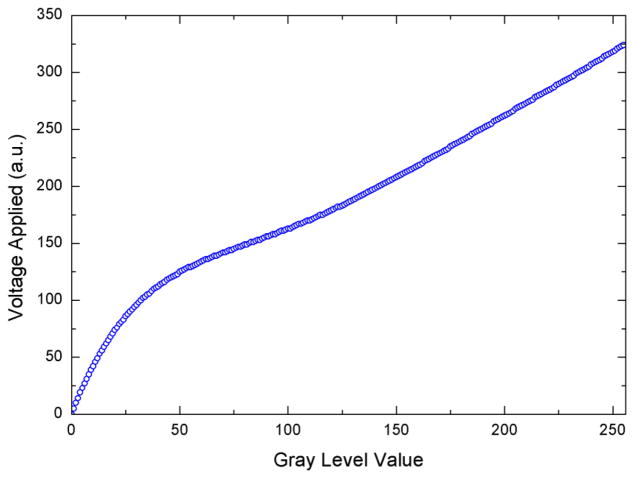
Figure 3 shows how the phase retardation varies as a function of gray level when the linear LUT on the EEPROM assumes a linear conversion between the gray level addressed and the voltage applied. The experimental data should ideally lie on the red line rather than being non-linear and overshooting the maximum value of 2π required. To shift the data points, we created a correction LUT table that is the inverse of this function to obtain the correction LUT, converting gray level to voltage (shown in figure 4).
Figure 4.
Correction look up table (LUT) converting gray level to voltage, which is to be loaded onto SLM driver EEPROM to linearize and shift down the gray-level-to-phase modulation curve.
To test whether this LUT corrects for the non-linearity and the overshoot of phase modulation that we obtained without correction, we loaded the correction LUT onto the driving unit EEPROM and re-ran the initial experiment. The shifting fringes of figure 2 now look as shown in figure 5.
Figure 5.
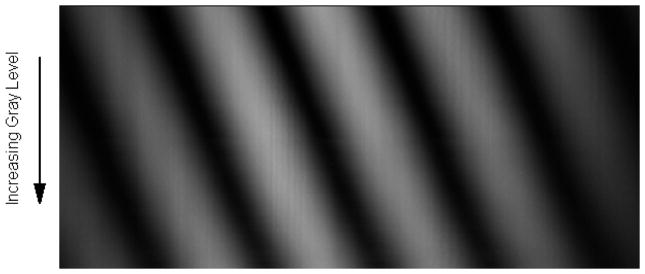
Movement of interference fringes, with correction LUT applied to EEPROM, as a function of gray level applied to one half of the SLM. Each horizontal line, one pixel high, represents a data point for one set of fringes for a given gray level.
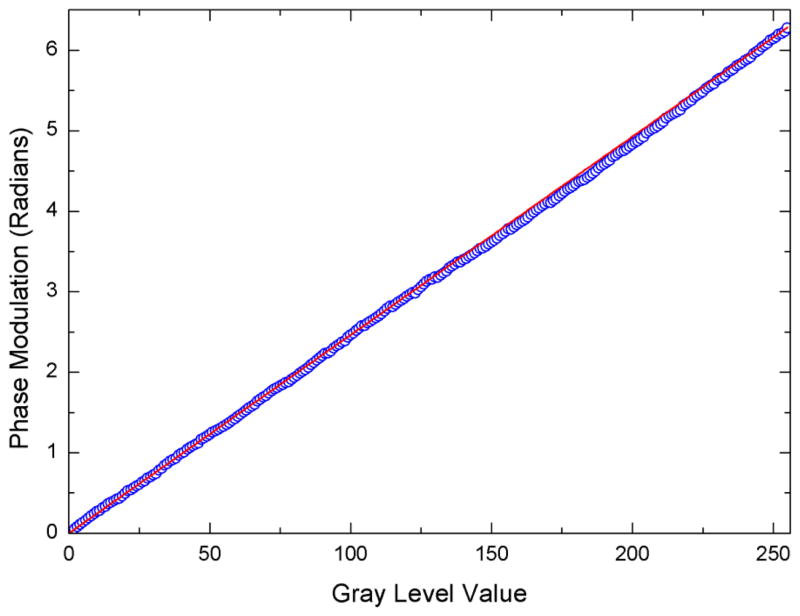
By again fitting the fringes in figure 5 as a function of pixel coordinate, figure 6 is obtained, which plots the corrected phase retardation as a function of the applied gray level. Figure 6 indicates the phase modulation now has a linear response and obtains the maximum value of 2π as required. It should be noted that the camera exposure time must be set to the refresh rate of the SLM in order to remove any peculiar oscillations in the fringe pattern and retain a clear image. Here it was set to 16.67 ms.
Figure 6.
Blue circles: Phase modulation achieved, with correction LUT applied to EEPROM, as a function of gray level addressed to the SLM via the red channel of the external monitor. Red solid line: Ideal phase modulation desired is linear and reaches a maximum of 2π.
2.2 Method to determine aberration on SLM and to calculate correction kinoform
Unfortunately liquid crystal over silicon (LCoS) SLMs can have very non-flat back planes and impart this to incident beams as an additional phase distribution or aberration. Further aberrations can be induced by mis-alignment in the optical train, such as off-axis lenses and tilted mirrors. When transmitted by a lens, the focus is no longer diffraction limited and so is detrimental to the quality of the intensity pattern.
Using the orthogonal set of polynomials developed by Zernike10,11, which describes an infinite number of aberration modes, any aberration can be described and encoded into the kinoforms (phase-only holograms) that create the desired intensity patterns. By determining the aberration inverse to the non-flatness of the device and optical train, Zernike polynomials can be encoded to cancel any aberrations that are occurring.
To determine the correction that needs to be applied, we adopted a direct search approach. A ‘test’ kinoform that creates a single focus at the location of the eventual intensity pattern is calculated. This kinoform is then encoded with a specific correction and an image is taken of the resulting focus. From this image, a measure of the quality of the focused diffracted beam is found through the metric M12,
where Iij is the intensity of the ijth pixel and a minimum in Ms represents the most Gaussian beam. In practice, the direct search is performed through magnitudes of −2λ to 2λ in uniform increments for the first 11 Zernike modes of aberration. The calculated kinoforms are displayed in sequence together with taking an image of the focus.
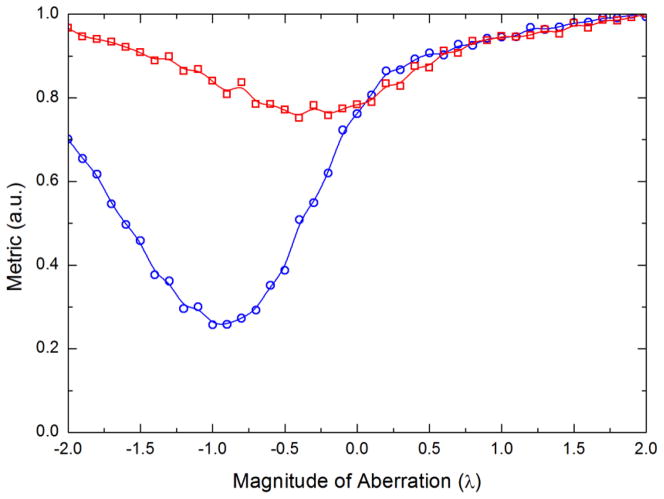
The metric as a function of the magnitude of aberration for modes 4 and 5 is plotted in figure 7. Modes 0 through 3 are trivial and 6 through 10 are high order modes whose improvement metric does not show a significant minimum until the lower order modes have been corrected.
Figure 7.
Variation of the Gaussian quality metric as a function of the magnitude of aberration for Zernike modes 4 (blue circles) and 5 (red squares). The minimum in the curves indicate the magnitude of the correction that needs to be applied for that mode.
The minimum in the metric for both modes indicates the magnitude of each polynomial that needs to be included in the correction. Knowing these two mode corrections allows an associated kinoform to be created for each. In order to combine these two kinoforms into a single correction kinoform they are simply summed modulo 2π.
This first approximation to a correction kinoform is now summed modulo 2π with the original ‘test’ hologram. The same direct search approach is repeated with this new kinoform to observe if the focus has indeed been improved and also to look more closely at the higher order modes. With this run of the experiment, we obtain figure 8, which shows the focus has been improved for modes 4, 5 and 6 although the higher order modes still need to be corrected. Again the magnitude of aberration for the higher modes is simply read off and used with the Zernike polynomials to calculate correction kinoforms for each mode.
Figure 8.
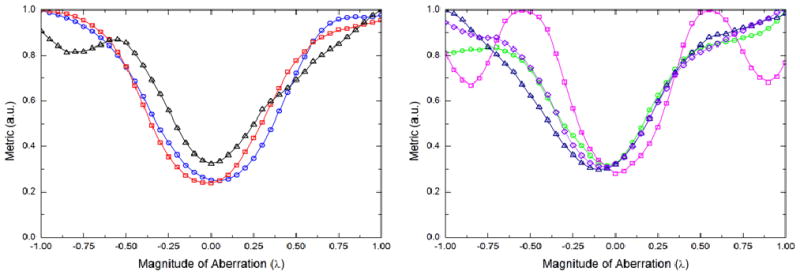
Variation of Gaussian quality metric as a function of the magnitude of aberration for Zernike modes 4 through 10. Here the test kinoform has been initially corrected with Z4 = −0.65 and Z5 = −0.65. Left panel: Modes 4 (blue circles), 5 (red squares), and 6 (black triangles). Right panel: Modes 7 (green circles), 8 (pink squares), 9 (dark blue triangles), and 10 (purple diamonds). The minimum in the curves indicate the magnitude of the correction that needs to be applied for that mode.
Using the procedure outlined above in an iterative process, we obtained the ideal magnitude of the Zernike correction polynomials. Table 1 is shows the magnitude of the first 11 Zernike polynomials describing the aberration corrections that need to be applied to this particular SLM.
Table 1.
Magnitude of the first 11 Zernike polynomials describing the corrections to the aberrations of the SLM.
| Mode | Name | Magnitude of aberration (λ) |
|---|---|---|
|
| ||
| 0 | Piston | Trivial – Equivalent to translating mirror axially |
| 1 | Tip | Trivial – Equivalent to tipping mirror in conjugate plane |
| 2 | Tilt | Trivial – Equivalent to tilting mirror in conjugate plane |
| 3 | Defocus | Trivial – Equivalent to translating lens axially |
| 4 | X Astigmatism | −0.68 |
| 5 | Y Astigmatism | −0.33 |
| 6 | X Coma | +0.01 |
| 7 | Y Coma | −0.03 |
| 8 | Spherical | +0.05 |
| 9 | X Trefoil | −0.16 |
| 10 | Y Trefoil | −0.03 |
By summing kinoforms for each aberration mode modulo 2π a single correction kinoform is obtained (shown in figure 9). This correction kinoform is then encoded into every subsequent kinoform that is generated to remove any aberrations from any non-flatness of the SLM or mis-alignments in the optical train. Figure 10 shows a diffracted Gaussian focus with and without the correction kinoform.
Figure 9.
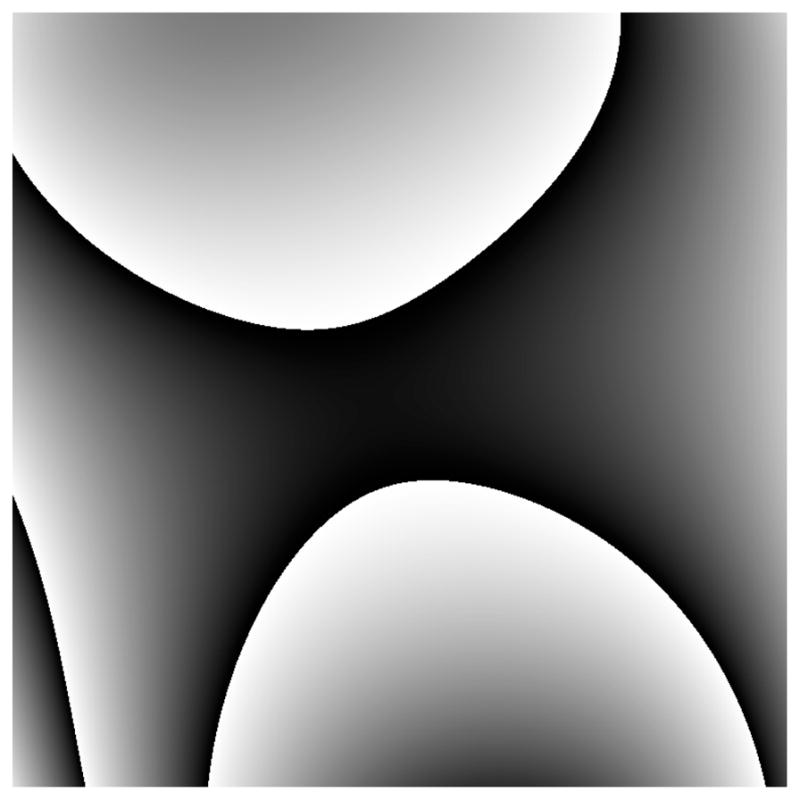
The correction kinoform calculated from the sum of the individual Zernike polynomials. Encoding this into all subsequent kinoforms effectively removes any aberrations induced from the non-flat SLM or mis-aligned optical train.
Figure 10.
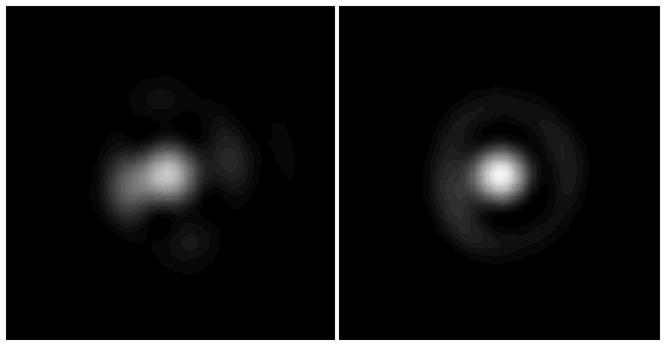
Images of a focused diffracted beam reflected off a silver mirror at the sample plane of the microscope. Left panel: Without any correction kinoforms applied. Right panel: With correction kinoforms applied. Note the increase in maximum intensity and complete second maxima ring.
The Gaussian spot has clearly been improved by the inclusion of the correction kinoform. The improvement can be quantified by the Strehl ratio, defined as the ratio of the peak intensity measured at the aberrated focus to the theoretical maximum or13
where σ is the standard deviation of the wavefront. The focus is well corrected if S > 0.8, corresponding to a standard deviation in the wavefront deformation of λ/14. Measuring the absolute Strehl ratio is difficult, so usually an increase is quoted. In this case the aberration correction produced a 22 ± 0.5% increase in the Strehl ratio.
2.3 Apparatus
The holographic optical tweezers constructed use the standard configuration with the kinoform generation implemented using a graphics processing unit (GPU) running a random superposition algorithm14. The software allows real time interactive control of trap position using LabVIEW for user input and C++ to communicate with and control the GPU. The software is an adapted version of that already used in literature15, where we have included aberration correction.
2.4 Additional consideration
When constructing holographic optical tweezers, it is paramount that the inter-lens distances are very precise to ensure the 4f imaging systems operate correctly. The generation of kinoform assumes the desired pattern is to be created in the focal plane of the last lens (objective lens) assuming all other lenses are in the correct positions.
When building the system around a commercial microscope (e.g. Nikon in our case), a problem occurs because the objective is translated axially (rather than moving the sample stage and keeping the objective at a constant axial position) for focusing. This shifting of the axial location of the objective, and hence the front focal plane, results in slightly defocused foci in the sample plane. Simply re-focusing the objective to sharpen the foci does not work because this re-focuses away from the sample plane that is being imaged.
A solution to this problem is to use the Zernike polynomials. The third Zernike polynomial describing the defocus mode of aberration was not studied previously, as it is simply a refocusing of laser light at the sample plane. However, when using a translating objective, we can use a defocus term in our aberration correction to correct for the misalignment of the objective from its desired axial position. Figure 11 shows this correction kinoform; in this case, a defocus term of −2.3 μm is used to shift the foci.
Figure 11.
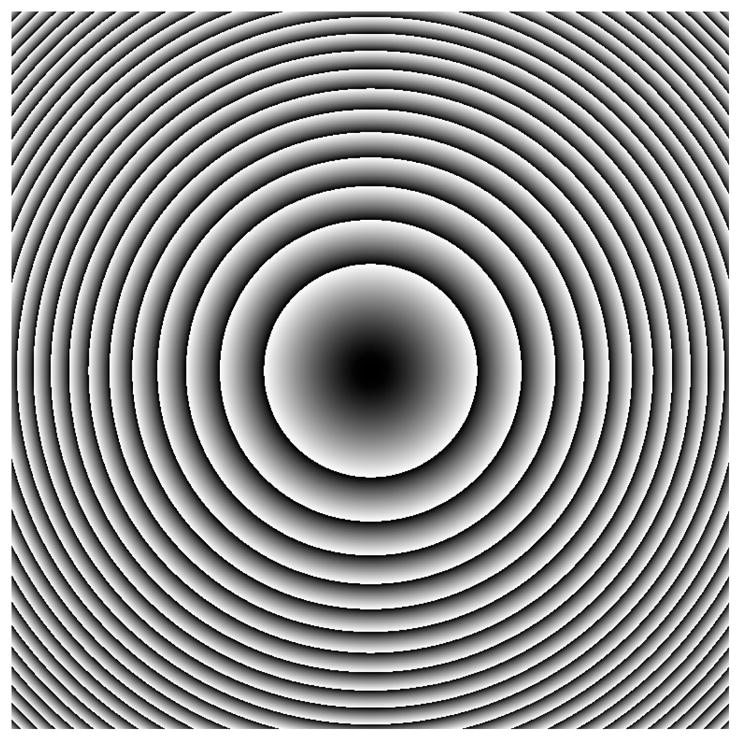
The correction kinoform used to correct for the z shift when the objective of a microscope is translated axially with respect to the sample for focusing. This kinoform uses the third Zernike polynomial describing the defocus mode.
3. PARALLELIZED POSITIONING OF PARTICLES AROUND SINGLE CELLS
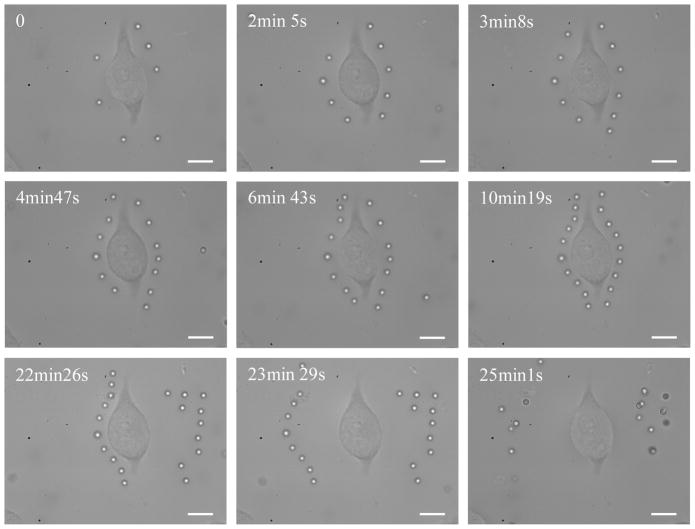
Once we have optimized the SLM for real-time parallel optical manipulation of micro and nanoparticles, we set out to demonstrate its capability by trapping multiple particles and placing the trapped particles around the periphery of single cells. Figure 12 shows one such experiment, in which a single mouse fibroblast was surrounded by an array of 2μm-diameter beads placed in a fashion so that the beads would completely en-circle the single cell.
Figure 12.
Simultaneous manipulation of 2μm-diameter polystyrene beads around a single NIH/3T3 fibroblast. The total laser power used was 1.25 W (continuous-wave output at 1064nm). Scale bar is 10μm
To carry out this experiment, we seeded and cultured the fibroblasts (NIH/3T3, ATCC® Number: CRL-1658™; American Type Culture Collection, Manassas, VA) in a Polydimethylsiloxane (PDMS) well (diameter/height: 5 mm/5 mm). To form the PDMS wells, we silanized a featureless silicon wafer over night (50 μl tridecafluoro-1,1,2,2-tetrahydrooctyl trichlorosilane under vacuum; Gelest Inc., Morrisville, PA), then casted a 5 mm thick layer of PDMS prepolymer (SYLGARD® 184 Silicone Elastomer Kit, Dow Corning, Corp., Midland, MI) onto the silanized wafer. The cast was cured at 65°C, cut into 1 cm2 squares, after which a hole puncher was used to create through holes in the center of the PDMS squares. This PDMS piece was sealed to a cover slip (Gold Seal cover glass, 48 × 65 mm, No. 1; cat. #3335/6672A66; Thomas Scientific, Swedesboro NJ) by oxygen plasma (Expanded Plasma Cleaner/Sterilizer; Harrick Plasma, Ithaca, NY) to form the final PDMS well with the glass coverslip bottom.
To achieve optimal cell adhesion, prior to seeding the cells, the wells were coated with a 1:1 dilution of Poly-L-Lysine (0.01% solution, cat. # P4707, lot 125K2361; Sigma Aldrich, Inc.) and purified water (MilliQ; Millipore Corp., Billercia, MA).
Before the experiment, the cells in the PDMS well were washed gently twice in buffer (1× phosphate buffered saline, 2 mM EDTA (99.4–100.06%, cat. no. E9884; Sigma Aldrich, Inc.), 0.5% bovine serum albumin (FractionV, approx. 99%; cat. no. A3059; Sigma Aldrich, Inc.)). Once the PDMS well containing the cells was placed on the microscope stage, ~25μL of 2.0μm-diameter polymer microspheres suspended in water (Cat. # 4202A, Lot # 33545, Duke Scientific, CA, conc. = 950×106ml−1) were added to the well. Figure 12 shows the assembling of the beads around the cell as well as the subsequent removal of the surrounding beads away from the cell.
4. CONCLUSION
We have witnessed rapid advances over the past decade in the area of parallelized optical manipulations as well as technological improvements in SLM devices. Moving forward, these technological innovations must translate into practical solutions for addressing pertinent biological questions. Here, we show advanced optical manipulation techniques complement our previous developments of nanocapsules. In combination, bioactive molecules confined within individual nanocapsules can be placed adjacent to cells with great precision using optical techniques, then released onto the cells with great spatiotemporal control. We believe this capability will enable future studies of cellular systems where the delivery of stimuli to cells must be controlled over space and time.
Acknowledgments
We thank the Optics group at the University of Glasgow for their generous help with the interactive GPU and LabVIEW software. This work was supported by NSF (CHE-0924320) and NIH (GM085485). DRB is a Lindemann Trust Fellow.
References
- 1.Sun B, Chiu DT. Spatially and temporally resolved delivery of stimuli to single cells. Journal of the American Chemical Society. 2003;125:3702–3703. doi: 10.1021/ja029942p. [DOI] [PubMed] [Google Scholar]
- 2.Sun BY, Chiu DT. Synthesis, loading, and application of individual nanocapsules for probing single-cell signaling. Langmuir. 2004;20:4614–4620. doi: 10.1021/la0364340. [DOI] [PubMed] [Google Scholar]
- 3.Sun BY, Lim DSW, Kuo JS, Kuyper CL, Chiu DT. Fast initiation of chemical reactions with laser-induced breakdown of a nanoscale partition. Langmuir. 2004;20:9437–9440. doi: 10.1021/la048444m. [DOI] [PubMed] [Google Scholar]
- 4.Sun B, Mutch SA, Lorenz RM, Chiu DT. Layered polyelectrolyte-silica coating for nanocapsules. Langmuir. 2005;21:10763–10769. doi: 10.1021/la0513297. [DOI] [PubMed] [Google Scholar]
- 5.Sun BY, Chiu DT. Determination of the encapsulation efficiency of individual vesicles using single-vesicle photolysis and confocal single-molecule detection. Anal Chem. 2005;77:2770–2776. doi: 10.1021/ac048439n. [DOI] [PubMed] [Google Scholar]
- 6.Dendramis KA, Allen PB, Reid PJ, Chiu DT. Spectrally tunable uncaging of biological stimuli from nanocapsules. Chemical Communications. 2008;39:4795–4797. doi: 10.1039/b806685j. [DOI] [PMC free article] [PubMed] [Google Scholar]
- 7.Dendramis KA, Chiu DT. Laser photolysis of dye-sensitized nanocapsules occurs via a photothermal pathway. Journal of the American Chemical Society. 2009;131:16771–16778. doi: 10.1021/ja904976r. [DOI] [PMC free article] [PubMed] [Google Scholar]
- 8.Smith BP, Dendramis KA, Chiu DT. Investigating lyophilization of lipid nanocapsules with fluorescence correlation spectroscopy. Langmuir. 2010;26:10218–10222. doi: 10.1021/la1003808. [DOI] [PMC free article] [PubMed] [Google Scholar]
- 9.Kohler C, Schwab X, Osten W. Optimally tuned spatial light modulators for digital holography. Applied Optics. 2006;45:960–967. doi: 10.1364/ao.45.000960. [DOI] [PubMed] [Google Scholar]
- 10.Zernike F. Beugungstheorie des schneidenverfahrens und seiner verbesserten form, der phasenkontrastmethode. Physica. 1934;1:689–704. [Google Scholar]
- 11.Born M, Wolf E. Principles of Optics. Cambridge University Press; 1980. [Google Scholar]
- 12.Wulff KD, Cole DG, Clark RL, Di Leonardo R, Leach J, Cooper J, Gibson G, Padgett MJ. Aberration correction in holographic optical tweezers. Optics Express. 2006;14:4169–4174. doi: 10.1364/oe.14.004169. [DOI] [PubMed] [Google Scholar]
- 13.Mahajan VN. Wave Diffraction Optics. SPIE Publications; 2001. Optical Imaging and Aberrations, Part II. [Google Scholar]
- 14.Burnham DR. PhD Thesis. University of St Andrews; 2009. Microscopic Applications of Holographic Beam Shaping and Studies of Optically Trapped Aerosols. [Google Scholar]
- 15.Preece D, Bowman R, Linnenberger A, Gibson G, Serati S, Padgett M. Increasing trap stiffness with position clamping in holographic optical tweezers. Optics Express. 2009;17:22718–22725. doi: 10.1364/OE.17.022718. [DOI] [PubMed] [Google Scholar]


