

Abstract
Development depends on the precise control of gene expression in time and space. A critical step towards understanding the global gene regulatory networks underlying development is to obtain comprehensive information on gene expression. In this study, we measured expression profiles for the entire expressed gene set during sea urchin embryonic development. We confirmed the reliability of these profiles by comparison with NanoString measurements for a subset of genes and with literature values. The data show that ~16,500 genes have been activated by the end of embryogenesis, and for half of them the transcript abundance changes more than 10-fold during development. From this genome scale expression survey, we show that complex patterns of expression by many genes underlie embryonic development, particularly during the early stages before gastrulation. An intuitive web application for data query and visualization is presented to facilitate use of this large dataset.
Keywords: sea urchin, developmental transcriptome, RNA sequencing
INTRODUCTION
Differential gene expression in time and space are the essence of the developmental process. With the availability of material on the scale of liters of eggs, sea urchin embryos, in particular those of Strongylocentrotus purpuratus, have long been used as an experimental model for study of gene expression. A rich earlier history of studies of cell specification in this species complements examinations of differential gene expression (Davidson, 1986). Current studies have led to one of the most complete gene regulatory networks (GRNs) for early development (Oliveri et al., 2008; Peter and Davidson, 2009; Peter et al., 2012). Genomically encoded cis-regulatory modules constitute the nodes of the GRN. Various inputs are integrated at these modules to control gene expression. The regulatory state of a particular embryonic cell is the sum of the various regulatory gene expressions in that cell. Subsequent regulatory states in descendant daughter cells follow through the activity of the regulatory state in the ancestor.
Hints of these regulatory processes had been revealed in mass culture experiments before the 1990s. First maternal RNA transcripts, then later zygotic ones coding for regulatory molecules, install the progressively more complex sets of regulatory states which accompany the increasing number of embryonic cells. The messenger RNA is stored in the unfertilized egg as a complex mixture of poly(A)- and non-poly(A)- RNA. It was estimated to amount to 30pg per egg in mass and approximately 8500 message species of 2Kb in length (Davidson, 1986). Transcription increases in the early divisions after fertilization, reaching a maximal rate by 4–5th cleavage (Wilt, 1970). Through nearly equivalent rates of synthesis and degradation, steady state mRNA content remains the same throughout embryonic development. From the kinetics of polysome assembly (Goustin and Wilt, 1981) and solution hybridization of genomic DNA with cytoplasmic RNA samples it is inferred that the loading of maternal RNA on polysomes to synthesize maternally encoded proteins is completed by approximately the 8-cell stage. Thereafter newly synthesized mRNAs are loaded.
Since these early mass measurements, our views of gene expression and developmental process have been refined through numerous measurements of single or small sets of genes in the embryo. New technologies make it possible to envision gene regulatory networks controlling the total of all genes expressed in development. Thus, a temporal profile of all of the genes expressed in the embryo would contribute an important piece of this puzzle. Using a largely complete gene set produced from deep sequencing of 22 stages and tissues of the purple sea urchin (Tu et al., 2012), we are now in a position to enumerate the temporal patterns of gene expression for the entire 21,000 genes at 10 time points in the embryonic development of this species. Estimates of temporal expression patterns are particularly informative during embryonic stages since the total mass of RNA remains approximately the same throughout this period.
RESULTS AND DISCUSSION
Quantification of developmental transcriptomes
We have analyzed transcriptomes throughout embryonic development of the Strongylocentrotus purpuratus using the RNA-seq method. A set of gene models was generated from RNA-seq data in an earlier study (Tu et al., 2012). The transcript abundance was estimated for each gene at each of the 10 embryonic stages (Table S1) in FPKM (Fragments Per Kilobase of transcript per Million mapped reads) using Cufflinks (Trapnell et al., 2010). A set of internal standards comprising mRNAs present in known numbers of molecules was added to the sample (Mortazavi et al., 2008). The mRNA mass of each sequenced sample before adding the internal standards was 100 ng. Using the precise values for mRNA in the sea urchin embryo previously obtained, we calculated that this is equivalent to ~3300 embryos. Thus the relative FPKM values can be translated to the absolute abundance number in terms of transcripts per embryo. For example, an FPKM value of ~5 is equal to 300 transcripts per embryo.
We refined the measurement of transcript abundance in several ways. A key point is that we used the coding sequence (CDS) instead of the full-length gene models to calculate the number of reads mapped. As its name indicates, an FPKM value is the number of reads mapped to the given gene model normalized by the length of the model and by the total number of reads mapped to the genome. Since the full-length gene models were generated from 22 samples including embryonic stages, larval stages, and adult tissues, they include the longest untranslated regions (UTR). The UTRs of transcripts in individual samples might vary significantly. When the full-length gene models are used in the FPKM calculation, transcripts with shorter UTRs will still be normalized to the longest lengths, thus distorting the FPKM values. However, CDSs are the same across all samples. Thus we used CDS length for the abundance calculation, and we found that counting reads mapped only to the CDSs produces the most accurate FPKM values.
In order to confirm the reliability of the quantitation method, for nine stages the abundance of a set of 173 regulatory genes in the same samples was measured using NanoString, an instrument which counts mRNA directly without use of enzymatic reactions (Geiss et al., 2008). These NanoString measurements were used as a gold standard for validation of the values obtained by the RNA-seq method. The FPKM values derived from the RNA-seq data were compared with the NanoString counts of the control set of genes (Figure 1A) and correlation coefficients for the 173 pairs of profiles were also calculated (Figure 1B and 1C). The results from two methods matched very well. The median of the correlation coefficients is 0.923. A typical pair of expression profiles is shown in Figure 1B, and all individual comparisons are shown in Figure S1A.
Figure 1.
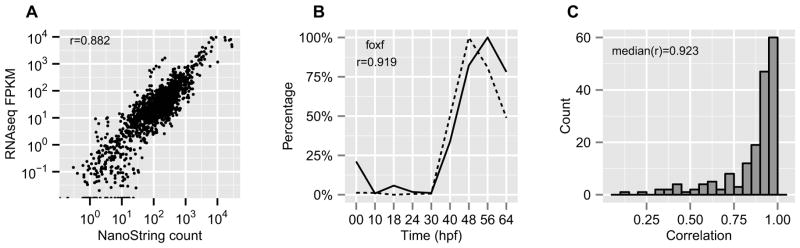
Comparison between measurements by NanoString and RNA-seq. (A) Measurements of 173 genes in nine samples of different embryonic developmental stages. (B) An example (FoxF) of time course profiles measured by NanoString and RNA-seq. The correlation coefficient between the two profiles is 0.919. Solid line: NanoString; Dashed line: RNA-seq. (C) The distribution of correlation coefficients of the time course profiles measured by NanoString and RNAseq for each gene. The median value is 0.923. See also Figure S1.
General quantitative aspects of developmental transcriptomes
There are ~23,000 genes predicted to exist in the S. purpuratus genome (Sea Urchin Genome Sequencing Consortium et al., 2006) and the earlier transcriptome study compiled 21,092 gene models based on 22 transcriptomes (Tu et al., 2012). A cutoff of 300 transcripts per embryo (FPKM ~5) was chosen as the lower limit for a functionally meaningful level of transcript representation. In an embryo at the mesenchyme blastula stage this criterion is equivalent to less than one transcript per cell for a ubiquitously expressed gene, or more for a cell-type-specifically expressed gene. Thus for example, even productively transcribed regulatory genes which produce low abundance mRNAs are expressed above this level, and technical variations in the quantification by the RNA-seq method are relatively low at this cutoff (Tu et al., 2012). Calculated in this way, ~16,500 genes (72% of the estimated total gene number) have been activated in at least one of the embryonic stages surveyed. These genes can be defined as an embryonic gene repertoire. They are shown as dots above the dashed ordinate cutoff line in Figure 2A, as their highest transcript abundances during embryogenesis are >300. Similarly, embryonic housekeeping genes that are continuously expressed throughout embryogenesis can be identified if the lowest transcript abundance is over this cutoff (Figure 2A, dots to the right of the dotted abscissa cutoff line). This class constitutes ~5700 genes (35% of the repertoire). A large-scale developmental transcriptome study of Drosophila melanogaster reported a similar percentage: 40% of expressed genes are constitutively expressed in all 27 stages studied, including embryonic, larval, and adult stages (Graveley et al., 2011). Considering the relative expression profiles, the transcript abundance level of ~7900 genes (48% of the embryonic gene repertoire) undergo changes greater than 10-fold (Figure 2A, red dots), while only ~1300 genes (8% of the embryonic gene repertoire) express at relatively constant levels (less than 3-fold variation) (Figure 2A, blue dots). These statistics reflect the highly dynamic use of the embryonic transcriptome, which is characteristic of the majority of genes used during this time.
Figure 2.

Various distributions of transcript abundance. (A) The highest and lowest transcript abundance for each gene during embryogenesis. The ordinate is the highest and the abscissa is the lowest transcript abundance. The ordinate cutoff (>300 transcript per embryo, horizontal dashed line) defines whether a gene has been expressed: the upper colored dots are the embryonic gene repertoire; the lower gray dots are genes which are below threshold. The abscissa cutoff (vertical dotted line) defines whether a gene has been continuously expressed: the dots on the right side represent the embryonic housekeeping genes, and the dots on the left side represent the genes whose transcript levels are very low at one or more time points. The diagonal color layers indicate the ratio between the highest and lowest transcript abundance: the blue dots represent genes expressed at constant levels with the fold less than 3; the red dots represent genes expressed at dynamic levels varying more than 10 fold. (B, C, D) Distributions of transcript abundance in the 24 hpf embryo. (B) Linear histogram of transcript abundance showing between 0–3000 transcripts per embryo. The vertical line represents 300 transcripts per embryo. (C) Log histogram of transcript abundance. All values were shifted up by 1 so that non-expressed genes (the bar at 100) can be made visible on the log plot. The vertical line represents 300 transcripts per embryo. (D) Cumulative abundance.
At each stage of sea urchin embryogenesis, on average ~11,500 genes are actively transcribed, producing about 39 million transcripts per embryo. The histograms with linear and log scales show that the transcript abundance follows a log-normal distribution (Figure 2B, 2C), and the cumulative histogram shows that 1% of genes contribute 39% of transcripts, 20% of genes contribute 85% of transcripts, 50% of those genes that are considered as active genes contribute 97% of transcripts (Figure 2D). From these plots, it is apparent that there is not a definitive boundary between so called “active” and “non-active” genes, thus an empirical threshold of activity (>300 transcripts per embryo) was used, as indicated above. However, defined in such a way the active genes produce the overwhelming majority of the transcripts.
Complexity of an mRNA population is defined as the length of single copy DNA sequence represented in the RNA population. It describes the minimum amount of unique sequence content in a population of sequences. Traditionally it was measured by RNA/DNA reassociation kinetics. Here we can calculate it directly from the RNA-seq data. But the complexity is not the total length of gene models of active genes. As discussed before, the gene models generated in the previous study are based on the pool of 22 samples, and all combined UTRs could result in a gene model length greater than any one stage-specific transcript. To accurately estimate the complexity of each transcriptome, reads from each sample are assembled into sets of stage specific gene models which were in turn used to calculate the complexity. The average complexity is 24.6Mb for the transcriptome and 2.1Kb for each gene. Solution hybridization methods estimated the complexity of the S. purpuratus blastula-gastrula transcriptome at 16.5Mb. This lower estimate is comparable since the hybridization methods underestimate very similar gene sequences and very rare transcripts (Davidson, 1986).
The dynamics of expression
To more clearly represent the ~16,500 embryonic gene expression profiles, we performed a cluster analysis. As there are no well-defined boundaries between clusters of temporal profiles, we choose a fuzzy clustering algorithm mfuzz (Futschik and Carlisle, 2005) which can assign genes gradual degrees of membership to a cluster. Each expression profile was normalized by the peak value of the given gene during the development, because different genes execute their functions at very different levels, and the peak values are biologically meaningful. These relative expression profiles of the embryonic genes were grouped into 100 clusters (Figure S2A). The distribution of the gene number per cluster is shown in Figure S2B and C. For simplicity in the following discussion, each gene was assigned to the cluster of its maximum membership even though it could be included to a lesser extent in other clusters. However the fuzzy clustering details are retained in our web query application, so that users can decide the assignments manually (see below).
These clusters can be further merged into four major groups based on overall dynamics: “turn-off”, “turn-on”, “transient”, and “other” (Figure 3). Each cluster was manually assigned to one of these groups. Because these expression profile clusters have no well-separated boundaries, the assignment is somewhat arbitrary. Nevertheless, an overview obtained from the analysis is useful.
Figure 3.

Heatmap of relative expression profiles of embryonic genes. The transcript abundance of each gene is shown as a horizontal line and the lines are ordered by clusters. The ordinate shows IDs of clusters. The clusters are divided into four major groups. The abscissa gives developmental stages in terms of hours post fertilization. The density indicates the abundance relative to the maximum value for the given gene during embryonic development. Black is maximum and white is zero. See also Figure S2 and Figure S3.
The “turn-off “ type constitutes 34% of the genes. The transcripts of these genes are highly abundant in the unfertilized egg, and then they start to decrease within 10–18 hours post fertilization (hpf). Only a small percentage of these maternal genes, the bottom four clusters (012, 013, 024, 070) in Figure 3, remain quiescent during the whole of embryogenesis, while most of the maternal genes are expressed again at later stages (Flytzanis et al., 1982).
The “transient” type is typified by 26% of the genes. They are not maternally expressed, but reach a peak during development, then return to much lower levels in late stages. Interestingly more than half attain a peak during cleavage (10 hpf) and early blastula stages (18 hpf). Almost all of them reach their peak values before early gastrulation (30 hpf).
The “turn-on” type constitutes 22% of the genes. These genes begin to be transcribed at various early or late stages and remain abundant throughout the remaining stages of embryonic development. The activity of these genes may increase at any developmental stage.
The remaining 18% of the expression profiles either remain constant throughout development or display more complex dynamic changes and cannot easily be grouped with the major types discussed above.
From this overview, it is apparent that there is no transcriptional quiescence in sea urchin embryos (Davidson, 1986). Most sea urchin maternal transcripts decrease quickly after fertilization and a large portion of the zygotic genome is activated during cleavage stages. Actually transcription is observed even in the unfertilized sea urchin egg, and continues in the zygote nucleus and throughout cleavage. This is in contrast to Drosophila and Xenopus, in which the genome remains quiescent until the blastoderm and blastula stage respectively (Davidson, 1986).
It is noteworthy that the activities of many genes undergo marked changes during the early phases of development before gastrulation (30–40 hpf). This includes almost all genes of the “turn-off” and “transient” types, and about half of the “turn-on” type. Altogether these genes account for 70% of the embryonic repertoire of genes. These varied profiles accompany drastic morphological changes: logarithmic increases in cell number, ingression of skeletogenic mesenchyme cells, and the establishment of many new regulatory states. After the early phases, gene expressions tend to remain at much more stable levels.
Gene usage in different functional classes
Previously we established a functional classification system using manually curated classes (Tu et al., 2012). Here we combined this classification system with a restricted group of GO terms derived from Blast2GO (Götz et al., 2008). In all, 39% of the genes fall into these 27 classes. The number of actively transcribed genes of each class at each developmental stage was compiled (Figure 4). Many classes do not show a dramatic change in terms of active gene number. However, genes from classes of several specialized functions, e.g. biomineralization, defensome, immunity, and nervous system, become significantly active only later in development, particularly after gastrulation begins (30 hpf).
Figure 4.

Change of number of actively transcribed genes of each function class. Classes compiled in our earlier study (Tu et al., 2012) are annotated with the prefix ‘DB’. Classes compiled using Blast2GO in this study are annotated with the prefix ‘GO’. Highlighted (black bars) classes show an increasing trend.
Although knowledge of function and expression of many gene categories in the sea urchin is not extensive, some classification groups are well enough understood to allow comparisons between timing of expression and function to be drawn. For example in an earlier study the utilization during embryogenesis of every gene encoding a transcription factor predicted in the S. purpuratus genome was reported, and it was found that about 80% of the entire regulatory repertoire is expressed by the end of embryogenesis (Howard-Ashby et al., 2006). This is similar to the fraction of all genes expressed as reported in this work, a reasonable result since the expressed genes require the inputs provided by the expressed regulatory genes.
Turning to effector gene repertoires, we see that the pattern of utilization of the genes in the biomineralization functional group is not uniform (Figure S3A). Transcripts of genes that code for spicule matrix proteins accumulate at about 24 hpf when the cells that express these genes have ingressed into the blastocoel and are taking up their position before spiculogenesis begins. On the contrary, many cyclophilins started expression much earlier. Cyclophilins play multiple roles in cell biology. Their exact functions in sea urchin embryonic skeletogenesis are not clear, but indicated by their early expression profiles, they may play a role during specification of skeletogenic mesenchyme cells rather than in spiculogenesis directly.
Another example is the genes that encode for cell cycle proteins. The early cell cycles occur very rapidly and are devoid of the gap phases of the cycle. Cdk1, together with Cyclin A and B, drives the transition from G2 to M phase. Cdk2, together with Cyclin A and E, drives the G1 to S phase transition (Fernandez-Guerra et al., 2006). Transcripts for these five genes have highly similar profiles: they are very abundant in the egg as well as in cleavage stage embryos, and then decrease sharply. In fact, Cyclin A and B are amongst the most prominent maternal transcripts observed. Many other cell cycle kinases display distinctly different profiles: for instance those whose expression increases as cell cycles occur over longer intervals and gap phases emerge (Figure S3B).
The requirement for DNA replication machinery is expected to increase with cell number during early stages. Replication forks are made active by the recruitment of the DNA helicase MCM2-7 proteins among others. It is interesting that transcripts for MCM3, MCM5 and MCM7 are very abundant in the egg and but then decrease substantially by 10 hpf (Figure S3C). The number of these transcripts should reflect the rates of cell division which are very high for the first 12 hours then begin to slow as different embryo lineages drop out of the cell cycle.
Maternal transcripts
These data afford a detailed assessment of exactly what transcripts constitute the maternal mRNA stockpile with which the early embryo is equipped. There are ~9800 species of transcripts in the unfertilized egg above the threshold of >300 copies per egg. To examine the functional significance of these maternally expressed genes, we used a binomial test to compare the observed number of active genes with the expected number for each function class assuming random representation in the maternal class (Figure 5). We found maternal genes related to the cytoskeleton, GTPases, kinases, and protein transportation are the most over-represented classes (p<1e-5). Furthermore, genes involved in more specialized functions, e.g. defensome, immunity, nervous system related genes, are the most under-represented.
Figure 5.

Gene numbers for different function classes in the maternal transcriptome. Black bars represent the gene number of the given class observed; white bars represent the gene number of the given class expected according to its percentage of the whole gene set. Black triangles indicate over-representation with significant p values when comparing the observed and expected gene numbers by a binomial test. White triangles indicate under- representation. See also Figure S4.
Despite these over- and under-represented classes, transcripts encoding proteins of almost every functional class that we know are presented in the unfertilized egg, which means basic requirements for life and for all cells are covered by the maternal transcripts. Spatially specific transcripts are then provided by the zygotic genome.
We defined a gene as exclusively maternal if its expression level peaks in the egg sample (before fertilization), then falls to less than 25% of the peak after mesenchyme blastula stage (24 hpf), and its lowest expression level during embryogenesis is less than 300 transcripts per embryo. Only 489 genes belong to this exclusively maternal class. As discovered earlier (Davidson, 1986) most maternally transcribed genes are re-used during the subsequent stages of development. Among the exclusively maternal genes, those related to DNA metabolism (DNA repair, replication, catabolic etc) are significantly overrepresented (p<0.01) (Figure S4). This suggests that some special functions related to DNA metabolism need to be executed only in early embryos.
Most of the highly abundant (>30,000 transcripts per embryo) maternal transcription factors (Ets1/2, Otx, Soxb1, Soxb2, Dac, Hmg2) are well studied. However, a newly identified, un-annotated gene (SPU_018056) encoding a homeobox protein also falls into this group.
Most mRNAs are degraded by exonucleases, and this type of decay pathway consists of four ribonucleolytic activities: decapping, 5′-to-3′ exonucleolytic decay, deadenylation, 3′-to-5′ exonucleolytic decay. For some mRNAs, decay is initiated by endonuclease cleavage (Schoenberg and Maquat, 2012). We checked the major mRNA decay components and found many of them are highly active at very early stages (Table S2, Figure S3D), suggesting some of these genes are involved in the rapid clearance of maternal polyadenylated RNAs.
Abundant transcripts
The most abundant transcripts did not escape the attention of molecular developmental biologists working in the time before RNA-seq analysis of transcription was available. Defined as transcripts present at over 200,000 copies per embryo at any one stage (Table S3), there are 32 genes including cyclins, sea urchin specific replication independent histones, translation apparatus components, cytoskeletal, adhesion, metal binding proteins, and so forth. These genes provide an additional perspective on the transcriptional activity of early development. In what follows, we elaborate on several such examples.
The gene Rrm2 encodes the small chain of ribonucleotide reductase. Since the endogenous dNTP pool is only sufficient to support DNA synthesis for two to three cell divisions (Nemer, 1962), ribonucleotide reductase is required to maintain DNA synthesis throughout the rapid cleavage stage. The expression profile of Rrm2 observed in this study is consistent with the enzyme activity previously reported, which increases sharply after fertilization and reaches a peak at the cleavage stage (de Petrocellis and Rossi, 1976).
Three genes, ClvhH2a, ClvhH2b, and H2a.Z, encode for replication independent histones unique to sea urchins and which unlike all major histone mRNAs, contain introns and are polyadenylated (Mandl et al., 1997; Marzluff et al., 2006). Transcripts for ClvhH2a, ClvhH2b are highly abundant in the egg as well as in cleavage stage embryos, while H2a.Z peaks at mesenchyme blastula stage, again consistent with what had previously been reported (Ernst et al., 1987).
A set of genes encoding translation apparatus components is very active and these genes show a gradual increasing expression profile. They include six ribosomal protein genes and one elongation factor EF1a. The expression levels of these genes increase concomitantly with the increase in the cell number of the embryo.
Of the four genes encoding metal binding proteins in the list, one encodes a heavy metal binding protein, Metallothionein A (MTA); another, Ferritin heavy chain (Fth1) binds iron and the last two, Spec1, and Spec2a/c bind calcium ions. Metallothioneins bind various heavy metals, playing a major role in chemical defense and metal homeostasis. MTA reaches a high level at early blastula stage (24 hpf), when there are about 200,000 transcripts per embryo (Nemer et al., 1991). Ferritin is an iron storage protein, and it is under multiple regulation mechanisms. Ferritin protein is present in the unfertilized egg, but no ferritin transcripts are there. It starts to accumulate from early blastula stage (Infante et al., 1993). The calcium-binding proteins, Spec1 and Spec2 are expressed in the embryonic ectoderm (Carpenter et al., 1984). The transcripts of these genes are present at very low levels in the unfertilized egg, begin to accumulate at the late cleavage to early blastula stage, and at 48 hpf reach levels 100-fold over those in the egg (Bruskin et al., 1981; Tomlinson and Klein, 1990).
Na+/K+ ATPase activity increases sharply at blastula stage and beyond (Leong and Manahan, 1997) and this is congruent with the expression profile for Na+/K+ ATPase 3 (Atp1a3) which reaches a peak at 18–40 hpf. It is interesting to note that Na+/K+ ATPase contributes a major portion of the metabolic activity of the embryo and up to 77% of the metabolism of the larval stage (Leong and Manahan, 1997).
Data access
This dataset has been used in several projects directed at elucidation of gene regulatory networks in our lab, and has proven to be very useful. To facilitate public use of this large dataset, a web application (http://www.spbase.org:2000/quantdev/) for data query and visualization was developed using the R/Shiny package. It can be used in answering questions such as: What are the expression profiles of the given genes or of all genes in a given functional class? What genes have a similar expression profile to that of a given gene? In which functional class are given genes annotated? What is the detailed annotation information for a given gene in SpBase (the sea urchin genome database)? What are the mRNA, predicted CDS, predicted peptide sequences of given genes? And what are the genomic structure and mapped reads of given genes?
Users can query by gene names, IDs, function classes and expression profiles. The web application returns results with the annotation information, a link to the corresponding records in SpBase (Cameron et al., 2009), the link to the loci in the genome browser, quantitative measurements for each stage, and sequences, including mRNA, predicted CDS and protein. All these data can be downloaded. Heatmaps and customizable line plots representing the quantitative measurements are generated as well. The web application is intuitive and returns the results in real time. It provides some convenient functions, for example ID auto-detection, so that users can simply cut some text containing gene IDs from other sources and paste directly into the search box. The web application will extract IDs automatically without users’ editing.
Users can take advantage of the fuzzy clustering algorithm: start with a given cluster but increase the fuzzyness to obtain more profiles that to some degree are similar to the given cluster. As discussed above, commonly used hard clustering algorithms assign a profile to only a single cluster, thus preventing searching for temporal profiles that are less similar. Fuzzy clustering is a unique feature of this application that provides a flexible way to search gene expression profiles.
Combining these features together, the web application provides a powerful interactive tool to explore the dataset. One scenario could be: a user can initiate a search from a known gene, obtain its expression profile cluster information, then perform another search for that profile cluster with relaxed fuzziness, finally select transcription factors from the results using the annotation information. Thus by a few simple searches, the user gets all transcription factors with the expression profiles similar to the given gene.
Together, this dataset illustrates complex and dynamic gene expression profiles during sea urchin embryonic development. The precise control of gene expression resulting from the complex control circuits of gene regulatory networks that utilize many transcription factors and signal systems explains some of this complexity. However, temporal profiles alone cannot provide satisfactory descriptions in an embryo where the majority of the embryonic gene expression is restricted is space as well as time. A genome scale study of gene expression spatial patterns will be the next challenge on the road towards building a global gene regulatory network.
MATERIALS AND METHODS
Computational analysis
The analysis was done based on the sequencing dataset and gene models assembled in an early study (Tu et al., 2012). Abundance was estimated by Cufflinks (Trapnell et al., 2010). Various versions and parameters were tested and version 1.3.0 with ‘frag-bias-correct’, ‘multi-read-correct’, and ‘compatible-hits-norm’ gave the best result using ORFs as the gene model reference. FPKM values were then converted to the unit of transcript per embryo as described above. For clustering, the abundance values were normalized by the maximum value of the given gene during the embryonic development. Then the relative expression profiles were analysis by R package mfuzz (2.19) (Futschik and Carlisle, 2005). GO annotation was done by Blast2GO (Götz et al., 2008). All visualization was done in R with the ggplot2 (0.9.3) package (Wickham, 2009). The website was built in R with ggplot2 and shiny (0.1.0) package (http://www.rstudio.com/shiny/).
NanoString nCounter assay
The abundance of a set of transcripts was measured using the NanoString nCounter following manufacturer’s instructions and a previous study (Materna et al., 2010). For each sample, 5μl 100ng total RNA was used.
Supplementary Material
The developmental transcriptomes during sea urchin embryogenesis were measured.
The individual expression profiles are highly dynamic particularly during the early stages before gastrulation.
A web application for data query and visualization was built.
Acknowledgments
We thank Dr. Julius C. Barsi for valuable comments on the manuscript. This work was supported by NIH (P40OD010959, P40RR015044, HD037105).
Footnotes
Publisher's Disclaimer: This is a PDF file of an unedited manuscript that has been accepted for publication. As a service to our customers we are providing this early version of the manuscript. The manuscript will undergo copyediting, typesetting, and review of the resulting proof before it is published in its final citable form. Please note that during the production process errors may be discovered which could affect the content, and all legal disclaimers that apply to the journal pertain.
References
- Bruskin AM, Tyner AL, Wells DE, Showman RM, Klein WH. Accumulation in embryogenesis of five mRNAs enriched in the ectoderm of the sea urchin pluteus. Dev Biol. 1981;87:308–318. doi: 10.1016/0012-1606(81)90154-8. [DOI] [PubMed] [Google Scholar]
- Cameron RA, Samanta M, Yuan A, He D, Davidson EH. SpBase: the sea urchin genome database and web site. Nucleic Acids Res. 2009;37:D750–4. doi: 10.1093/nar/gkn887. [DOI] [PMC free article] [PubMed] [Google Scholar]
- Carpenter CD, Bruskin AM, Hardin PE, Keast MJ, Anstrom J, Tyner AL, Brandhorst BP, Klein WH. Novel proteins belonging to the troponin C superfamily are encoded by a set of mRNAs in sea urchin embryos. Cell. 1984;36:663–671. doi: 10.1016/0092-8674(84)90346-5. [DOI] [PubMed] [Google Scholar]
- Davidson EH. Gene Activity in Early Development. 3. Academic Press; Orlando, FL: 1986. [Google Scholar]
- de Petrocellis B, Rossi M. Enzymes of DNA biosynthesis in developing sea urchins. Changes in ribonucleotide reductase, thymidine, and thymidylate kinase activities. Dev Biol. 1976;48:250–257. doi: 10.1016/0012-1606(76)90089-0. [DOI] [PubMed] [Google Scholar]
- Ernst SG, Miller H, Brenner CA, Nocente-McGrath C, Francis S, McIsaac R. Characterization of a cDNA clone coding for a sea urchin histone H2A variant related to the H2A.F/Z histone protein in vertebrates. Nucleic Acids Res. 1987;15:4629–4644. doi: 10.1093/nar/15.11.4629. [DOI] [PMC free article] [PubMed] [Google Scholar]
- Fernandez-Guerra A, Aze A, Morales J, Mulner-Lorillon O, Cosson B, Cormier P, Bradham C, Adams N, Robertson AJ, Marzluff WF, Coffman JA, Genevière AM. The genomic repertoire for cell cycle control and DNA metabolism in S. purpuratus. Dev Biol. 2006;300:238–251. doi: 10.1016/j.ydbio.2006.09.012. [DOI] [PubMed] [Google Scholar]
- Flytzanis CN, Brandhorst BP, Britten RJ, Davidson EH. Developmental patterns of cytoplasmic transcript prevalence in sea urchin embryos. Dev Biol. 1982;91:27–35. doi: 10.1016/0012-1606(82)90004-5. [DOI] [PubMed] [Google Scholar]
- Futschik ME, Carlisle B. Noise-robust soft clustering of gene expression time-course data. J Bioinform Comput Biol. 2005;3:965–988. doi: 10.1142/s0219720005001375. [DOI] [PubMed] [Google Scholar]
- Geiss GK, Bumgarner RE, Birditt B, Dahl T, Dowidar N, Dunaway DL, Fell HP, Ferree S, George RD, Grogan T, James JJ, Maysuria M, Mitton JD, Oliveri P, Osborn JL, Peng T, Ratcliffe AL, Webster PJ, Davidson EH, Hood L, Dimitrov K. Direct multiplexed measurement of gene expression with color-coded probe pairs. Nat Biotechnol. 2008;26:317–325. doi: 10.1038/nbt1385. [DOI] [PubMed] [Google Scholar]
- Goustin AS, Wilt FH. Protein synthesis, polyribosomes, and peptide elongation in early development of Strongylocentrotus purpuratus. Dev Biol. 1981;82:32–40. doi: 10.1016/0012-1606(81)90426-7. [DOI] [PubMed] [Google Scholar]
- Götz S, García-Gómez JM, Terol J, Williams TD, Nagaraj SH, Nueda MJ, Robles M, Talón M, Dopazo J, Conesa A. High-throughput functional annotation and data mining with the Blast2GO suite. Nucleic Acids Res. 2008;36:3420–3435. doi: 10.1093/nar/gkn176. [DOI] [PMC free article] [PubMed] [Google Scholar]
- Graveley BR, Brooks AN, Carlson JW, Duff MO, Landolin JM, Yang L, Artieri CG, van Baren MJ, Boley N, Booth BW, Brown JB, Cherbas L, Davis CA, Dobin A, Li R, Lin W, Malone JH, Mattiuzzo NR, Miller D, Sturgill D, Tuch BB, Zaleski C, Zhang D, Blanchette M, Dudoit S, Eads B, Green RE, Hammonds A, Jiang L, Kapranov P, Langton L, Perrimon N, Sandler JE, Wan KH, Willingham A, Zhang Y, Zou Y, Andrews J, Bickel PJ, Brenner SE, Brent MR, Cherbas P, Gingeras TR, Hoskins RA, Kaufman TC, Oliver B, Celniker SE. The developmental transcriptome of Drosophila melanogaster. Nature. 2011;471:473–479. doi: 10.1038/nature09715. [DOI] [PMC free article] [PubMed] [Google Scholar]
- Howard-Ashby ML, Materna SC, Brown CT, Tu Q, Oliveri P, Cameron RA, Davidson EH. High regulatory gene use in sea urchin embryogenesis: Implications for bilaterian development and evolution. Dev Biol. 2006;300:27–34. doi: 10.1016/j.ydbio.2006.10.016. [DOI] [PMC free article] [PubMed] [Google Scholar]
- Infante AA, Infante D, Rimland J. Ferritin gene expression is developmentally regulated and induced by heat shock in sea urchin embryos. Dev Genet. 1993;14:58–68. [Google Scholar]
- Leong P, Manahan D. Metabolic importance of Na+/K+-ATPase activity during sea urchin development. J Exp Biol. 1997;200:2881–2892. doi: 10.1242/jeb.200.22.2881. [DOI] [PubMed] [Google Scholar]
- Mandl B, Brandt WF, Superti-Furga G, Graninger PG, Birnstiel ML, Busslinger M. The five cleavage-stage (CS) histones of the sea urchin are encoded by a maternally expressed family of replacement histone genes: functional equivalence of the CS H1 and frog H1M (B4) proteins. Mol Cell Biol. 1997;17:1189–1200. doi: 10.1128/mcb.17.3.1189. [DOI] [PMC free article] [PubMed] [Google Scholar]
- Marzluff WF, Sakallah S, Kelkar H. The sea urchin histone gene complement. Dev Biol. 2006;300:308–320. doi: 10.1016/j.ydbio.2006.08.067. [DOI] [PubMed] [Google Scholar]
- Materna SC, Nam J, Davidson EH. High accuracy, high-resolution prevalence measurement for the majority of locally expressed regulatory genes in early sea urchin development. Gene Expr Patterns. 2010;10:177–184. doi: 10.1016/j.gep.2010.04.002. [DOI] [PMC free article] [PubMed] [Google Scholar]
- Mortazavi A, Williams BA, McCue K, Schaeffer L, Wold B. Mapping and quantifying mammalian transcriptomes by RNA-Seq. Nature Methods. 2008;5:621–628. doi: 10.1038/nmeth.1226. [DOI] [PubMed] [Google Scholar]
- Nemer M. Characteristics of the utilization of nucleosides by embryos of Paracentrotus lividus. J Biol Chem. 1962;237:143–149. [PubMed] [Google Scholar]
- Nemer M, Thornton RD, Stuebing EW, Harlow P. Structure, spatial, and temporal expression of two sea urchin metallothionein genes, SpMTB1 and SpMTA. J Biol Chem. 1991;266:6586–6593. [PubMed] [Google Scholar]
- Oliveri P, Tu Q, Davidson EH. Global regulatory logic for specification of an embryonic cell lineage. Proc Natl Acad Sci USA. 2008;105:5955–5962. doi: 10.1073/pnas.0711220105. [DOI] [PMC free article] [PubMed] [Google Scholar]
- Peter IS, Davidson EH. Modularity and design principles in the sea urchin embryo gene regulatory network. FEBS Lett. 2009;583:3948–3958. doi: 10.1016/j.febslet.2009.11.060. [DOI] [PMC free article] [PubMed] [Google Scholar]
- Peter IS, Faure E, Davidson EH. Predictive computation of genomic logic processing functions in embryonic development. Proc Natl Acad Sci USA. 2012;109:16434–16442. doi: 10.1073/pnas.1207852109. [DOI] [PMC free article] [PubMed] [Google Scholar]
- Schoenberg DR, Maquat LE. Regulation of cytoplasmic mRNA decay. Nat Rev Genet. 2012;13:246–259. doi: 10.1038/nrg3160. [DOI] [PMC free article] [PubMed] [Google Scholar]
- Sodergren E, Weinstock GM, Davidson EH, Cameron RA, Gibbs RA, Angerer RC, Angerer LM, Arnone MI, Burgess DR, Burke RD, Coffman JA, Dean M, Elphick MR, Ettensohn CA, Foltz KR, Hamdoun A, Hynes RO, Klein WH, Marzluff W, McClay DR, Morris RL, Mushegian A, Rast JP, Smith LC, Thorndyke MC, Vacquier VD, Wessel GM, Wray G, Zhang L, Elsik CG, Ermolaeva O, Hlavina W, Hofmann G, Kitts P, Landrum MJ, Mackey AJ, Maglott D, Panopoulou G, Poustka AJ, Pruitt K, Sapojnikov V, Song X, Souvorov A, Solovyev V, Wei Z, Whittaker CA, Worley K, Durbin KJ, Shen Y, Fedrigo O, Garfield D, Haygood R, Primus A, Satija R, Severson T, Gonzalez-Garay ML, Jackson AR, Milosavljevic A, Tong M, Killian CE, Livingston BT, Wilt FH, Adams N, Bellé R, Carbonneau S, Cheung R, Cormier P, Cosson B, Croce J, Fernandez-Guerra A, Genevière A-M, Goel M, Kelkar H, Morales J, Mulner-Lorillon O, Robertson AJ, Goldstone JV, Cole B, Epel D, Gold B, Hahn ME, Howard-Ashby ML, Scally M, Stegeman JJ, Allgood EL, Cool J, Judkins KM, McCafferty SS, Musante AM, Obar RA, Rawson AP, Rossetti BJ, Gibbons IR, Hoffman MP, Leone A, Istrail S, Materna SC, Samanta MP, Stolc V, Tongprasit W, Tu Q, Bergeron K-F, Brandhorst BP, Whittle J, Berney K, Bottjer DJ, Calestani C, Peterson K, Chow E, Yuan QA, Elhaik E, Graur D, Reese JT, Bosdet I, Heesun S, Marra MA, Schein J, Anderson MK, Brockton V, Buckley KM, Cohen AH, Fugmann SD, Hibino T, Loza-Coll M, Majeske AJ, Messier C, Nair SV, Pancer Z, Terwilliger DP, Agca C, Arboleda E, Chen N, Churcher AM, Hallböök F, Humphrey GW, Idris MM, Kiyama T, Liang S, Mellott D, Mu X, Murray G, Olinski RP, Raible F, Rowe M, Taylor JS, Tessmar-Raible K, Wang D, Wilson KH, Yaguchi S, Gaasterland T, Galindo BE, Gunaratne HJ, Juliano C, Kinukawa M, Moy GW, Neill AT, Nomura M, Raisch M, Reade A, Roux MM, Song JL, Su Y-H, Townley IK, Voronina E, Wong JL, Amore G, Branno M, Brown ER, Cavalieri V, Duboc V, Duloquin L, Flytzanis C, Gache C, Lapraz F, Lepage T, Locascio A, Martinez P, Matassi G, Matranga V, Range R, Rizzo F, Röttinger E, Beane W, Bradham C, Byrum C, Glenn T, Hussain S, Manning G, Miranda E, Thomason R, Walton K, Wikramanayke A, Wu S-Y, Xu R, Brown CT, Chen L, Gray RF, Lee PY, Nam J, Oliveri P, Smith J, Muzny D, Bell S, Chacko J, Cree A, Curry S, Davis C, Dinh H, Dugan-Rocha S, Fowler J, Gill R, Hamilton C, Hernandez J, Hines S, Hume J, Jackson L, Jolivet A, Kovar C, Lee S, Lewis L, Miner G, Morgan M, Nazareth LV, Okwuonu G, Parker D, Pu L-L, Thorn R, Wright R Sea Urchin Genome Sequencing Consortium. The genome of the sea urchin Strongylocentrotus purpuratus. Science. 2006;314:941–952. doi: 10.1126/science.1133609. [DOI] [PMC free article] [PubMed] [Google Scholar]
- Tomlinson CR, Klein WH. Temporal and spatial transcriptional regulation of the aboral ectoderm-specific Spec genes during sea urchin embryogenesis. Mol Reprod Dev. 1990;25:328–338. doi: 10.1002/mrd.1080250404. [DOI] [PubMed] [Google Scholar]
- Trapnell C, Williams BA, Pertea G, Mortazavi A, Kwan G, van Baren MJ, Salzberg SL, Wold BJ, Pachter L. Transcript assembly and quantification by RNA-Seq reveals unannotated transcripts and isoform switching during cell differentiation. Nat Biotechnol. 2010;28:511–515. doi: 10.1038/nbt.1621. [DOI] [PMC free article] [PubMed] [Google Scholar]
- Tu Q, Cameron RA, Worley KC, Gibbs RA, Davidson EH. Gene structure in the sea urchin Strongylocentrotus purpuratus based on transcriptome analysis. Genome Res. 2012;22:2079–2087. doi: 10.1101/gr.139170.112. [DOI] [PMC free article] [PubMed] [Google Scholar]
- Wickham H. ggplot2: Elegant Graphics for Data Analysis. 1. Springer; New York: 2009. [Google Scholar]
- Wilt FH. The acceleration of ribonucleic acid synthesis in cleaving sea urchin embryos. Dev Biol. 1970;23:444–455. doi: 10.1016/0012-1606(70)90109-0. [DOI] [PubMed] [Google Scholar]
Associated Data
This section collects any data citations, data availability statements, or supplementary materials included in this article.