

Abstract
Hyperpolarized 83Kr has previously been demonstrated to enable MRI contrast that is sensitive to the chemical composition of the surface in a porous model system. Methodological advances have lead to a substantial increase in the 83Kr hyperpolarization and the resulting signal intensity. Using the improved methodology for spin exchange optical pumping of isotopically enriched 83Kr, internal anatomical details of ex vivo rodent lung were resolved with hyperpolarized 83Kr MRI after krypton inhalation. Different 83Kr relaxation times were found between the main bronchi and the parenchymal regions in ex vivo rat lungs. The T1 weighted hyperpolarized 83Kr MRI provided a first demonstration of surface quadrupolar relaxation (SQUARE) pulmonary MRI contrast.
Keywords: 83Kr, Krypton-83, Kr-83 hyperpolarization, Hyperpolarized, Noble gas MRI, Spin polarization, Cryogenic separation, Spin-exchange optical pumping, Nuclear electric quadrupole moment, Quadrupolar relaxation, Surface sensitive contrast, Pre-clinical MRI, Pulmonary MRI, Lung surfactant
1. Introduction
Pulmonary MRI with hyperpolarized (hp) 129Xe [1] and hp 3He [2] are emerging techniques for spatially resolved measurement of lung function that cannot be obtained by alternative non-invasive methods. Both non-radioactive isotopes have a nuclear spin I = 1/2 that can be hyperpolarized through laser-based methods [3,4] to obtain sufficient MRI signal intensity for high resolution imaging of the lung. Various MRI protocols can be used to generate complementary contrast from the two isotopes. For example, because of its high diffusivity, 3He is thus far preferred for contrast relating to changes in alveolar lung structure (i.e. ADC contrast) [5–8]. The 3He spin relaxation is more affected by the presence of paramagnetic O2 in the gas phase than that of any other noble gas isotope and the 3He T1 relaxation can therefore be used for partial pressure measurement of pulmonary oxygen [9–11]. On the other hand, the large chemical shift range of 129Xe leads to distinguishable MR signals between tissue dissolved and gas phase xenon [12] thus enabling the visualization of gas transport through the parenchyma [13]. The isotope 129Xe generally possesses a relatively high solubility, has a relaxation times of T1 = 13 s in oxygenated blood [14], and can be functionalized to serve as a biosensor for certain target molecules [15] with potential applications for pulmonary MRI and beyond. The development of hp pulmonary MRI is therefore not only a quest for higher signal intensity and better spatial resolution but also a pursuit for novel sources of contrast that probe different structural and functional aspects of lungs in health and disease [11,16].
Using a third noble gas isotope, namely 83Kr, longitudinal (T1) relaxation weighted MRI contrast was previously shown to be indicative of the specific surface treatment in a porous model system [17]. Unlike 3He and 129Xe, the 83Kr nucleus possesses a nuclear spin I = 9/2 and thus a non-vanishing electric quadrupole moment that serves as a probe for electric field gradients (EFGs). The EFGs are predominantly generated during brief collision and adsorption events of the noble gas atoms with the surrounding surfaces, resulting in rapid T1 relaxation that is detected in the gas phase. The 83Kr surface quadrupolar relaxation (SQUARE) MRI contrast is affected by the surface to volume ratio (S/V), surface composition, surface temperature, and surface adsorption of molecules [16–18]. On the downside, quadrupolar relaxation also restricts the hp 83Kr signal intensity and applications of hp 83Kr MRI were limited thus far to conceptual studies showing low resolution images [17,19] with little chance to provide data about internal structure or function of the lung.
In recent work, spin exchange optical pumping (SEOP) of a mixture of 5% krypton with 95% N2 achieved a 83Kr spin polarization of P = 26%, corresponding to a 59,000 fold signal increase compared to the thermal equilibrium 83Kr signal at 9.4 T field strength [20]. SEOP at low krypton concentration was used because high krypton density [Kr] adversely affects SEOP but, unfortunately, fast quadrupolar driven 83Kr T1 relaxation in the condensed state generally prevents the cryogenic separation of hp krypton from the gas mixture [21]. The high gas dilution caused a 20 fold reduction of the MRI signal and it is instructional to define the apparent polarization Papp that takes the dilution into account [20]:
| [1] |
where [NG] is the noble gas density (here, krypton) and [Mi] refers to the density of other components in the hp gas mixture (i.e. N2 in this work). The apparent polarization provides a measure of the expected signal from a diluted hp noble gas. The example above (P = 26%) leads to Papp = 1.3% and thus to the same signal of pure krypton gas with P = 1.3% (assuming identical isotopic composition).
As an alternative to dilution, the density [Kr] can be lowered in concentrated krypton mixtures by reducing the SEOP gas pressure [20]. In the current work, this method was modified to extract below ambient pressure hp gas mixture from the SEOP cell followed by compression to ambient pressure for pulmonary imaging. Hp 83Kr produced with this method was utilized to study SQUARE contrast in an excised rat lung.
2. Materials and methods
2.1. 83Kr spin exchange optical pumping.
Spin exchange optical pumping (SEOP) with rubidium produced hp 83Kr via batch mode as described in detail elsewhere [20]. Spin polarization measurements used natural abundance krypton gas (99.995% purity; 11.5% 83Kr; Airgas, Rednor, PA, USA), whereas the MR images presented in this publication utilized enriched 83Kr (99.925% 83Kr, CHEMGAS, Boulogne, France) for improved signal intensity. A 25% krypton–75% N2 (99.999% purity, Air Liquide, Coleshill, UK) mixture was used for SEOP because it was previously proven to lead to high hp 83Kr signal intensities [20] and allowed for economical usage of the expensive isotopically enriched 83Kr gas.
Spin polarization was determined by comparison of the hp gas signal in a single pulse experiment with that from a thermally polarized krypton gas [20]. In baseline polarization measurements the hp gas was transferred by gas expansion directly into a pre-evacuated borosilicate glass cell located in the r.f. detection coil without usage of the extraction unit. Spin polarization measurements were acquired after 8 minutes of SEOP and images were acquired after 12 minutes of SEOP, corresponding to ~ 80% and ~ 92% of the steady state polarization (reached after 18 minutes [20]) respectively, to reduce experimental time.
2.2. HP gas extraction, compression and transfer.
To utilize the enhanced 83Kr spin polarization of below ambient pressure SEOP [20] an extraction unit was designed and built that extracted the hp gas from the SEOP cell and then delivered the gas for pulmonary imaging as shown in Fig. 1. At 90–100 kPa SEOP cell pressure this method produced approximately 35–40 cm3 of hp gas mixture every 12 minutes for lung imaging. Alternatively, in the spin polarization measurements the hp gas was injected into an NMR detection cell to measure the 83Kr spin polarization after the compression process (Fig. 2).
Fig. 1.
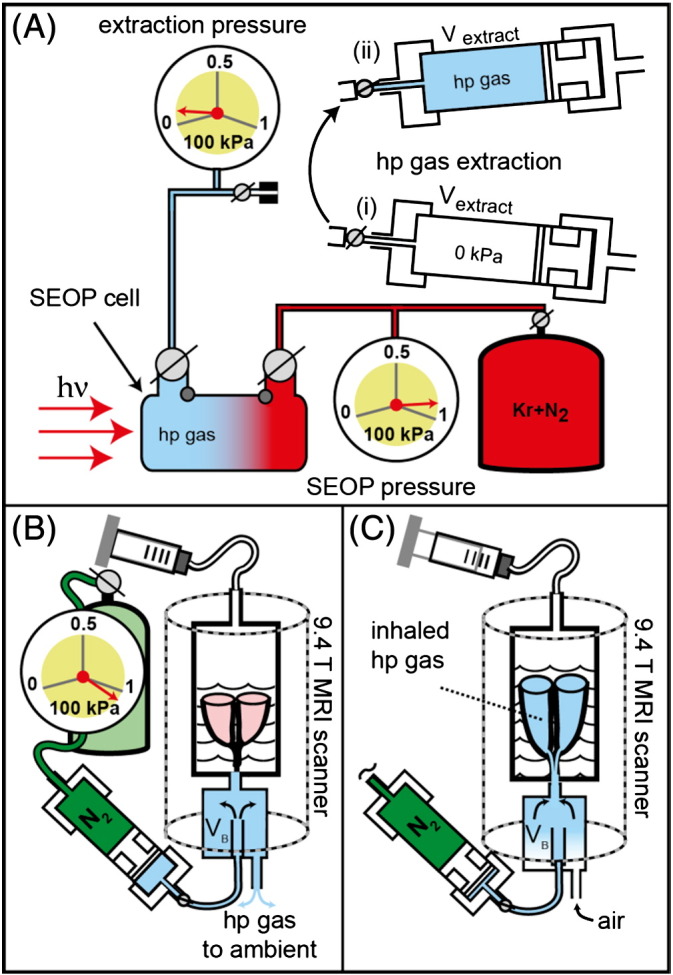
Hp krypton extraction and transfer from the SEOP cell, operating at 90–100 kPa, to the lungs at ambient pressure. (A) A pre-evacuated volume Vextract = 790 cm3 in the extraction unit (i) was filled to approximately 6 kPa during hp gas extraction (ii). (B) The extraction unit was moved to the MRI scanner and the N2 gas operated piston pressurizes the hp gas mixtures to a pressure slightly above ambient. The hp gas was then pushed through connecting tubing into a storage container (VB). The lung was located upside down in glucose solution within the breathing apparatus with the trachea connected to VB. (C) A slight suction on the breathing apparatus (substituting for the pleural cavity) caused the lung to expand and to inhale the hp gas.
Fig. 2.
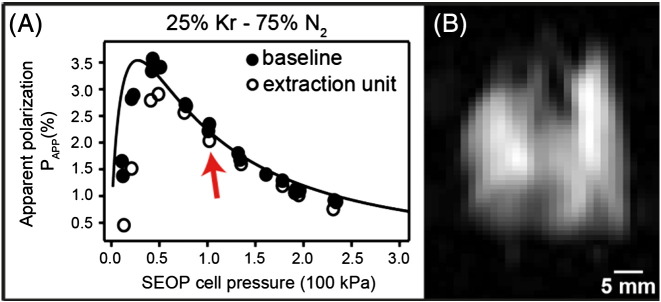
(A) The apparent 83Kr spin polarization Papp as a function of SEOP cell pressure using the extraction unit for compression (open circles) and baseline data without the extraction unit (filled circles). The arrow indicates the pressure used for imaging experiments. Curve fitting was adapted from ref. [20]. (B) Variable flip angle (VFA) FLASH hp 83Kr MRI of an excised rat lungs at 9.4 T without signal averaging (NEX = 1, no slice selection, SNR = 51) using isotopically enriched 83Kr (99.925%).
2.3. HP gas inhalation.
A ventilation chamber with the lung suspended in a 5% glucose solution (weight/volume) (Baxter Healthcare Ltd, Thetford, UK) was placed inside the MR magnet and kept at a constant temperature of 295 K. Active inflation of the lung was achieved by producing a negative pressure above the glucose solution from pulling a ventilation syringe to 10 cm3 as shown in Fig. 1C (see further explanation in ref. [22]). The corresponding inhaled volume of 8 cm3 was measured through exhalation causing water displacement in a water bell.
2.4. MRI protocol
MRI experiments were performed using a vertical bore 9.4 T Bruker Avance III microimaging system (Bruker Corporation, Billerica, Massachusetts, USA). Imaging experiments utilized a Bruker 30 mm double saddle probe tuned to 15.4 MHz corresponding to the resonance frequency of 83Kr gas in the lung. Images were acquired by means of N = 32 phase encoding gradient increments using a variable flip angle (VFA) FLASH protocol (TE = 4.2 ms, TR = 19.2 ms) that reduced the effects of T1 decay; the flip angle of the ith increment (θi) was calculated by [23]. The imaging protocol had a total acquisition time 0.615 s limiting the T1 decay during acquisition.
Coronal images were acquired into 64 × 32 matrices resulting in a field of view (FOV) of 50.9 mm in the longitudinal (frequency encoding) and 40.7 mm in the transverse (phase encoding) directions, respectively. To acquire a non-slice selective image, 0.3 ms rectangular hard pulses of variable power levels were used for excitation. The slice selective images utilize 2 ms sinc-shaped radio frequency pulses of variable power to selectively excite a 3 mm central coronal slice of the lung, resulting in a nominal resolution of 0.80 × 1.27 × 3 mm3. To obtain T1-weighted images and demonstrate SQUARE pulmonary MRI contrast the imaging sequence was started with a programmed time delay (td) of 0.0 s, 0.5 s, 1.0 s or 1.5 s after inhalation. The inhalation itself was accomplished manually by reducing the pressure in the artificial pleural cavity using the ventilation syringe as described in ref. [22]. Slight alternations in the timing (approximately ± 0.2 s) of the manual inhalation procedure were deemed acceptable. Note that the uncertainty in the exact timing of the images can be eliminated by future improved MRI protocols that record multiple images within one inhalation cycle. In this work, each individual image was acquired from a single inhalation cycle and subsequent VFA FLASH acquisition (NEX = 1) with no signal averaging. Slice selective images demonstrating SQUARE MRI contrast (Fig. 3A–D) and the resulting T1 map (Fig. 3E) were acquired using a single animal.
Fig. 3.
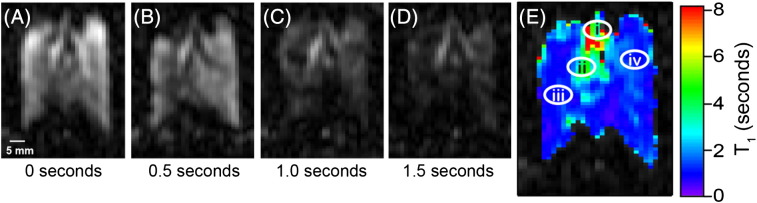
Series of hp 83Kr MR images demonstrating SQUARE contrast. A new delivery of hp 83Kr was provided for each image shown. (A) VFA FLASH MRI as in Fig. 2b but with 3 mm slice selection. (B–D) MR images as in (A) with a relaxation delay, td, between hp gas inhalation and acquisition as indicated in the figure. The major airways are visibly less affected than the alveolar space by increasing td values. (E) Graphical representation of the T1 values calculated from the signal decay in (A – D) for each volume element (voxel). Decay curves for each of the voxels located at positions i–iv in (E) are shown in Fig. 4.
2.5. Image reconstruction and analysis
Images were processed and reconstructed in Prospa (v. 3.06, Magritek, Wellington, New Zealand) by applying a sine-bell squared window function to the raw data before two-dimensional Fourier transformation. The two dimensional image data were exported for further analysis using IGOR Pro (v. 6.01; Wavemetrics, Lake Oswego, OR, USA).
To construct the T1 map shown in Fig. 3E the image data were combined into a three dimensional matrix having two spatial dimensions (the slice selective images) and one time dimension (the delay before acquisition). Linear regression analysis of the natural logarithm of the signal intensity as a function of delay time was used to obtain spatially resolved T1 values in Fig. 3E. Representative data from four selected volume elements in Fig. 3E are shown in Fig. 4. T1 values calculated outside the lung region were composed solely of background noise and were not displayed in Fig. 3E. The final T1 map was overlaid onto the lung image at delay time td = 0 s for clarity of presentation.
Fig. 4.

Semi-logarithmic plots of signal decay as a function of delay time, td, in the excised lung. Data were selected from various anatomical locations as indicated in Fig. 3E: (A) tracheal region (i); (B) major bronchial region (ii); (C) and (D) lung parenchymal regions (iii) and (iv), respectively. Colors are in accordance with Fig. 3E. Linear correlation coefficients, or Pearson's r, and relaxation rates are shown in the annotation for each plot.
2.6. Animal care and preparation
Male Sprague–Dawley rats (350–400 g, Charles River UK Ltd, Margate, UK) were euthanized by overdose of pentobarbital (Sigma-Aldrich Ltd, Gillingham, UK) in accordance with local animal welfare guidelines and the Animals (Scientific Procedures) Act (1986). Immediately after confirmation of death, a catheter was inserted into the caudal vena cava to allow flushing of the pulmonary circulation with 20–30 cm3 heparin 100 IU/cm3 (Wockhardt UK Ltd, Wrexham, UK) in 0.9% saline solution (Baxter Healthcare Ltd, Thetford, UK) followed with phosphate buffer solution (PBS, Sigma-Aldrich Ltd, Gillingham, UK) in order to remove residual blood from the pulmonary circulation.
The heart and lungs were removed en masse. A polytetrafluorethylene (PTFE) adapter tube was inserted 5–10 mm above the carina and sutured into place. The heart and lungs were suspended in 5% glucose solution (weight/volume) with the trachea pointing downwards in a custom-built acrylic ventilation chamber, as detailed in Fig. 1. The ex vivo lungs were repeatedly inflated with 8–10 cm3 of room air to check for leakage either from the suture around the trachea or the lungs themselves. For the presented work the lung harvesting procedure was completed with 100% success of removing the lungs intact. Normally with a skilled operator the ex vivo technique results in over 90% of lungs being suitable for imaging. The lungs were chilled to 278 K for transportation to the imaging facility.
3. Results and discussion
The pure gas phase relaxation time of 83Kr is sufficiently long with T1 times of several minutes at ambient pressure [16] to permit hp gas extraction and transfer. However, as the 83Kr relaxation is accelerated by the presence of surfaces, the contact of the hp gas with any material during this process needs to be minimized. Pumps that have been used for extraction and compression of 3He after metastable exchange optical pumping (MEOP) [24] typically require many compression cycles to transfer the entire hp gas volume [24–27]. For the extraction and compression of the quadrupolar hp 83Kr a pneumatically operated piston within a large volume cylinder was designed that used a single extraction–compression cycle as shown in Fig. 1.
This design is conceptually similar to the gas pressure driven ‘syringe’ using a Teflon piston as applied previously by Rosen et al. [28] for the transfer of hp 129Xe following cryogenic gas separation. However, the extraction unit in this work needed to attain vacuum conditions of less than 0.2 kPa prior to hp gas extraction from the SEOP cell and, following extraction, was required to compress the hp gas to ambient pressure. Therefore, this unit operates at a high pressure differential and an O-ring seal equipped acrylic piston provides gas tight isolation of the two compartments of the extraction unit. The setup allowed for the extraction of about 3/4 of the hp gas from the SEOP cell in a single expansion–compression cycle. The losses in polarization caused by compression, shown in Fig. 2A, were negligible at SEOP pressures above 75 kPa and were still acceptable down to 50 kPa. Using a 25% krypton–75% N2 mixture for a SEOP duration of 8 minutes at a pressure of 50 kPa, the apparent spin polarization Papp = 2.9% was found after extraction and transfer of the hp gas into a sample cell as seen in Fig. 2.
For the MRI, an SEOP cell pressure of 90–100 kPa was used, even though the attained apparent polarization of Papp = 2.0% was only about 2/3 the maximum possible value (Fig 2A, red arrow). The higher SEOP pressure ensured that the quantity of the produced hp gas (i.e. 40 cm3 hp gas at ambient pressure) was sufficient to match the actual inhaled volume and the dead volume in the gas transfer system.
After SEOP with isotopically enriched 83Kr followed by extraction, compression, and delivery of the gas mixture into the (ambient pressure) storage chamber (VB) located underneath the breathing apparatus, 8 cm3 of the hp gas was inhaled by the excised lungs using the breathing apparatus shown in Fig. 1B and C (see also ref. [22]). The signal intensity was sufficient to provide anatomical details, such as the shape of the lung lobes and the distinction of major airways, using a variable flip angle (VFA) FLASH MRI protocol [23] without slice selection but also without signal averaging having SNR = 51 as shown in Fig. 2B. Further experimental details of the MRI protocol, animal usage and SEOP are described in the Materials and methods section.
After the addition of 3 mm slice selection to the VFA FLASH MRI protocol, the major airways could clearly be recognized in a single acquisition (i.e. NEX = 1) as show in Fig. 3A. Furthermore, the obtained signal intensity was sufficient to permit the proof of principle study of 83Kr SQUARE contrast in lungs. Fig. 3B–D shows the same 3 mm slice selective hp 83Kr images as Fig. 3A, but with a delay period td between inhalation and start of the image acquisition ranging from 0.5 s to 1.5 s (td = 0 s in Fig. 3A). A new bolus of hp 83Kr was delivered for each of the images. As a clear trend observed directly in these four images (Fig. 3A–D), the signal originating from the major airways was less affected by the delay time than the rest of the lung. The cause for the slower relaxation was presumably the smaller surface to volume (S/V) ratio in the airways as opposed to the alveolar space.
Smaller airways were not resolved but contribute to the contrast observed in the MR images. Fig. 3E shows a T1 relaxation time map obtained from the td dependent signal decay of each volume element in Fig. 3A–D. The longitudinal relaxation time (averaged over 20 voxel) for the trachea is T1 = 5.3 ± 1.9 s and T1 = 3.0 ± 0.9 s for the main stem bronchus. The averaged relaxation times measured in lung parenchyma adjacent to the major airways and in the periphery of the lung are T1 = 1.1 ± 0.2 s and T1 = 0.9 ± 0.1 s respectively. The signal decays of selected voxel are shown in Fig. 4. The observed T1 data are in reasonable agreement with previous, spatially unresolved bulk measurements of 83Kr T1 relaxation in excised rat lungs that also demonstrated that the addition of up to 40% of O2 did not significantly alter the T1 times [22].
SQUARE originates from surfaces but its effect is detected in the gas phase due to rapid exchange. It is however not known to what depth the alveolar surface, which is comprised of surfactant molecules and proteins, followed by a water layer, cell tissue, and the vascular system (filled with phosphate buffer solution in this work), is probed by the SQUARE effect. The relaxation of the krypton dissolved in extracellular water is too slow, i.e. T1 = 100 ms at 298 K [29], to be a major contributor to the observed T1 values in the alveolar region, given the small quantity of krypton dissolved in extracellular water. SQUARE may therefore originate from a deeper layer (i.e. cell tissue) or may be caused by interactions of the krypton atoms with the outer surfactant layer. The answer to this question could have profound impact on potential usage of SQUARE for disease related contrast but its exploration is beyond the scope of this work.
As Figs. 2 and 3 demonstrate, the extraction technique from low pressure (90–100 kPa) SEOP cells works well, generating reproducibly Papp = 2.0% with a line narrowed laser providing 23.3 W of power incident at the SEOP cell. This resulted in an approximately 10 fold increase in MR signal intensity as compared to the previously published results on hp 83Kr MRI in excised rat lungs [19]. An additional factor of 8.7 improvement in signal to noise ratio was achieved by using isotopically enriched to 99.925% 83Kr gas. Not surprisingly for a spin system with Papp = 2%, the obtained resolution fell short compared to ventilation hp 129Xe MRI. However, the 83Kr signal intensity was strong enough to allow for surface sensitive contrast in excised lungs while retaining structural resolution. The voxel resolution obtained with the slice selective hp 83Kr MRI is 0.80 × 1.27 × 3 mm3, (SNR = 23.8 for td = 0 s) and is therefore similar to dissolved phase 129Xe pulmonary MRI that uses the small fraction (typically 1–2%) of inhaled xenon dissolved in tissue and blood.
The applied laser power of 23.3 W (incident at the SEOP cell) can be increased significantly due to recent advances in solid state laser technology and may thus improve the quantity of the produced hp gas and its spin polarization. Larger volume SEOP cells could be used to produce larger quantities of hp gas volumes at lower pressures if the power density of the laser irradiation is maintained across the larger cross section. Alternatively, the volume of hp gas can also be increased if several SEOP units of the current cell size and laser power operate in parallel. The amount of hp gas needed per inhalation cycle may additionally be reduced by optimizing the ambient pressure storage container (VB), consequently allowing for lower SEOP cell pressures that result in higher spin polarization with the current setup.
A potential drawback of the presented methodology is that the lungs may become contaminated by rubidium vapors during the rapid delivery of hp gas from the SEOP cell. Therefore, the extraction unit was tested at various locations for rubidium residues through pH measurements (ColorpHast). Although more elaborate testing is required, and it appears that most of the rubidium tends to condense in the tubing located before the extraction unit. The use of additional rubidium filters that make use of the high reactivity of the alkali metal may improve the situation further but was not explored.
4. Conclusions
Using improved hp 83Kr production methodology, SQUARE MRI contrast was demonstrated between airways and alveolar regions. Lung pathology related contrast was not attempted as animal models of pulmonary disease were beyond the scope of this proof of concept study. However, the produced signal intensity will be sufficient to attempt disease specific contrast in pathophysiology and to explore whether hp 83Kr is of supplemental diagnostic value to hp 3He and hp 129Xe MRI. The potential usage of hp 83Kr as a novel contrast agent should be investigated for disorders such as emphysema where the lung surface to volume ratio (S/V) is reduced [30,31], or generally for the broad spectrum of diseases which exhibit significant changes in lung surface chemistry, for example acute lung injury (ALI), acute respiratory syndrome (ARDS) [32] and cystic fibrosis (CF) [33]. Two final notes with regard to practicalities of hp 83Kr MRI: (1) Krypton gas (natural abundance of 11.5% 83Kr) is a renewable resource generated as a by-product of air liquefaction, available at approximately €1 per liter (at ambient pressure). Unfortunately, isotopically enriched 83Kr is costly (approximately € 4000/L) at the current low demand for production. (2) There are little toxicological concerns for future clinical applications as krypton is chemically inert and does not exhibit anesthetic properties at ambient gas pressure [34,35].
Acknowledgments
This work was supported in part by the Medical Research Council under Grant No. G0900785 and by the Royal Society through the Paul Instrument Fund.
Footnotes
This is an open-access article distributed under the terms of the Creative Commons Attribution License, which permits unrestricted use, distribution, and reproduction in any medium, provided the original author and source are credited.
References
- 1.Albert M.S., Cates G.D., Driehuys B., Happer W., Saam B., Springer C.S. Biological magnetic-resonance-imaging using Laser Polarized Xe-129. Nature. 1994;370:199–201. doi: 10.1038/370199a0. [DOI] [PubMed] [Google Scholar]
- 2.Middleton H., Black R.D., Saam B., Cates G.D., Cofer G.P., Guenther R. MR-imaging with hyperpolarized He-3 gas. Magn Reson Med. 1995;33:271–275. doi: 10.1002/mrm.1910330219. [DOI] [PubMed] [Google Scholar]
- 3.Raftery D., Long H., Meersmann T., Grandinetti P.J., Reven L., Pines A. High-Field NMR of adsorbed xenon polarized by laser pumping. Phys Rev Lett. 1991;66:584–587. doi: 10.1103/PhysRevLett.66.584. [DOI] [PubMed] [Google Scholar]
- 4.Walker T.G., Happer W. Spin-exchange optical pumping of noble-gas nuclei. Rev Mod Phys. 1997;69:629–642. [Google Scholar]
- 5.Saam B.T., Yablonskiy D.A., Kodibagkar V.D., Leawoods J.C., Gierada D.S., Cooper J.D. MR imaging of diffusion of He-3 gas in healthy and diseased lungs. Magn Reson Med. 2000;44:174–179. doi: 10.1002/1522-2594(200008)44:2<174::aid-mrm2>3.0.co;2-4. [DOI] [PubMed] [Google Scholar]
- 6.Salerno M., de Lange E.E., Altes T.A., Truwit J.D., Brookeman J.R., Mugler J.P. Emphysema: hyperpolarized helium 3 diffusion MR imaging of the lungs compared with spirometric indexes – initial experience. Radiology. 2002;222:252–260. doi: 10.1148/radiol.2221001834. [DOI] [PubMed] [Google Scholar]
- 7.Sukstanskii A.L., Conradi M.S., Yablonskiy D.A. He-3 lung morphometry technique: accuracy analysis and pulse sequence optimization. J Magn Reson. 2010;207:234–241. doi: 10.1016/j.jmr.2010.09.005. [DOI] [PMC free article] [PubMed] [Google Scholar]
- 8.Parra-Robles J., Ajraoui S., Deppe M.H., Parnell S.R., Wild J.M. Experimental investigation and numerical simulation of (3)He gas diffusion in simple geometries: implications for analytical models of (3)He MR lung morphometry. J Magn Reson. 2010;204:228–238. doi: 10.1016/j.jmr.2010.02.023. [DOI] [PubMed] [Google Scholar]
- 9.Deninger A.J., Eberle B., Ebert M., Grossmann T., Hanisch G., Heil W. He-3-MRI-based measurements of intrapulmonary p(O2) and its time course during apnea in healthy volunteers: first results, reproducibility, and technical limitations. NMR Biomed. 2000;13:194–201. doi: 10.1002/1099-1492(200006)13:4<194::aid-nbm643>3.0.co;2-d. [DOI] [PubMed] [Google Scholar]
- 10.Fischer M.C., Spector Z.Z., Ishii M., Yu J., Emami K., Itkin M. Single-acquisition sequence for the measurement of oxygen partial pressure by hyperpolarized gas MRI. Magn Reson Med. 2004;52:766–773. doi: 10.1002/mrm.20239. [DOI] [PubMed] [Google Scholar]
- 11.Santyr G.E., Lam W.W., Parra-Robles J.M., Taves T.M., Ouriadov A.V. Hyperpolarized noble gas magnetic resonance imaging of the animal lung: approaches and applications. J Appl Phys. 2009;105:102004. [Google Scholar]
- 12.Mugler J.P., Altes T.A., Ruset I.C., Dregely I.M., Mata J.F., Miller G.W. Simultaneous magnetic resonance imaging of ventilation distribution and gas uptake in the human lung using hyperpolarized xenon-129. Proc Natl Acad Sci U S A. 2010;107:21707–21712. doi: 10.1073/pnas.1011912107. [DOI] [PMC free article] [PubMed] [Google Scholar]
- 13.Driehuys B., Cofer G.P., Pollaro J., Mackel J.B., Hedlund L.W., Johnson G.A. Imaging alveolar-capillary gas transfer using hyperpolarized Xe-129 MRI. Proc Natl Acad Sci U S A. 2006;103:18278–18283. doi: 10.1073/pnas.0608458103. [DOI] [PMC free article] [PubMed] [Google Scholar]
- 14.Albert M.S., Balamore D., Kacher D.F., Venkatesh A.K., Jolesz F.A. Hyperpolarized Xe-129 T-1 in oxygenated and deoxygenated blood. NMR Biomed. 2000;13:407–414. doi: 10.1002/1099-1492(200011)13:7<407::aid-nbm661>3.0.co;2-1. [DOI] [PubMed] [Google Scholar]
- 15.Spence M.M., Rubin S.M., Dimitrov I.E., Ruiz E.J., Wemmer D.E., Pines A. Functionalized xenon as a biosensor. Proc Natl Acad Sci U S A. 2001;98:10654–10657. doi: 10.1073/pnas.191368398. [DOI] [PMC free article] [PubMed] [Google Scholar]
- 16.Lilburn D.M.L., Pavlovskaya G.E., Meersmann T. Perspectives of hyperpolarized noble gas MRI beyond 3He. J Magn Reson. 2013;229:173–186. doi: 10.1016/j.jmr.2012.11.014. [DOI] [PMC free article] [PubMed] [Google Scholar]
- 17.Pavlovskaya G.E., Cleveland Z.I., Stupic K.F., Meersmann T. Hyperpolarized krypton-83 as a new contrast agent for magnetic resonance imaging. Proc Natl Acad Sci U S A. 2005;102:18275–18279. doi: 10.1073/pnas.0509419102. [DOI] [PMC free article] [PubMed] [Google Scholar]
- 18.Cleveland Z.I., Stupic K.F., Pavlovskaya G.E., Repine J.E., Wooten J.B., Meersmann T. Hyperpolarized 83Kr and 129Xe NMR relaxation measurements of hydrated surfaces: implications for materials science and pulmonary diagnostics. J Am Chem Soc. 2007;129:1784–1792. doi: 10.1021/ja065994t. [DOI] [PubMed] [Google Scholar]
- 19.Cleveland Z.I., Pavlovskaya G.E., Elkins N.D., Stupic K.F., Repine J.E., Meersmann T. Hyperpolarized Kr-83 MRI of lungs. J Magn Reson. 2008;195:232–237. doi: 10.1016/j.jmr.2008.09.020. [DOI] [PubMed] [Google Scholar]
- 20.Six J.S., Hughes-Riley T., Stupic K.F., Pavlovskaya G.E., Meersmann T. Pathway to cryogen free production of hyperpolarized krypton-83 and xenon-129. PLoS One. 2012;7:e49927. doi: 10.1371/journal.pone.0049927. [DOI] [PMC free article] [PubMed] [Google Scholar]
- 21.Cowgill D.F., Norberg R.E. Spin–lattice relaxation and chemical-shift of Kr-83 in solid and liquid krypton. Phys Rev B. 1973;8:4966–4974. [Google Scholar]
- 22.Stupic K.F., Elkins N.D., Pavlovskaya G.E., Repine J.E., Meersmann T. Effects of pulmonary inhalation on hyperpolarized krypton-83 magnetic resonance T-1 relaxation. Phys Med Biol. 2011;56:3731–3748. doi: 10.1088/0031-9155/56/13/001. [DOI] [PMC free article] [PubMed] [Google Scholar]
- 23.Zhao L., Mulkern R., Tseng C.H., Williamson D., Patz S., Kraft R. Gradient-echo imaging considerations for hyperpolarized Xe-129 MR. J Magn Reson Ser B. 1996;113:179–183. [PubMed] [Google Scholar]
- 24.Timsit R.S., Daniels J.M., Dennig E.I., Kiang A.K.C., May A.D. An experiment to compress polarized 3He gas. Can J Physiol. 1971;49:508–516. [Google Scholar]
- 25.Becker J., Heil W., Krug B., Leduc M., Meyerhoff M., Nacher P.J. Study of mechanical compression of spin-polarized He-3 gas. Nucl Instrum Methods Phys Res Sect A-Accel Spectrom Dect Assoc Equip. 1994;346:45–51. [Google Scholar]
- 26.Gentile T.R., Jones G.L., Thompson A.K., Rizi R.R., Roberts D.A., Dimitrov I.E. Demonstration of a compact compressor for application of metastability-exchange optical pumping of He-3 to human lung imaging. Magn Reson Med. 2000;43:290–294. doi: 10.1002/(sici)1522-2594(200002)43:2<290::aid-mrm17>3.0.co;2-a. [DOI] [PubMed] [Google Scholar]
- 27.Imai H., Fukutomi J., Kimura A., Fujiwara H. Effect of reduced pressure on the polarization of Xe-129 in the production of hyperpolarized Xe-129 gas: development of a simple continuous flow mode hyperpolarizing system working at pressures as low as 0.15 atm. Concepts Magn Reson B. 2008;33B:192–200. [Google Scholar]
- 28.Rosen M.S., Chupp T.E., Coulter K.P., Welsh R.C., Swanson S.D. Polarized Xe-129 optical pumping/spin exchange and delivery system for magnetic resonance spectroscopy and imaging studies. Rev Sci Instrum. 1999;70:1546–1552. [Google Scholar]
- 29.Mazitov R.K., Enikeev K.M., Ilyasov A.V. Magnetic-Resonance and Relaxation of Nuclei of Atomic Krypton in Liquid Solutions. Zeitschrift Fur Physikalische Chemie Neue Folge. 1987;155:55–68. [Google Scholar]
- 30.Thurlbeck W.M. Internal surface area and other measurements in emphysema. Thorax. 1967;22:483–496. doi: 10.1136/thx.22.6.483. [DOI] [PMC free article] [PubMed] [Google Scholar]
- 31.Massaro G.D., Massaro D. Retinoic acid treatment abrogates elastase-induced pulmonary emphysema in rats. Nat Med. 1997;3:675–677. doi: 10.1038/nm0697-675. [DOI] [PubMed] [Google Scholar]
- 32.Gunther A., Siebert C., Schmidt R., Ziegler S., Grimminger F., Yabut M. Surfactant alterations in severe pneumonia, acute respiratory distress syndrome, and cardiogenic lung edema. Am J Respir Crit Care Med. 1996;153:176–184. doi: 10.1164/ajrccm.153.1.8542113. [DOI] [PubMed] [Google Scholar]
- 33.Smith J.J., Travis S.M., Greenberg E.P., Welsh M.J. Cystic fibrosis airway epithelia fail to kill bacteria because of abnormal airway surface fluid. Cell. 1996;85:229–236. doi: 10.1016/s0092-8674(00)81099-5. [DOI] [PubMed] [Google Scholar]
- 34.Cullen S.C., Gross E.G. The anesthetic properties of xenon in animals and human beings, with additional observations on krypton. Science. 1951;113:580–582. doi: 10.1126/science.113.2942.580. [DOI] [PubMed] [Google Scholar]
- 35.Hachulla A.-L., Pontana F.-O., Wemeau-Stervinou L., Khung S., Faivre J.-B., Wallaert B. Krypton ventilation imaging using dual-energy CT in chronic obstructive pulmonary disease patients: initial experience. Radiology. 2012;263:253–259. doi: 10.1148/radiol.12111211. [DOI] [PubMed] [Google Scholar]