Abstract
Tip-driven growth processes underlie the development of many plants. To date, tip-driven growth processes have been modeled as an elongating path or series of segments, without taking into account lateral expansion during elongation. Instead, models of growth often introduce an explicit thickness by expanding the area around the completed elongated path. Modeling expansion in this way can lead to contradictions in the physical plausibility of the resulting surface and to uncertainty about how the object reached certain regions of space. Here, we introduce fiber walks as a self-avoiding random walk model for tip-driven growth processes that includes lateral expansion. In 2D, the fiber walk takes place on a square lattice and the space occupied by the fiber is modeled as a lateral contraction of the lattice. This contraction influences the possible subsequent steps of the fiber walk. The boundary of the area consumed by the contraction is derived as the dual of the lattice faces adjacent to the fiber. We show that fiber walks generate fibers that have well-defined curvatures, and thus enable the identification of the process underlying the occupancy of physical space. Hence, fiber walks provide a base from which to model both the extension and expansion of physical biological objects with finite thickness.
Introduction
The growth and development of biological organisms involves processes at multiple scales, including regulation of the timing and location of specific developmental programs. Despite their structural complexity, many prototypical processes involved in development have been identified. One such process is the notion of tip-driven growth in plants [1] that leads to the successive elongation of plant branches or roots below ground. Plant growth also involves the process of expansion, e.g., the thickening of plant roots. The result of such developmental programs in plants are extended and thickened structures, e.g., complex roots and crowns. A number of models have been proposed to examine the growth of extended structures. These vary in complexity. For example, perhaps the simplest, from a parameterization perspective, is the self-avoiding random walk (SAW) [2], [3]. A SAW is a sequence of steps along the line segments of grid edges that connect the locations of crossing grid-lines vertices. Such a grid is a square lattice in  and the SAW satisfies the constraint that no vertex is visited twice and all walks are equally likely.
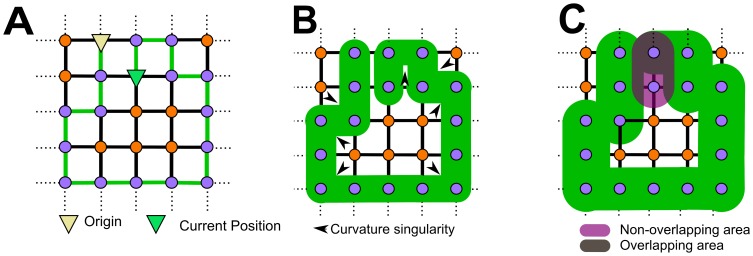
In SAWs and derived models, the elongation and expansion steps are decoupled. The consequences of such decoupling is that the resulting shape may be non-physical. In Fig. 1 we show a SAW thickened to  and
and  of an edge length. In both cases, the SAW can be associated with a boundary which is exactly the expansion distance away from any point along the edges in the SAW. The derived boundary has singular points. Singular points are associated with vanished curvature, which are problematic from both geometric and biophysical perspectives. Next, in the case of an expansion exceeding
  of the edge length, the walk may intersect with itself, thus the resulting boundary is not a manifold, because no location can be occupied by two boundary points. Hence, decoupling elongation and growth raises the possibility of models generating an elongated object that is feasible only in the limit of infinitesimal spatial expansion. This violation of the manifold property leads often to difficulties in current reconstruction practice from random walks [4], [5] and discrete samples in general [6], [7].
Figure 1. Example of contradictions arising from decoupling elongation and expansion of a SAW.
(A) SAW of 16 steps beginning at the origin (yellow triangle) with current position marked via the green triangle. (B) Thickened SAW - note the curvature singularity of the resulting surface. (C) SAW thickened by  of an edge length - multiple regions in space are “associated” with different steps, leading to an identifiability problem, which holds for all thickening greater than or equal to
  of an edge length.
Inspired by the growth of the taproot in plants in particular and by growth processes in biology in general, we introduce here the fiber walk: a SAW model that includes a notion of lateral expansion of the path. We consider the simplest case of a randomly growing line that thickens while elongating into a random direction. We examine the fiber walk in 2D and 3D, and note that although plant roots self-evidently grow in 3D, a number of experimental studies restrict root growth to 2D or quasi-2D (e.g., [8]). Intuitively, a lattice defines a space in which the fiber walk grows a fiber along the edges of the lattice. The interaction of the fiber walk with the lattice is two-fold: 1) the elongation of the walk is achieved by stepping to unvisited adjacent vertices on the lattice, and 2) the spatial expansion is accomplished by contracting certain unvisited vertices adjacent to a visited vertex from the side. In comparison to the ordinary SAW, our new contraction allows us to define a discrete approximation of the area that is reserved for the fiber to expand. Such an expansion implies a boundary, which is a curve in 2D or a surface in 3D defining an area that gives insight into regions of the lattice where no elongation and/or expansion can occur. Such inaccessible regions are caused by self-avoidance that results from the elongation and expansion of the growing object. As we will demonstrate, the fiber walk resolves the contradictions of decoupled growth models while creating a base for future studies of the relationship between growth and form.
Method
Overview
We introduce the formal notion of the fiber in  dimensions, whose process is a walk over the edges of a lattice. First we introduce the lattice as a graph consisting of vertices connected by edges. Secondly, we define the fiber as a subset of all possible graphs on the a lattice whose vertices have at most two incident edges. The fiber is characterized by the presence of a stopping configuration on the lattice that we define. After introducing the two basic notions of lattice and fiber walk, we define fiber walks as the process that creates the fiber as sequence of steps along lattice edges. The interaction between the fiber walk and the lattice extends the class of SAWs. The extension adds the local contraction of the lattice around the last reached position, which in turn is the space consuming expansion of the fiber walk. We illustrate the notions with 2D examples.
The lattice
A lattice in  , on which the fiber walk grows a fiber, is a graph
  of infinite size consisting of a set of vertices
  and a set of edges
  . Such a lattice is derived by taking the graph Cartesian product of
  one-dimensional lattices at infinite length in
  , where
  denotes the dimension of the targeted lattice [9]. Beside the notion of dimension, we define an embedding for the lattice by assigning unit edge length to every edge of the lattice. A position is assigned to every vertex, such that the vertex positions are denoted as
  -tuples in
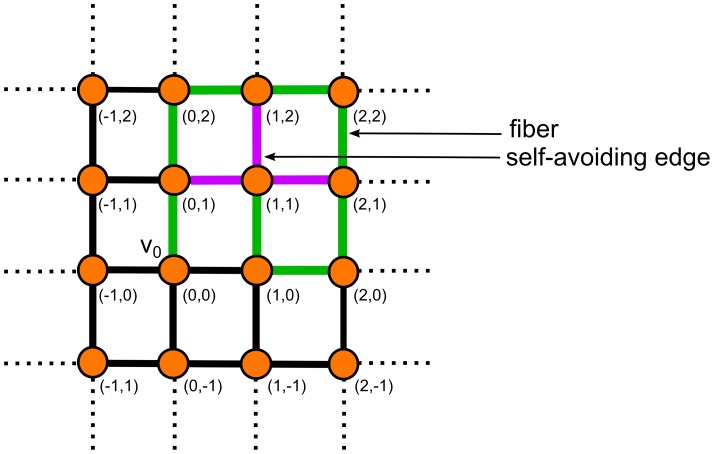
  (see Fig. 2). The assignment of positions to each vertex will enable us later to define contractible edges.
Figure 2. A growing fiber (green) and its self-avoiding edges (purple).
The example shows a fiber on a lattice as defined in Def. 1 and the vertex positions are assigned to each vertex.
Definition 1
Let
 be a lattice in
 . Fix
. Fix
 as the origin and assign unit length to all edges, then the position of each vertex is the
 -tuple associated with
 .
.
The fiber
We aim at defining the fiber as a non-branching and loop free graph  consisting of set of vertices
  and a set of edges
  [10], growing on an infinite lattice whose vertices are enumerated in
  . The fiber starts at a chosen vertex, the so-called origin. We start with a narrow definition of a directed path graph, excluding the trivial case of an ‘empty’ path containing no edges. Furthermore, we restrict ourselves in the context of this paper to only one fiber on the lattice.
Definition 2
Let
 be a graph with
 vertices, such that exactly two vertices have one incident edge and
 vertices have exactly 2 incident edges. Fix
 and
and
 to be the vertices with one incident edge. Such a graph is called a directed path graph. Also it is said to be directed by the sequence

In the following two definitions we introduce the fiber as a subset of possible directed path graphs. First we define self-avoiding edges to limit ourself to cycle-free directed path graphs and as a measurable characteristic of self-avoidance of the walk. Secondly, we use self-avoiding edges to obtain a stopping criteria of the fiber.
Definition 3
Let
 be a lattice and
 be a directed path graph on
 . An edge e belonging to the edge set of L is associated with two vertices belonging to the vertex set of
 , is called a self-avoiding edge if
 is not in the edge set of
 .
.
Given self-avoiding edges we can define the stopping configuration of a fiber as a vertex that is only incident to self-avoiding edges.
Definition 4
Let
 be a lattice. Any directed path graph
 is called a fiber if and only if all
 are distinct. A fiber is said to be stopped if and only if all incident edges of
 are self-avoiding edges.
The fiber walk
In the following we describe the process that constructs the fiber. The process of constructing a fiber is called a fiber walk. The fiber walk is a sequence of steps, each from a vertex  to an adjacent vertex
  via an edge, that is taken by an equally random choice of all incident edges to
  to reach
  . Consequently, at the newly reached vertex
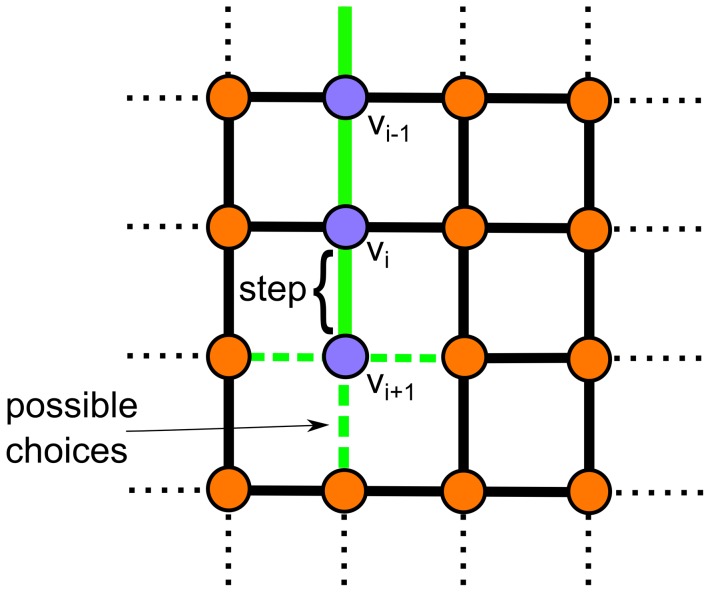
  a new random choice is executed. The choice is taken under the constraint that the newly chosen edge does not connect to a previously visited vertex. The excluded choices prevent the fiber walk from walking back on itself and forming loops. The process is depicted in Fig. 3.
Figure 3. Random choice of a follow up step.
A step (green) shown on a 2D lattice. The possible follow-up steps are represented as a dotted line.
Definition 5
Let
 be a vertex that belongs to a fiber with at least 2 vertices in its vertex set. One step from a vertex
 to a vertex
 along an edge of a lattice is the equal random choice among edges incident to
 that are not incident to any
 .
.
Def. 4–5 are equivalent to the notion of a growing self-avoiding random walk (Fig. 3) on a lattice [11]. It is sufficient for our purpose to investigate the growing SAW, because its configurations are possible configurations of the traditional SAW used to study the excluded volume effect.
Fiber walk contraction of the lattice
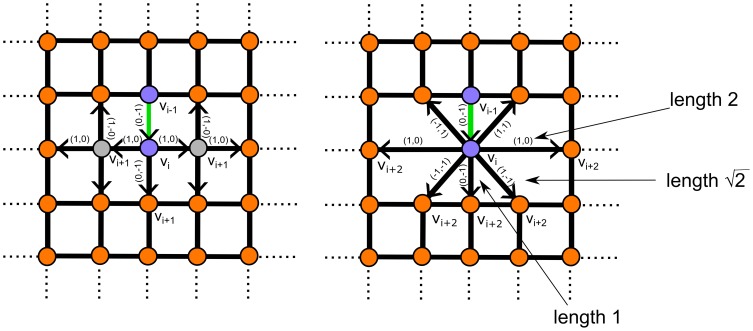
In our fiber walk each elongation step causes a contraction on the lattice, which is a prerequisite to reconstruct the expanded boundary locally at each time step. The contraction of the lattice at each step is performed as a set of merges between vertices adjacent to the last reached vertex on the lattice. A merge is the union of two adjacent vertices  and
and  , where
  inherits all edges of
  . A complete contraction at
  is given as a set of merging operations driven by an edge labeling. We first define the merging operation of two vertices. We denote the merge between two vertices as
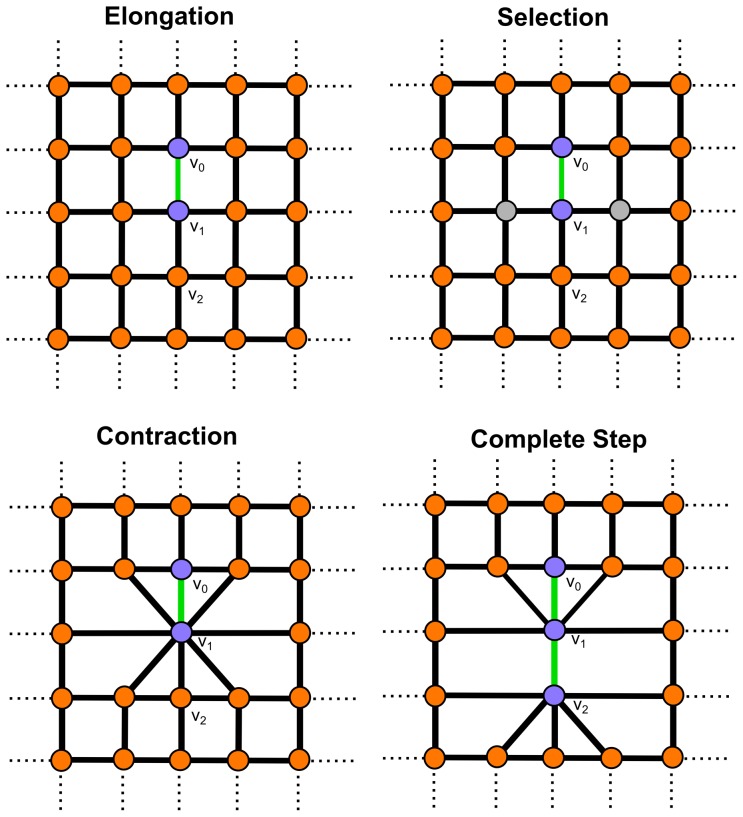
  . The process is depicted in Fig. 4.
Figure 4. Fiber walk on a 2D lattice.
Elongation occurs as the first step which is chosen randomly between the edges incident to the origin  (compare Fig. 3). Here the chosen edge to reach
  is shown in green. Selection of vertices incident to the walk from the side correspond to the expansion. The vertices selected to be merged with
  are shown in grey. Contraction of the selected vertices and its result after merging the selected vertices to
  . Another step, including elongation and expansion, is shown as a second step on the lattice. The second step reaching
  uses the same color schema as before.
Definition 6
Let
 be the last vertex reached on the lattice of a fiber walk and let
 be a vertex connected by a non-self-avoiding edge
 to
to
 . The merge
 results in
 inheriting all edges incident to
 except for
 , which is discarded.
Each merge is said to cause a new edge to exist on the lattice, because two previously distant vertices are newly adjacent after each merge. Therefore, a number of merges are associated with each edge.
In the following we define an initial edge labeling based on the vertex positions introduced in Def. 1. After that we give the mechanism to recalculate labels after each contraction step.
Definition 7
Let
 and
and
 be two vertices on a lattice with positions
 and
and
 and let both vertices be connected by an edge. The edge connecting
 and
and
 is said to be bi-directed with labels
 denoting the direction of the edge between
 and
and
 and
and
 denoting the direction of the edge between
 and
and
 .
.
For example, the labels for all 3D-directions are:  ,
,  ,
,  . The labels of edges incident to a vertex of a lattice contain only entries of −1,0 and 1, because we initially assigned unit length to all edges. The characteristic of the bidirectional labeling is that a vertex
  has an outgoing edge to all adjacent vertices
  and an incoming edge from each
  to
to  .
.
The recalculation of the labels considers the merge of two vertices  and is denoted as
 . Let
. Let  be the label belonging to the edge
  connecting
  to
to  . Let the label
  belong to an edge
  incident to
  . The label of a newly created edge is then calculated for each entry
  in the Cartesian
  -tuple of the label, such that:
| (1) |
| (2) |
| (3) |
Equations 1–3 assure that the entries of the direction labels are always −1,0 or 1. For example, if  and
and  , then
  .
.
We identify edges for contraction by an entry in the  -tuple of their associated labels. The selection of edges to contract is given by two rules: A contraction is performed as a set of merging operations with vertices having an incident outgoing edge
  to
to  , iff:
 is an outgoing edge of
  , that differs in its label in more than one value with the last incoming edge to
  added to the fiber.
 is not a self-avoiding edge
Edges selected for contraction, are said to be incident from the side and reflect the directions of lateral expansion. In practice, we select all edges that do not have an entry in their edge label that indicates a movement opposite to the current growth direction and is different from the elongation step taken in the current growth direction. Recall that edges belonging to the edge set of the fiber are self-avoiding edges.
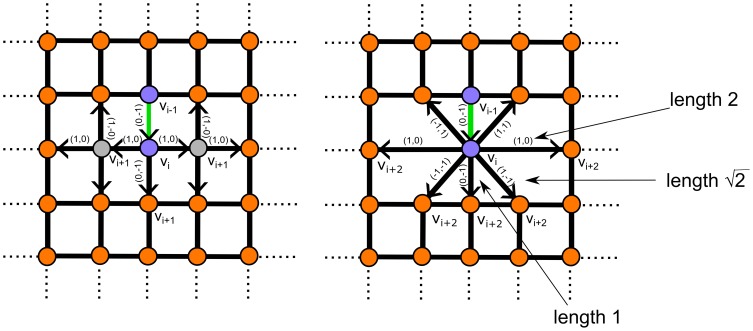
The contraction results in edges of different lengths in the edge set of the fiber and of self-avoiding edges. In the following we show that a fiber has three edge length classes and self-avoiding edges have five edge length classes in 2D by investigating the edge set of the lattice, but the proofing scheme applies to higher dimensions as well. We make use of two prerequisites; first we consider two cases of merging results: (1) merges not resulting in self-avoiding edges (Fig. 5) and (2) merges resulting in self-avoiding edges (Fig. 6). Both cases are distinguishable, because from Def. 6 it follows that a contracted edge on the lattice has one vertex in the vertex set of the fiber and one vertex exclusively in the vertex set of the lattice. Secondly, we will distinguish between edges with identical edge label that add up their length if their common vertex is merged and edges with distinct edge label, whose resulting edge length is calculated by the Pythagorean theorem. The edge length calculation follows from the definition of the lattice in Def. 1 and the definition of the edge labels Def. 7.
Figure 5. The lattice contraction of the fiber walk.
Left: The fiber (green) on a lattice and its edges selected for contraction. Right: The contracted edges which are possible follow up steps of length 1, and 2. In both figures the edge labels involved in the contraction and their direction, indicated as arrows are shown.
Figure 6. Edge length classes of the fiber walk.
Case 2a shows a self-avoiding edge (purple) of length  and Case 2b shows a self-avoiding edge of length 3. The fiber on a lattice is colored green and its edges selected for contraction are shown in grey. The dotted green line denotes an unknown fiber walk that is not affecting the given configuration. In both figures the edge labels involved in the contraction and their direction indicated as arrows are shown.
Theorem 1
The edge set of the fiber has three edge length classes.
Proof 1
Let
 be the last vertex reached by the fiber on the lattice and
 be the previously reached vertex on the lattice connected by the edge
 with label
 . Furthermore, let
 be the set of vertices incident to
 and
and
 be the set of vertices reachable after contraction via
 with corresponding labels
 .
.
 is performed if
 , from which follows, that
if
 no merge is performed,
  with unit length of 1.
If
 and
and
 ,
,  has length
 .
.
If
 and
and
 , then
 has length
 .
.
Proof 1 exhausts all combinations of the introduced prerequisites. It is trivial, that each of the three edge length classes of the fiber are possible edge length classes of self-avoiding edges, because the fiber walk has a non-contracting edge that can connect to each of the edge length classes of the fiber and to the fiber directly. This occurs if  belongs to the vertex set of the fiber and no merge is performed. The edge length is therefore 1,2 or
  . The edge length classes of the fiber were shown as possible follow up steps. The follow-up step itself is a random choice and therefore only one of the possible follow-up steps are chosen. Hence, the edge length classes also apply to non-self-avoiding edges incident to the walk, which may become self-avoiding. In the following we use the edge length classes of Proof 1 as a starting point to exhaust all possible 2D cases of self-avoiding edge lengths.
Theorem 2
Self-avoiding edges have five edge length classes.
Proof 2
Let
 be the last vertex reached by the fiber on the lattice and
 be the previously reached vertex on the lattice connected by the edge
 with label
 . Furthermore, let
 be the set of vertices incident to
 and
and
 be the set of vertices reachable after contraction via
 with label
 . We consider the cases of a self-avoiding edge to be formed by
 from the configuration of
 having a vertex
 incident to
 that belongs to the vertex set of the fiber.
If
 has length
 and
and
 it follows that
 has length
 .
.
If
 has length
 and
and
 it follows that
 is of length
 .
.
If
 has length
 and
and
 it follows that
  is of length
 .
.
If
 has length 1 and
 , it follows that
 is of length
 .
.
If
 has length 1 and
 , it follows that
 is of length
 .
.
The expansion of the fiber walk boundary
In the following we note that a face is bounded by edges that connect vertices. Our central interest is to define the spatial expansion of the fiber walk as represented by a boundary. We introduce the fiber walk boundary for simplicity in 2D, but the principle extends naturally to higher dimensions. Based on Def. 3, we can distinguish three kinds of faces, which share an edge or a vertex with the walk: 1.) self-avoiding faces, whose bounding edge set contains only edges that are self-avoiding or belonging to the fiber walk, 2.) non-self-avoiding faces, having no self-avoidend edges in their bounding edge set or belong to the fiber walk and 3.) mixed faces, bounded by edges that are self-avoiding, not self-avoiding or belonging to the fiber walk.
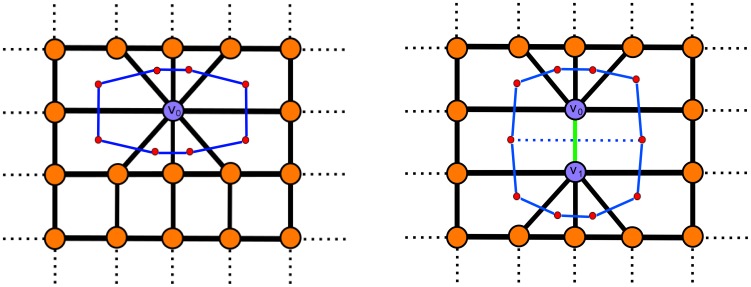
We first introduce the basic definition of the boundary by assuming that no self-avoiding edges are present on the lattice. In a second step we will extend this notion to self-avoiding edges. Fig. 7 shows the derived boundary of the fiber walk on the minimal example given before in Fig. 4.
Figure 7. The fiber walk boundary.
The boundary (blue) of the fiber walk is derived from the face dual of the lattice (red) in 2D. The shown configuration corresponds to the example given in Fig. 4. Here, dotted line segments denote non-unique edges, which do not belong to the boundary.
Definition 8
Let
 be a lattice, then the dual lattice
 of
of
 has vertices
 each of which corresponds to a face of
 and each of whose faces corresponds to a vertex of
 . Each vertex
 is connected via an edge to the vertex
 if the corresponding faces of
 are adjacent.
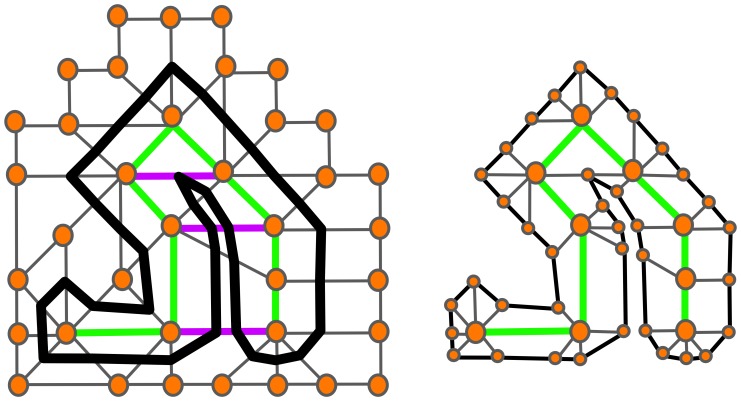
As a final component of our setting we extend Def. 8 to achieve validity in the presence of self-avoiding edges based on an intermediate lattice. The intermediate lattice defines the faces adjacent to the walk by placing vertices at a certain fraction of the edge length of incident edges to the walk. This essential definition, as we see later on, is depicted in Fig. 8.
Figure 8. Recovering the surface.
(left) The original lattice with grey edges and orange vertices. The walk is shown in green and self-avoidend edges are shown in purple. The black line denotes the half-edge length of edges incident to the walk. (right) The intermediate lattice consisting of the black half edge line and the grey edges incident to the green walk. Small orange vertices are placed at half-edge distance while the bigger orange vertices are the original vertices belonging to the walk.
Definition 9
Let
 be a lattice and
 be a fiber on the lattice. Additionally, let
 be the set of lattice edges
 incident to the walk and belonging to the same face and
 be the number of contractions causing
 to exist. The intermediate lattice has vertices at maximal distance
 along
along
 .
.
Def. 9 defines a maximal distance to compensate for self-avoiding edges of length  and 3, that are the result of two merges; here the compensation is defined in terms of
  . Without this compensation the fiber would expand at previously reached locations whenever a self-avoiding edge of length
  and 3 is formed. These two self-avoiding edge length classes result in a distance between the fiber boundary, which is less than needed for a fiber to grow in-between and expand.
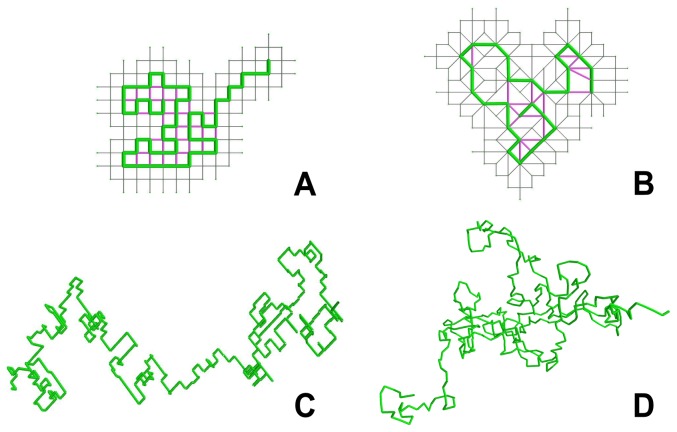
Def. 9 refines the lattice such that Def. 8 applies to all faces incident to the fiber. We finalize this section with actual computations of the introduced fiber walk in 2D and 3D (Fig. 9). An example of a computed SAW and the fiber walk in 2D and 3D is given in Fig. 9. Fig. 9 (a) and (b) show a SAW on a lattice including the self-avoiding edges. In comparison, Fig. 9 (c) and (d) show a fiber walk and the lattice resulting from the contraction. We note that analysis of transient dynamics involve the following caveat: direct comparisons of time-steps (and corresponding statistics) with and without self-avoidance may depend on details of the growth process.
Figure 9. Computed comparison of SAW and fiber walk.
(A) A growing SAW in 2D and (B) a Fiber Walk in 2D. All walk edges are colored in green, the lattice is shown in (grey) and the self avoiding edges are colored in purple for all images. (C) A growing SAW in 2D and (D) a fiber walk 3D.
Results
Fiber boundary does not have curvature singularities
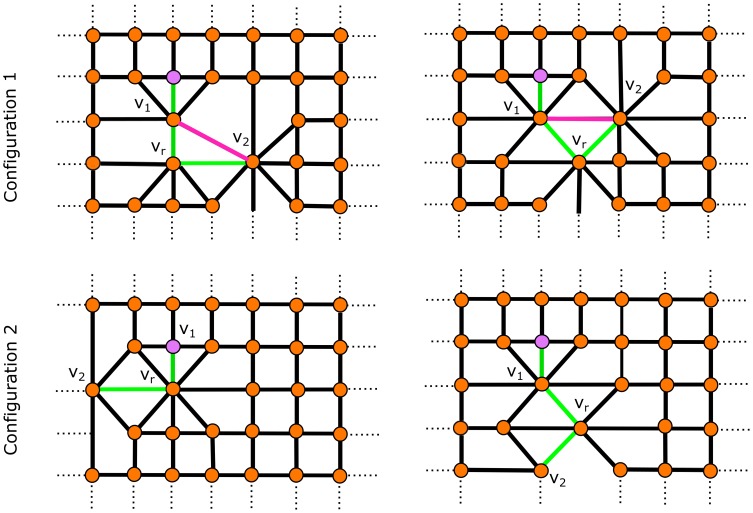
In the introduction we gave 2D examples of singularities on the boundary if only the symmetric expansion around the vertices of the walk is considered. It is trivial to observe that each vertex contributes to the boundary wherever a vertex of the fiber has an incident edge belonging to the edge set of the lattice. On an uncontracted lattice, a vertex does not contribute to the boundary on both sides of the walk at locations where the walk turns  . We compare here the case of a right angle turn for the fiber walk to demonstrate the influence of the intermediate lattice. Fig. 10 shows the four possible local configurations of a fiber walk that cause a right angle in 2D. We can distinguish two configurations of right angles within the four cases: configurations containing self-avoiding edges, and configurations containing no self-avoiding edges.
Figure 10. Avoiding right angles.
The four cases of right angle configurations of the fiber walk. Configuration 1 shows possible right angle configurations containing a self-avoiding edge. Configuration 2 shows the possible configurations of right angles without self-avoiding edges.
Let  be a vertex at which the two incident walk edges connect to vertices
  and
and  respectively.
Configuration 1 has one edge connecting  and
and  at the side of the right angle. Hence, Def. 9 applies for reconstructing the boundary, where the intermediate lattice forms triangular faces having
  in their vertex set at the side of the right angle.
Configuration 2 has an edge  incident to
  at the side of the right angle that does not belong to the fiber and connects to a vertex that exclusively belongs to the lattice. Hence, Def. 8 applies for reconstructing the boundary. The edge
  guarantees that
  contributes to the boundary on the side of the right angle.
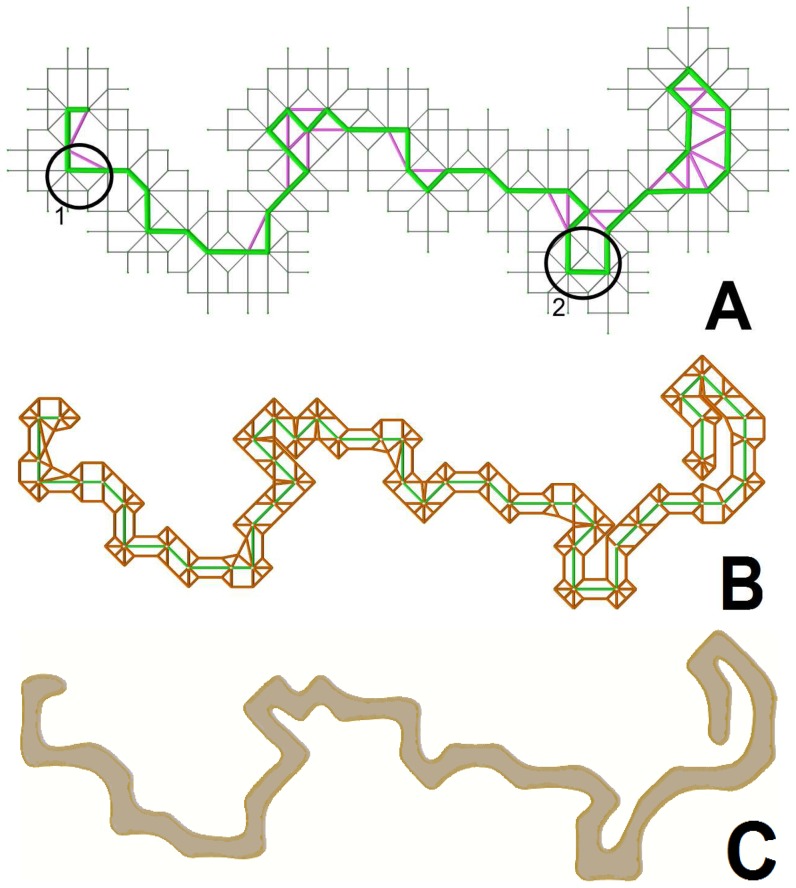
Configuration 1 demonstrates the case where our boundary construction guarantees that the expansion around  contributes to the boundary at the side of the right angle. Configuration 2 is the standard case resulting from the contraction. The two configurations are shown for a computed fiber walk in Fig. 11A, along with the constructed intermediate lattice in Fig. 11B. Fig. 11C has varying curvature along the entire boundary, even when the walk undergoes a right angle turn. The boundary inhibits right angles at the these locations because of the contraction at each step given in Def. 6. We can also refine the computed boundary in Fig. 11C with a Catmull-Clark subdivision scheme [12] to recover an “organic”, i.e. curved, shape. The Catmull-Clark scheme obtains a fine B-spline approximation of the boundary, which is valid because no right angles have to be approximated.
Figure 11. A computed fiber walk example with boundary.
(A)The illustrated fiber walk (green) is shown on a grey lattice, with two locations marked where curvature singularities are avoided. (B) The intermediate lattice (orange). (C) The filled boundary (brown) smoothed with a B-Spline in 2D.
Fiber walks define a region of occupied space
Each step of a fiber walk elongates the fiber and expands its boundary, which defines a region occupied by each step on the lattice. The fiber walk contains three edge length classes in 2D of length  and
and  , which are interpreted as a step forward on uncontracted lattice edges, a diagonal step resulting from the contraction of the lattice and a step over previously contracted lattice edges. Each edge length can be interpreted in terms of the distance the walk must cross through the expanded region before elongation can occur again. Each forward step starts at a point inside the actual growing object and has to pass through an expanded region. See Fig. S1, S2, S3 for 2D, 3D and 4D for computed statistics of the observed edge length classes.
Fiber configurations are constrained by spatial expansion
Fiber walks generate self-avoiding edges. Self-avoiding edges correspond to directions of growth that are inaccessible as a direct result of the spatial expansion of the fiber. There are five length classes of self-avoiding edges for a fiber grown on a 2D square lattice:  and
and  . See Fig. S1, S2, S3 for 2D, 3D and 4D for computed statistics of the observed self-avoiding edge length classes. Although these length classes vary with lattice-type, the fact that they are heterogeneous and can be linked to spatial expansion is generic. In particular, self-avoiding edges of length
  and
and  in 2D represent locations where expanded fibers are closer to each other than needed for expansion. Hence, lateral expansion alter the possible configurations of a resulting fiber.
Spatial expansion inhibits elongation steps of fiber walks
The stopping time describes the probability of a walk to generate a stopping configuration (compare Def. 4). We give here the stopping times for the 2D growing SAW and fiber walk (Fig. 12) as the cumulative density function of the walk length (see SI for computation results). For the computation of the 2D stopping times we considered 100,000 walks of a maximum length of 300 steps. For the growing SAW the walks stopped after 50 steps with 50% chance. In contrast the fiber walk reached the 50% mark at approximately 29 steps. We found evidence that the two distributions are distinct from each other by performing a two-sample Kolmogorov-Smirnov test ( ). The stopping times allow the conclusion that fiber walks have on average less steps until termination then their dimensionally reduced equivalent. The computation of exact stopping times in 3D and 4D is beyond scope of this paper.
Figure 12. Stopping times of SAW and fiber walk.
Comparison of the growing SAW (blue) and fiber walk (red) stopping times. The figure shows the computed walk length at termination of 100.000 single walks.
Expansion lets the fiber walk initially reach further
From the previous paragraph it follows that we need an indication of how the fiber walk expansion affects the growth of the fiber. We compare the end-to-end distance per step to evaluate how far the growing SAW and the fiber walk are on average away from the origin. The classic property to characterize this behavior is the scaling obtained as the average Euclidean mean-square-displacement (MSD) from the origin as a function of the number of steps on the lattice [2]. The scaling of the MSD  in relation to the number of steps
  taken on the lattice is denoted as:
| (4) |
| (5) |
The scaling exponent  for a walk is determined as the slope of the best fit line where the function
  reaches an asymptotic slope and is called the scaling region. In contrast the region before reaching an asymptotic slope is called the transient region. For example, a standard diffusive process, such as the ordinary random walk, corresponds to
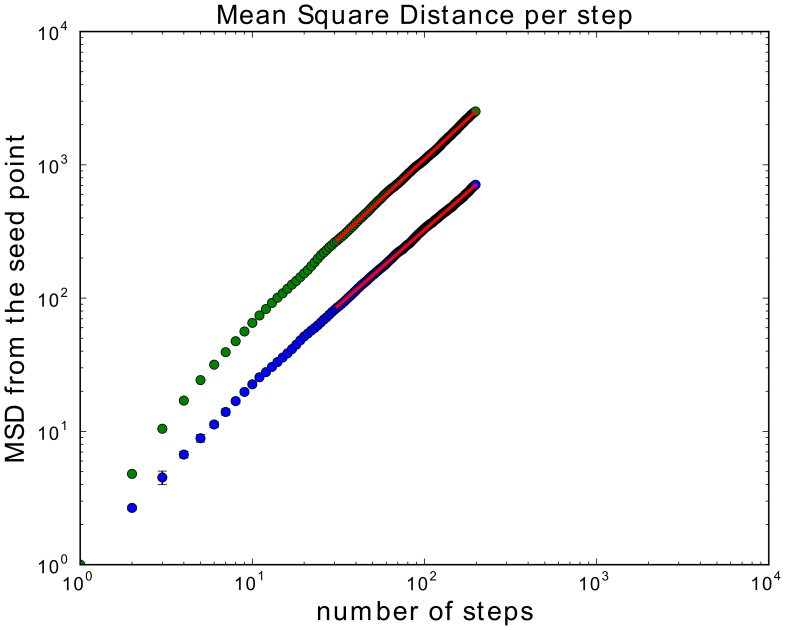
  . In order to estimate the scaling exponent we computed 1,000 fiber walks and growing SAW's in dimensions 2,3,4 using simple sampling. Trapped walks were restarted by removing the last edge until a walk length of 200 steps was reached to assure that all 1,000 walks represent configurations with in the scaling region. Note that this restarting technique overrides stopping configurations that occur naturally. We selected walks of a certain minimum length to obtain the scaling of the MSD over the number of steps on the lattice. The exponents for all scaling exponents given in this sections are derived from the least-square fit of a line into the scaling region of the averaged MSD values per number of steps. We have chosen a change of less than 0.1 in the asymptotic slope as a threshold to determine the scaling region from 30 steps onwards and used bootstrapping to evaluate the error of the slope. We obtained for
  , Fig. 13(left), a value of 0.55±0.05 and 0.55±0.06 for the 2D fiber walk and the 2D growing SAW respectively. For dimensions 3 and 4 we obtained 0.53±0.04 and 0.53±0.03 for the fiber walk and the 0.52±0.04 and 0.53±0.03 for the growing SAW respectively. For computation results in 3D see Fig. S4 and Fig. S5 for the 4D computation. Our main observation is that our fiber walk diverges further away from the origin before reaching the scaling region than the growing SAW, which is visible in the higher absolute MSD value compared to the SAW. This stronger divergence in the transient region suggests that expansion makes fiber walks initially more ballistic because of different step length resulting from the contraction.
Figure 13. Scaling of the fiber walk and SAW.
The summarized overview of the MSD scaling of the growing SAW (blue) and the fiber walk (green) is shown. For both, the fit line in the scaling region is shown in red.
A measure for the overall expanded area
In alignment with the scaling behaviour of the self-avoiding edges, the number of merges defines the amount of occupied space on the lattice. Nevertheless, the unique characteristic of the fiber walk is the contraction, which defines the boundary describing the spatial expansion of the fiber walk. Here we give the scaling of the number of contractions for the fiber walk as a measure for the for the size of the boundary (See Fig. S6, S7, S8). In 2D this resulted in a scaling exponent of 1.13, whereas for the 3D and 4D cases a similar exponent of 0.98 and 0.98 was obtained. The similar exponent means that not all edges incident from the side result in a merge. Fig. S6, S7, S8 show the actual computation results.
Discussion
In this paper we introduced the fiber walk, which is a growing SAW that includes lateral expansion. The expansion of the fiber walk is modeled as a local contraction around the last vertex reached on the lattice. We have shown that the fiber walk process constitutes a mechanism by which physical space is reserved, yet does not imply the expansion of the object into this space. We have found that the expansion lets a walk diverge initially further away from the origin before entering the scaling region and that the fiber walk takes, on average, fewer steps until termination than the SAW. Self-avoidance as proposed in our model causes encapsulated regions on the lattice that inhibit further exploration by the fiber unless a branching mechanism is added.
One benefit of modeling the contraction is that local object thickness larger than the step size is possible. Although we have shown only the difference between modeling elongation (alone) and elongation with expansion, our fiber walk is capable to perform more than one contraction while growing. A practical variation of the principal fiber walk would be to assign probabilities to the selection of walk edges. Such probabilities should allow the simulation of more ballistic walk behaviour. As far as we are aware, the connection between self-avoidance and contraction in SAW-derived models has not been established in the study of random walks in biology (see [13] for an overview). In particular, the correlated random walk on a lattice has been studied to explain solely the elongation and the direction in root development on the example of spruce trees [14]. Recently the importance of spatial expansion for modeling plants has been highlighted in [15] and L-Systems might be a suitable formalism to express the fiber walk mechanisms underlying the emergence of root shapes [16]. Simulations of the root growth have been developed that include rich information on root physiology and biology [17]–[19] and many underlying models have been derived from measured empirical data [20]. We see the fiber walk as a complementary development in the sense that it models a simple but abstract mechanism with explicit walk geometry and that could be integrated into models that incorporate greater realism.
Future work on the fiber walks will be targeted towards the creation and simulation of physical networks including the spatial interactions between several fiber that walk on the same lattice. In our opinion the fiber walk has the potential to parallel geometrically the apical tip-driven growth of individual branches in many plants at the apical meristem. Morphogens within the apical meristem regulate the extension of individual branches [21]–[23] which may find an analogue in the tip of the growing fiber. Examples include root growth in plants whose extension is tip-driven [24]–[26]. Above-ground plant and tree structure is tip-driven [27] and, again morphogens regulate the branch extension at the apical meristem. Similarly, the long and branching filamentous structure of fungi (hypha) extend from the ‘Spitzenkörper’ [28]. Also hyphae growth is simulated via a tip-driven growth emerging from a ‘vesicle supply center’ within the tip [29].
Many such networks face the problem of being below the maximum resolution of sensing technologies in non-laboratory conditions (e.g. roots in real soil). The fiber walk enables us to develop localized descriptors or measures that may serve as the basis for models in efforts to identify adaptive growth rules in complex organisms. Finally, the current definition and implement of the fiber walk best describe the growth of sessile objects. However, extensions to the model could also include the possibility of movement of edges within the fiber and further coupling of physical mechanisms of growth influenced by surface properties. The method is available within the supporting material of this paper, for download on the web pages of the authors and on git hub (https://github.com/abucksch/FiberWalk).
Materials
The results of this paper were produced with the python program that we provide together with the paper. This software is suitable for developers to use as a template to integrate our fiber walk into their software. An end user should follow the requirements provided in the “readme” file to execute the program.
Supporting Information
Comparison of edge length classes of the walk (green) and the self-avoiding edges on the lattice (purple) for the fiber walk in 2D.
(TIFF)
Comparison of edge length classes of the walk (green) and the self-avoiding edges on the lattice (purple) for the fiber walk in 3D.
(TIFF)
Comparison of edge length classes of the walk (green) and the self-avoiding edges on the lattice (purple) for the fiber walk in 4D.
(TIFF)
The average MSD scaling for the 3D growing SAW (blue) and the 3D fiber walk (green). The scaling exponent for the growing SAW is  and for the fiber walk
  based on 1000 walks of length 200.
(TIFF)
The average MSD scaling for the 4D growing SAW (blue) and the 3D fiber walk (green). The scaling exponent for the growing SAW is  and for the fiber walk
  based on 1000 walks of length 200.
(TIFF)
The number of contractions indicating the size of the area enclosed by the region for the 2D fiber walk resulting in the scaling exponent of 1.13 for 1000 walks of length 200.
(TIFF)
The number of contractions indicating the size of the area enclosed by the region for 3D fiber walk resulting in the scaling exponent of 0.98 for 1000 walks of length 200.
(TIFF)
The number of contractions indicating the size of the area enclosed by the region for the 4D fiber walk resulting in the scaling exponent of 0.98 for 1000 walks of length 200.
(TIFF)
Acknowledgments
The authors thank Daniel I. Goldman for helpful suggestions on the manuscript.
Funding Statement
The funders had no role in study design, data collection and analysis, decision to publish, or preparation of the manuscript. This work was supported by the National Science Foundation, Plant Genome Research Program grant nos. 0820624 to J.S.W.) J.S.W. holds a Career Award at the Scientific Interface from the Burroughs Wellcome Fund.
References
- 1. Rounds CM, Bezanilla M (2013) Growth mechanisms in tip-growing plant cells. Annual review of plant biology 64: 243–265. [DOI] [PubMed] [Google Scholar]
- 2. Madras N, Slade G (1993) The self-avoiding walk. probability and its applications. Birkhauser Boston Inc, Boston, MA 49: 105. [Google Scholar]
- 3. Landau DP, Binder K (2009) A guide to monte carlo simulations in statistical physics. [Google Scholar]
- 4. Karch R, Neumann F, Neumann M, Schreiner W (1999) A three-dimensional model for arterial tree representation, generated by constrained constructive optimization. Computers in biology and medicine 29: 19–38. [DOI] [PubMed] [Google Scholar]
- 5. Hamarneh G, Jassi P (2010) ¡ i¿ vascusynth¡/i¿: Simulating vascular trees for generating volumetric image data with ground-truth segmentation and tree analysis. Computerized medical imaging and graphics 34: 605–616. [DOI] [PubMed] [Google Scholar]
- 6. Bhattacharya A, Wenger R (2013) Constructing isosurfaces with sharp edges and corners using cube merging. Computer Graphics Forum 32: 11–20. [Google Scholar]
- 7. Dey TK, Wang L (2013) Voronoi-based feature curves extraction for sampled singular surfaces. Computers & Graphics [Google Scholar]
- 8. Hund A, Trachsel S, Stamp P (2009) Growth of axile and lateral roots of maize: I development of a phenotying platform. Plant and Soil 325: 335–349. [Google Scholar]
- 9.Skiena S (1991) Implementing discrete mathematics: combinatorics and graph theory with Mathematica. Addison-Wesley Longman Publishing Co., Inc.
- 10. Wilson RJ (1985) Introduction to Graph Theory, 4/e. Pearson Education India [Google Scholar]
- 11. Lyklema J, Kremer K (1984) The growing self avoiding walk. Journal of Physics A: Mathematical and General 17: L691. [Google Scholar]
- 12. Catmull E, Clark J (1978) Recursively generated b-spline surfaces on arbitrary topological meshes. Computer-aided design 10: 350–355. [Google Scholar]
- 13. Codling EA, Plank MJ, Benhamou S (2008) Random walk models in biology. Journal of the Royal Society Interface 5: 813–834. [DOI] [PMC free article] [PubMed] [Google Scholar]
- 14. Renshaw E, Henderson R (1981) The correlated random walk. Journal of Applied Probability 403–414. [Google Scholar]
- 15. Prusinkiewicz P, de Reuille PB (2010) Constraints of space in plant development. Journal of experimental botany 61: 2117–2129. [DOI] [PubMed] [Google Scholar]
- 16. Leitner D, Klepsch S, Bodner G, Schnepf A (2010) A dynamic root system growth model based on l-systems. Plant and Soil 332: 177–192. [Google Scholar]
- 17. Dupuy L, Gregory PJ, Bengough AG (2010) Root growth models: towards a new generation of continuous approaches. Journal of experimental botany 61: 2131–2143. [DOI] [PubMed] [Google Scholar]
- 18. de Dorlodot S, Forster B, Pagès L, Price A, Tuberosa R, et al. (2007) Root system architecture: opportunities and constraints for genetic improvement of crops. Trends in plant science 12: 474–481. [DOI] [PubMed] [Google Scholar]
- 19. Lynch JP, Nielsen KL, Davis RD, Jablokow AG (1997) Simroot: modelling and visualization of root systems. Plant and Soil 188: 139–151. [Google Scholar]
- 20. Dunbabin VM, Postma JA, Schnepf A, Pagès L, Javaux M, et al. (2013) Modelling root–soil interactions using three–dimensional models of root growth, architecture and function. Plant and Soil 1–32. [Google Scholar]
- 21. Leyser O (2011) Auxin, self-organisation, and the colonial nature of plants. Current Biology 21: R331–R337. [DOI] [PubMed] [Google Scholar]
- 22. Aloni R, Aloni E, Langhans M, Ullrich C (2006) Role of cytokinin and auxin in shaping root architecture: regulating vascular differentiation, lateral root initiation, root apical dominance and root gravitropism. Annals of Botany 97: 883–893. [DOI] [PMC free article] [PubMed] [Google Scholar]
- 23. Aloni R, Langhans M, Aloni E, Ullrich CI (2004) Role of cytokinin in the regulation of root gravitropism. Planta 220: 177–182. [DOI] [PubMed] [Google Scholar]
- 24. Grieneisen VA, Xu J, Marée AF, Hogeweg P, Scheres B (2007) Auxin transport is su_cient to generate a maximum and gradient guiding root growth. Nature 449: 1008–1013. [DOI] [PubMed] [Google Scholar]
- 25. Hodge A, Berta G, Doussan C, Merchan F, Crespi M (2009) Plant root growth, architecture and function. Plant and Soil 321: 153–187. [Google Scholar]
- 26. Overvoorde P, Fukaki H, Beeckman T (2010) Auxin control of root development. Cold Spring Harbor Perspectives in Biology 2. [DOI] [PMC free article] [PubMed] [Google Scholar]
- 27. Sachs T (2004) Self-organization of tree form: a model for complex social systems. Journal of Theoretical Biology 230: 197–202. [DOI] [PubMed] [Google Scholar]
- 28. Lew RR (2011) How does a hypha grow? the biophysics of pressurized growth in fungi. Nature Reviews Microbiology 9: 509–518. [DOI] [PubMed] [Google Scholar]
- 29.Webster J, Weber R (1980) Introduction to fungi, volume 667. Cambridge University Press Cambridge.
Associated Data
This section collects any data citations, data availability statements, or supplementary materials included in this article.
Supplementary Materials
Comparison of edge length classes of the walk (green) and the self-avoiding edges on the lattice (purple) for the fiber walk in 2D.
(TIFF)
Comparison of edge length classes of the walk (green) and the self-avoiding edges on the lattice (purple) for the fiber walk in 3D.
(TIFF)
Comparison of edge length classes of the walk (green) and the self-avoiding edges on the lattice (purple) for the fiber walk in 4D.
(TIFF)
The average MSD scaling for the 3D growing SAW (blue) and the 3D fiber walk (green). The scaling exponent for the growing SAW is  and for the fiber walk
  based on 1000 walks of length 200.
(TIFF)
The average MSD scaling for the 4D growing SAW (blue) and the 3D fiber walk (green). The scaling exponent for the growing SAW is  and for the fiber walk
  based on 1000 walks of length 200.
(TIFF)
The number of contractions indicating the size of the area enclosed by the region for the 2D fiber walk resulting in the scaling exponent of 1.13 for 1000 walks of length 200.
(TIFF)
The number of contractions indicating the size of the area enclosed by the region for 3D fiber walk resulting in the scaling exponent of 0.98 for 1000 walks of length 200.
(TIFF)
The number of contractions indicating the size of the area enclosed by the region for the 4D fiber walk resulting in the scaling exponent of 0.98 for 1000 walks of length 200.
(TIFF)


