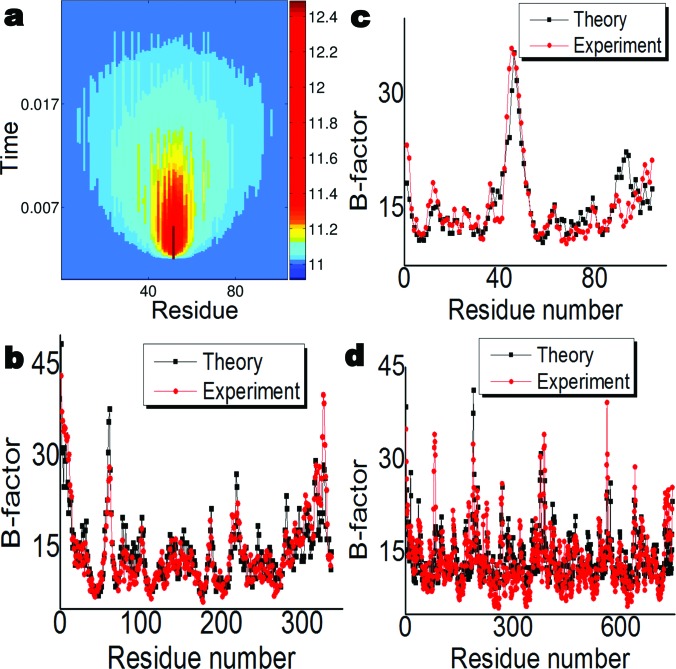
Figure 5.
Protein flexibility analysis by the present ILDM method. (a) The impact and relaxation of the transverse perturbation of the ILDM at a given amino acid residue (the 52th ). The residues in horizontal axis are listed in the descending order according to their distances with respect to the perturbed residue. (b)-(d) The experimental B-factors and ILDM predictions for protein 1aru, 2nuh, and 4dr8. The correlation coefficients are respectively 0.913, 0.866, and 0.751 for three predictions.

