

Abstract
Genomic DNA is organized three dimensionally within cells as chromatin and is searched and read by various proteins by an unknown mechanism; this mediates diverse cell functions. Recently, several pieces of evidence, including our cryomicroscopy and synchrotron X-ray scattering analyses, have demonstrated that chromatin consists of irregularly folded nucleosome fibers without a 30-nm chromatin fiber (i.e., a polymer melt-like structure). This melt-like structure implies a less physically constrained and locally more dynamic state, which may be crucial for protein factors to scan genomic DNA. Using a combined approach of fluorescence correlation spectroscopy, Monte Carlo computer simulations, and single nucleosome imaging, we demonstrated the flexible and dynamic nature of the nucleosome fiber in living mammalian cells. We observed local nucleosome fluctuation (~50 nm movement per 30 ms) caused by Brownian motion. Our in vivo-in silico results suggest that local nucleosome dynamics facilitate chromatin accessibility and play a critical role in the scanning of genome information.
Keywords: nucleosome fiber (10-nm fiber), 30-nm chromatin fiber, fluorescence correlation spectroscopy (FCS), Monte Carlo computer simulations, single nucleosome imaging, nucleosome fluctuation, polymer-melt, irregular folding, interphase chromatin, mitotic chromosomes, transcriptional regulation
Introduction
The long strand of genomic DNA must be organized three dimensionally in cells to scan and read genome information; this mediates various cellular functions. Genomic DNA is wrapped around core histones and forms a nucleosome fiber (bead-on-a-string or 10-nm fiber).1-3 The nucleosome has long been assumed to be folded into a 30-nm chromatin fiber,4,5 and further hierarchical regular structures.6,7 Although the higher-order chromatin structure in eukaryotic cells is not fully understood, several lines of evidence, including our recent cryomicroscopy and synchrotron X-ray scattering analyses, have demonstrated that chromatin in cells consists of irregularly folded nucleosome fibers without a 30-nm chromatin fiber;8-15 i.e., a polymer-melt-like structure.9,10,13,15
Compared with the 30-nm chromatin fiber and further hierarchical regular structures proposed previously, irregular folding of nucleosome fibers, leading to a polymer melt-like structure, implies a physically constrained state that could be locally dynamic. Nucleosome fibers may be constantly moving and rearranging at the local level,8-10,12,13 which might be essential for protein factors to scan genomic DNA and locate their target sequences. However, many previous studies, including ours, examined only static structures in fixed cells. Therefore, how can we know the chromatin environment in living mammalian cells, in which many protein molecules are freely mobile? How can proteins access their destinations on chromatin in living cells? To address these fundamental questions, we utilized a combined in vivo-in silico strategy of fluorescence correlation spectroscopy (FCS),16,17 single-molecule imaging18-20 and Monte Carlo computer simulations.21,22 Based on this strategy, we uncovered the unexpected local dynamics of individual nucleosomes in living mammalian cells (Fig. 1A).23 The results obtained here indicate that nucleosome fluctuation increases chromatin accessibility, which is advantageous for many “target searching” biological processes, such as transcription, DNA repair, replication, and recombination (Fig. 1A).23
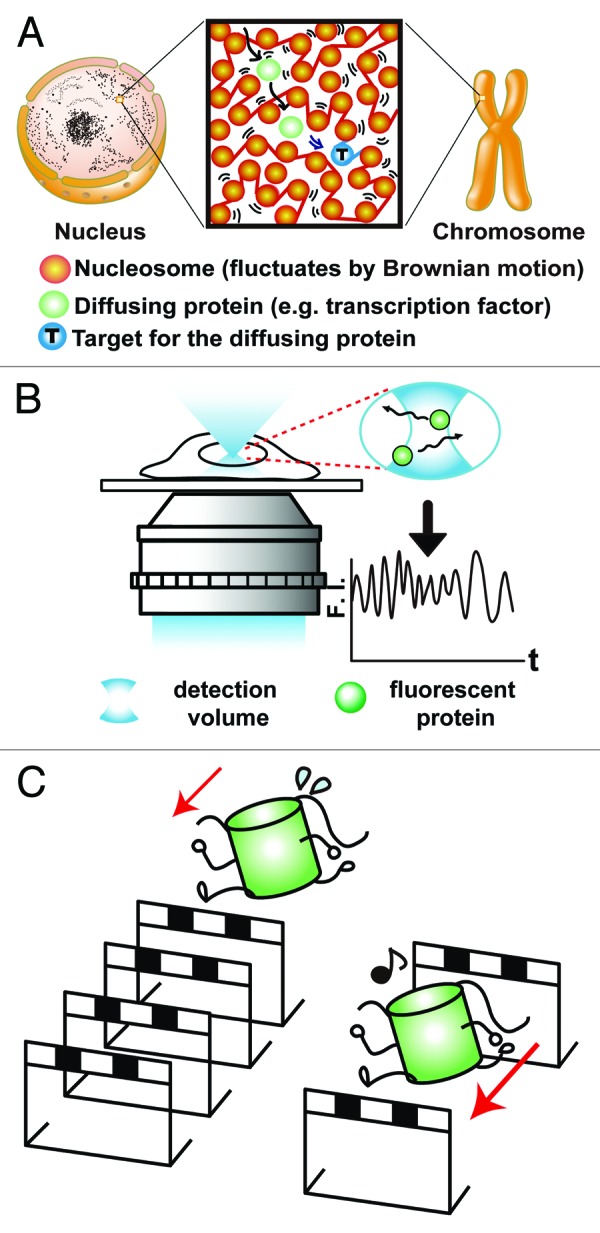
Figure 1. Graphical abstract and FCS measurements in living mammalian cells. (A) Graphical abstract. In the cells, nucleosome fibers (red spheres and lines) are irregularly folded. Nucleosomes fluctuate, and this nucleosome dynamics facilitates chromatin accessibility. Chromatin fluctuation is the basis for scanning genome information. The image was reproduced from reference 23. (B) Schematic diagram of FCS detecting the in-out motion of EGFP molecules (green spheres) in a ~0.1-femtoliter volume (white-out cylinder region in the blue) as fluctuations in fluorescence intensity (shown as a graph). F.I., fluorescence intensity; t, time. The image was modified from reference 23. (C) Cartoon showing that fluorescent proteins (represented as runners) move more slowly in a crowded chromatin environment due to the many obstacles (represented as hurdles).
Fluorescence Correlation Spectroscopy (FCS) Measurements of Interphase Chromatin and Mitotic Chromosomes in Living Cells
To investigate the chromatin environment in living cells, we first employed fluorescence correlation spectroscopy (FCS).24 FCS detects the in- and out-motions of fluorescent probe molecules, such as enhanced green fluorescent proteins (EGFPs), in a small detection volume (~0.4 µm in diameter by ~1–2 µm in height), as up- and down-fluorescence intensity fluctuations (Fig. 1B, F.I.). From the intensity fluctuations, we obtained the diffusion coefficient (D) for mobile EGFP probe molecules. D shows how far the probe molecules can move in a certain range of time. In the crowded molecular environment, the D of probe molecules becomes much smaller due to the many obstacles that the probes encounter (Fig. 1C).
Since the FCS detection size is much larger than human chromosomes (~0.7 µm),25 especially in height, we used Indian Muntjac DM cells.26 These cells have giant chromosomes whose size (~2 µm in diameter) is much larger than the detection volume. We obtained three stable DM cell lines coexpressing either the EGFP-monomer, -trimer, or -pentamer, and H2B-mRFP1.23 The three types of EGFP are probe molecules for detecting mobility in the FCS detection volume. The EGFP-trimer (~90 kDa) and -pentamer (~150 kDa) are used to examine the effect of molecular size on diffusion compared with the EGFP-monomer (~30 kDa).24,27,28 H2B-mRFP1 is the marker used to conform the chromatin region.24,27,28 Using these cell lines optimized for precise FCS measurement, we compared the D values of EGFP probes in the cytoplasm, interphase chromatin, and mitotic chromosomes (Table 1).23 Surprisingly, while the chromosomes showed a highly condensed structure (~0.5 mM at nucleosome concentration), EGFP molecules were able to move inside chromosomes, and the D of mitotic chromosomes was only 30% lower than that of interphase chromatin (~0.05–0.1 mM). Even in the case of the EGFP-trimer and -pentamer, their diffusion profiles appeared to be similar.23 This suggests that high protein mobility in dense chromosomes can be observed by fluorescent probes of larger size. Our results in Table 1 indicate that interphase chromatin and mitotic chromosomes have considerable chromatin accessibility, implying a novel underlying mechanism, especially in dense chromatin regions.
Table 1.Mean D values(µm2/s) of EGFP-monomers, -trimers and -pentamers in living cells.
| Solution | Cytoplasm | Interphase chromatin | Mitotic chromosome | |
|---|---|---|---|---|
| EGFP-monomer | 75.9 ± 2.3 | 23.4 ± 4.3 | 20.6 ± 3.6 | 14.5 ± 1.9 |
| EGFP-trimer | 43.2 ± 1.4 | 11.2 ± 1.5 | 9.1 ± 1.9 | 6.9 ± 1.6 |
| EGFP-pentamer | 31.6 ± 2.3 | 7.3 ± 1.4 | 6.7 ± 1.1 | 3.6 ± 1.1 |
*The values were reproduced from reference 23.
In Silico Reconstruction of the Chromatin Environment Predicts that Nucleosome Fluctuation Facilitates Chromatin Accessibility
To characterize chromatin accessibility in living cells further, we reconstructed a chromatin environment in silico. To examine the mobility of EGFP-pentamers (~150 kDa) under various chromatin conditions, we used Metropolis Monte Carlo computer simulation21,22 with parameters obtained from our data (Ds and nucleosome concentrations).23 In this simulation, the nucleosome was represented as a sphere with a 10-nm hydrodynamic diameter (10-nm sphere in Fig. 2), and the EGFP-pentamer molecule was represented as a sphere with a 13-nm hydrodynamic diameter (13-nm sphere in Fig. 2). First, the concentration of simulated nucleosomes was set to 0.1 or 0.5 mM (Fig. 2A). The 0.5 mM condition corresponded to highly condensed chromatin environment such as mitotic chromosomes.29-31 In these virtual chromatin environments, the simulation procedure was as follows (Fig. 2B): we first included spheres (Step 1 in Fig. 2B) and decided at random the order of the spheres to be moved (Step 2). The first sphere was then moved randomly (Step 3). Its displacement followed the three-dimensional normal distribution with the standard deviation (SD = ). We turned to the next sphere (Step 4) and repeated this process a certain number of times. Finally, we traced the movement of the 13-nm spheres (EGFP-pentamer). At 0.1 mM of the nucleosomes, the EGFP-pentamer could move almost freely (Fig. 2C, left; Vid. S1).23

Figure 2. Reconstruction of the living chromatin environment using Monte Carlo computer simulation. (A) The nucleosome is represented as a 10-nm red sphere and fixed in a restricted space at a concentration of 0.1 mM (left) or 0.5 mM (right, corresponding to mitotic chromatin) randomly but in a manner that avoids any overlap. The EGFP-pentamer is represented as a 13-nm sphere (green). See also Videos S1 to S3. (B) A simple scheme of the simulation procedure. For the details, see text. (C) Tracing patterns of three 13-nm spheres (EGFP-pentamers) under various conditions. At 0.1 mM of fixed 10-nm spheres (nucleosomes), the 13-nm spheres (EGFP-pentamers) move around freely (left image). However, at 0.5 mM of fixed 10-nm spheres (nucleosomes), the 13-nm spheres (EGFP-pentamers) are unable to move far from their starting points (middle image). In the environment with a fluctuation of 0.5 mM of the 10-nm spheres (nucleosomes), the 13-nm spheres (EGFP-pentamers) can move around freely (right image), in contrast to the case of the fixed 10-nm spheres (nucleosomes, middle image). Each 10-nm red sphere (nucleosome) behaves like “a dog on a leash.” The leash length is 20 nm. The three different temporal trajectories of the 13-nm spheres (EGFP-pentamers) for 0.2 ms are indicated in blue, green, and red. (D) Cartoons showing that a protein (green) is stacked in a confined space of fixed nucleosomes (left), and the protein is able to move freely with fluctuation of the nucleosomes (right).
Under the 0.5 mM condition, which corresponded to highly condensed chromatin environment, if the nucleosomes were fixed in space, the EGFP-pentamer could not move far from the starting point (Fig. 2C, middle; Vid. S2).23 They were stacked in a confined space, thus causing a serious mobility problem (Fig. 2D, left). We next performed a simulation with fluctuating nucleosomes. In this model, the nucleosomes were mobile, but their movements were restricted to a certain range, resembling “a dog on a leash” situation. In this dynamic environment, we observed apparent free diffusion of the EGFP-pentamer, even in 0.5 mM nucleosomes (Fig. 2C, right; Vid. S3; Fig. 2D, right). Strikingly, a 10- to 20-nm fluctuation of the nucleosomes was sufficient for the EGFP-pentamers to diffuse freely.23 Furthermore, even at the low concentration (0.1–0.4 mM) of nucleosomes such as interphase chromatin environment, the fluctuation facilitated mobility of the EGFP-pentamers.23 These simulation results suggest that nucleosome fluctuation facilitates chromatin accessibility for the diffusing protein;23 see also references 32 and 33 by Langowski group. Since the nucleosomes in cells, which are linked by linker DNA, fill more space with less freedom, nucleosome fluctuation may be critical for chromatin accessibility.
Single Nucleosome Imaging in Living Mammalian Cells
The next obvious question was whether nucleosome fluctuation could be detected in living mammalian cells. For this purpose, we performed single particle imaging of nucleosomes in living cells. To visualize single nucleosomes, we fused photoactivatable (PA)-GFP with histone H4 (Fig. 3A),34,35 a stable core histone component,36 and expressed the fusion protein in DM and HeLa cells at a very low level.23 For single nucleosome imaging, we used oblique illumination (highly inclined and laminated optical sheet, HILO) microscopy (Fig. 3B).37 Normally, PA-GFP shows GFP fluorescence only after activation by a 405-nm laser (Fig. 3A, right). However, we unexpectedly found that a very low number of PA-GFP-H4 in the stable DM and HeLa cells were spontaneously activated without 405-nm laser activation (Fig. 3A, left), and were observed as dots (Fig. 3A, left and 3C).23 We observed single-step photobleaching of the PA-GFP-H4 dots, although photobleaching of multiple PA-GFP-H4 complexes should occur in multiple steps or gradually.23 The estimated number of PA-GFP-H4 was less than 5% of endogenous H4.23 These observations indicate that each dot represents a single PA-GFP-H4 molecule in a single nucleosome. In addition, since free PA-GFP-H4 should have a much larger D value, we could trace only the PA-GFP-H4 fraction that was stably incorporated into nucleosomes.23

Figure 3. Single nucleosome imaging. (A) Generally, PA-GFP shows GFP fluorescence only after activation by a 405-nm laser (right). However, a small fraction of PA-GFP-H4 was spontaneously activated without laser activation (left) and was used for our single-nucleosome imaging. (B) A schematic representation of the oblique illumination microscopy (HILO system, ref. 37). We used Nikon laser TIRF microscope system Ti with Sapphire 488 nm laser (Coherent). Using a sheet light (blue), a limited area in the cell is illuminated. (C) Single-nucleosome image of a DM cell nucleus expressing PA-GFP-H4. PA-GFP-H4 observed as a bright dot using the oblique illumination microscopy system. For single-nucleosome tracking, the free software, u-track,49 was used. The dots were fitted to an assumed Gaussian point spread function to determine the precise center of signals with higher resolution.34 (D) Representative trajectories of fluorescently tagged single nucleosome.
Local Nucleosome Fluctuation in Living Mammalian Cells
We recorded nucleosome signals in interphase chromatin and mitotic chromosomes in living DM cells at a video-rate (~30 ms/frame) as a movie. For signal nucleosome tracking, we used PolyParticleTracker software.38 The dots were fitted to an assumed Gaussian point spread function to determine the precise centers of the dots with higher resolution.34 We were able to analyze the behaviors of the nucleosomes over short periods of time, ranging from 0 to 0.18 s.23 Notably, the displacement (movement) distributions of single nucleosomes of interphase and mitotic chromatin appeared similar (~50 nm per 30 ms).23
As a control, we measured the displacement of fluorescent beads (100 nm in diameter) fixed on a glass surface. The average displacement values were much smaller than those observed in living cells, excluding major contribution of microscopy system drift.23 To exclude the possibility that the detected movement was derived from global motion of the nuclei or chromosomes, we measured centroid movements for many nucleosomes in the same time frame. These values were again much smaller than the movements of individual nucleosomes in living cells.23 Therefore, we concluded that most of the observed displacement was due to the local movement (fluctuation) of nucleosomes in living cells. In addition, we found that HeLa cells expressing a low level of PA-GFP-H4 showed considerable nucleosome mobility, suggesting that local nucleosome movement in mammalian cells is a general phenomenon.23 Recently, the McNally group also published single-nucleosome tracking data using H2B-EGFP,39 which appear to be consistent with our single nucleosome tracking with PA-GFP-H4.
To strengthen our conclusion in reference 23 and for further characterization of nucleosome fluctuation, we performed several additional measurements. First, we measured single H4-PA-GFPs expressed in DM cells. The expression was driven by a different expression promoter (pSV40) from those in the previous study (CDK1 and EF1-α promoters). To show the displacement distribution, we measured approximately 20 000 signal points with single nucleosome tracking with H4-PA-GFP from seven DM cells (Figs. 3D, 4A and 4B), instead of the approximately 1 000 points previously reported with PA-GFP-H4 in reference 23. Some representative trajectories of the nucleosome movements and the displacement distributions in the x-y plain were also shown in Figures 3D and 4B, respectively. The obtained distribution profile was consistent with our previous results.23 The results also showed that nucleosome fluctuation was not affected by differences in the fusion position of PA-GFP and the expression promoter.

Figure 4. Single nucleosome analysis of H4-PA-GFP. (A) Displacement (movement) histograms of single nucleosomes in interphase DM cells for 30 ms (left), 60 ms (center), and 90 ms (right; n = 20 000 in seven cells). The mean displacement ± standard error for the 30 ms time point was indicated. (B) Distribution of nucleosome displacements in the x-y plane for 30 ms (left), 60ms (center), and 90 ms (right). n = 3 000 in seven cells. Standard deviations (SDx and SDy) were shown. In panels (A) and (B), the originally calculated displacement was in two dimensions. To obtain their 3D values, the two-dimensional values of displacement were multiplied by (). (C) Displacement histograms of single EGFP on a glass surface for 30 ms (left), 60 ms (center) and 90 ms (right; n = 1 300). The mean ± standard error for the 30 ms time point was indicated. (D) Distribution of EGFP displacements in the x-y plane for 30 ms (left), 60ms (center), and 90 ms (right; n = 1 300). Standard deviations (SDx and SDy) were shown. The insets are 3-fold magnified images of the distributions.
Second, the displacement data of purified GFP fixed on a glass surface were obtained (Fig. 4C and D). The average displacement values were 12.8 ± 0.2 nm per 30 ms, which was much smaller than those of H4-PA-GFP observed in living cells (59.0 ± 0.2 nm per 30 ms in Fig. 4A). Third, to evaluate the contribution of whole cell or nuclear movements to the single nucleosome displacements, we again calculated the centroid movements for many nucleosomes in the same time flame (illustrated in Fig. 5A). The centroid movements (5.5 ± 0.1 nm per 30 ms) (Fig. 5B) are much smaller than those in Figure 4A and B, suggesting that the detected nucleosome movement is not derived from the global motion of cells or nuclei.

Figure 5. Local nucleosome fluctuation in living mammalian cells. (A) Schematic representation for calculating centroid movement for many nucleosomes in the same time frame. The black arrows represent the movements of nucleosomes and the small arrow represents centroid movement in the frame. Note that the gray arrow is much smaller than the others. (B) Displacement histogram (left) and distribution in the x-y plane (right) of centroid movement in the frame for 30 ms (n = 350 in seven cells). The inset is 10-fold magnified image of the distribution. (C) Plots of the mean-square displacements (MSDs) with standard errors of single nucleosomes in interphase chromatin (left) and single EGFPs on a glass surface (right) from 0 to 0.18 s. The plots for single nucleosomes were fitted as an anomalous diffusion, suggesting that nucleosome movement supports a restricted diffusion model. Error bars represent the standard errors of the mean value. In the panel of MSD for single nucleosomes, the originally calculated MSD were in two dimensions. To obtain their 3D values, the two-dimensional values of MSD were multiplied by 1.5 (6Dt/4Dt).
To analyze local nucleosome movement in DM cells further, the MSD values (μm2) of nucleosomes in the DM cells and fixed EGFP were plotted with their standard errors (Fig. 5C). The plots for the nucleosomes fitted well with the exponential equation, MSD = 0.022t0.36 (Fig. 5C). The MSD values increased rapidly in a short time and the steepness decreased over time, consistent with previous data.23 Again, these results support the restricted nucleosome movement model.
It was reported that movements of large chromatin domains tagged with lacO arrays (~100 kb and above) were on the 10 and 100 nm length scale for 30 ms (e.g., ref. 40). We could not exclude the possibility that movements of larger domains might contribute to the local nucleosome fluctuation that we observed. Their relationship would be an intriguing issue for further study.
Local Fluctuation of Nucleosomes is the Basis for Scanning Genome Information
This study revealed local nucleosome fluctuation in living mammalian cells (Fig. 1A). Monte Carlo computer simulations suggested that nucleosome fluctuation facilitates the mobility of diffusing proteins in the environment (Fig. 1A). In addition, such nucleosome fluctuation can expose DNA sequences to the surface of chromatin domains more often, while static regular folding structures, such as 30-nm chromatin fibers, can hide or mask most DNA sequences. It should be emphasized that both facilitation of protein mobility and DNA exposure lead to an increase in chromatin accessibility. This is in good agreement with our finding that tight cross-linking of nucleosomes blocked antibody accessibility and targeting in dense chromatin regions.23
Recently, we suggested that interphase chromatin forms numerous compact chromatin domains resembling “chromatin liquid drops” in interphase cells.10,13 This chromatin liquid drops view is in line with predictions of the chromosome territory-interchromatin compartment (CT-IC) model.41,42 In the CT-IC model, each CT is built up from a series of interconnected, megabase-sized chromatin domains, which were originally identified using a pulse labeling as the DNA replication foci.43-45 Recent high-throughput 3C studies, such as Hi-C and 5C, have also proposed physical packaging of genomic DNA, termed “topologically associating domains,”46 “topological domains”47 or “physical domains”.48 Local nucleosome fluctuation would play an especially important role in such compact chromatin domains because the effect of nucleosome fluctuation on the facilitation of chromatin accessibility is more significant in a compact chromatin environment.23
Many biological processes, including transcription, DNA repair, replication, and recombination, are based on “scanning genomic DNA and targeting”. For example, in transcriptional regulation, the dynamic movement of nucleosome fibers assists with the targeting of transcription factors and complexes. Dynamic irregular folding can easily form loops, facilitating interaction between promoters and enhancer sequences. Since the flexible and dynamic nature of nucleosome fibers in living mammalian cells drives such biological processes, regulation of local nucleosome dynamics, possibly by histone modification and/or specific proteins, will be an important factor in their regulation.
Supplementary Material
Acknowledgments
We would like to thank Drs Hanafusa T, Takemoto S, Yoshimi T, Yokota H, Imamoto N, Sako Y, and Kinjo M, who contributed to the work published in Cell Reports. We also thank Eltsov M for critical reading of this manuscript. We thank Horikawa K for purification of EGFP, Cook P and Kimura H for the DM cells, Imai R for the figure illustration, and Eltsov M, Hiratani I, and Cremer T for helpful discussions and support. Nagai T is grateful to Prof Tomita for support and encouragement. This work was supported by a grant-in-aid for a MEXT grant, JST CREST, Yamada Science Foundation, and Takeda Science Foundation. Nagai T and Hihara S are JSPS fellows.
Disclosure of Potential Conflicts of Interest
No potential conflict of interest was disclosed.
Supplemental Materials
Supplemental materials may be found here: www.landesbioscience.com/journals/nucleus/article/26053
Footnotes
Previously published online: www.landesbioscience.com/journals/nucleus/article/26053
References
- 1.Kornberg RD. Chromatin structure: a repeating unit of histones and DNA. Science. 1974;184:868–71. doi: 10.1126/science.184.4139.868. [DOI] [PubMed] [Google Scholar]
- 2.Woodcock CL, Safer JP, Stanchfield JE. Structural repeating units in chromatin. I. Evidence for their general occurrence. Exp Cell Res. 1976;97:101–10. doi: 10.1016/0014-4827(76)90659-5. [DOI] [PubMed] [Google Scholar]
- 3.Olins AL, Olins DE. Spheroid chromatin units (v bodies) Science. 1974;183:330–2. doi: 10.1126/science.183.4122.330. [DOI] [PubMed] [Google Scholar]
- 4.Finch JT, Klug A. Solenoidal model for superstructure in chromatin. Proc Natl Acad Sci U S A. 1976;73:1897–901. doi: 10.1073/pnas.73.6.1897. [DOI] [PMC free article] [PubMed] [Google Scholar]
- 5.Woodcock CL, Frado LL, Rattner JB. The higher-order structure of chromatin: evidence for a helical ribbon arrangement. J Cell Biol. 1984;99:42–52. doi: 10.1083/jcb.99.1.42. [DOI] [PMC free article] [PubMed] [Google Scholar]
- 6.Sedat J, Manuelidis L. A direct approach to the structure of eukaryotic chromosomes. Cold Spring Harb Symp Quant Biol. 1978;42:331–50. doi: 10.1101/SQB.1978.042.01.035. [DOI] [PubMed] [Google Scholar]
- 7.Belmont AS, Sedat JW, Agard DA. A three-dimensional approach to mitotic chromosome structure: evidence for a complex hierarchical organization. J Cell Biol. 1987;105:77–92. doi: 10.1083/jcb.105.1.77. [DOI] [PMC free article] [PubMed] [Google Scholar]
- 8.McDowall AW, Smith JM, Dubochet J. Cryo-electron microscopy of vitrified chromosomes in situ. EMBO J. 1986;5:1395–402. doi: 10.1002/j.1460-2075.1986.tb04373.x. [DOI] [PMC free article] [PubMed] [Google Scholar]
- 9.Eltsov M, Maclellan KM, Maeshima K, Frangakis AS, Dubochet J. Analysis of cryo-electron microscopy images does not support the existence of 30-nm chromatin fibers in mitotic chromosomes in situ. Proc Natl Acad Sci U S A. 2008;105:19732–7. doi: 10.1073/pnas.0810057105. [DOI] [PMC free article] [PubMed] [Google Scholar]
- 10.Maeshima K, Hihara S, Eltsov M. Chromatin structure: does the 30-nm fibre exist in vivo? Curr Opin Cell Biol. 2010;22:291–7. doi: 10.1016/j.ceb.2010.03.001. [DOI] [PubMed] [Google Scholar]
- 11.Fussner E, Ching RW, Bazett-Jones DP. Living without 30nm chromatin fibers. Trends Biochem Sci. 2011;36:1–6. doi: 10.1016/j.tibs.2010.09.002. [DOI] [PubMed] [Google Scholar]
- 12.Nishino Y, Eltsov M, Joti Y, Ito K, Takata H, Takahashi Y, Hihara S, Frangakis AS, Imamoto N, Ishikawa T, et al. Human mitotic chromosomes consist predominantly of irregularly folded nucleosome fibres without a 30-nm chromatin structure. EMBO J. 2012;31:1644–53. doi: 10.1038/emboj.2012.35. [DOI] [PMC free article] [PubMed] [Google Scholar]
- 13.Joti Y, Hikima T, Nishino Y, Kamada F, Hihara S, Takata H, Ishikawa T, Maeshima K. Chromosomes without a 30-nm chromatin fiber. Nucleus. 2012;3:404–10. doi: 10.4161/nucl.21222. [DOI] [PMC free article] [PubMed] [Google Scholar]
- 14.Fussner E, Strauss M, Djuric U, Li R, Ahmed K, Hart M, Ellis J, Bazett-Jones DP. Open and closed domains in the mouse genome are configured as 10-nm chromatin fibres. EMBO Rep. 2012;13:992–6. doi: 10.1038/embor.2012.139. [DOI] [PMC free article] [PubMed] [Google Scholar]
- 15.Gan L, Ladinsky MS, Jensen GJ. Chromatin in a marine picoeukaryote is a disordered assemblage of nucleosomes. Chromosoma. 2013 doi: 10.1007/s00412-013-0423-z. [DOI] [PMC free article] [PubMed] [Google Scholar]
- 16.Rigler R, Elson EL. Fluorescence Correlation Spectroscopy: Theory and Applications. Berlin: Springer Series in Chemical Physics; 2001. [Google Scholar]
- 17.Mütze J, Ohrt T, Schwille P. Fluorescence correlation spectroscopy in vivo. Laser & Photonics Reviews. 2011;5:52–67. doi: 10.1002/lpor.200910041. [DOI] [Google Scholar]
- 18.Harms GS, Cognet L, Lommerse PH, Blab GA, Schmidt T. Autofluorescent proteins in single-molecule research: applications to live cell imaging microscopy. Biophys J. 2001;80:2396–408. doi: 10.1016/S0006-3495(01)76209-1. [DOI] [PMC free article] [PubMed] [Google Scholar]
- 19.Schütz GJ, Kada G, Pastushenko VP, Schindler H. Properties of lipid microdomains in a muscle cell membrane visualized by single molecule microscopy. EMBO J. 2000;19:892–901. doi: 10.1093/emboj/19.5.892. [DOI] [PMC free article] [PubMed] [Google Scholar]
- 20.Sako Y, Minoghchi S, Yanagida T. Single-molecule imaging of EGFR signalling on the surface of living cells. Nat Cell Biol. 2000;2:168–72. doi: 10.1038/35004044. [DOI] [PubMed] [Google Scholar]
- 21.Metropolis N, Rosenbluth AW. M.N. R, Teller AH, Teller E. Equation of State Calculations by Fast Computing Machines J Chem Phys 1953; 21:1087 (6 pages). [Google Scholar]
- 22.Morelli MJ, ten Wolde PR. Reaction Brownian dynamics and the effect of spatial fluctuations on the gain of a push-pull network. J Chem Phys. 2008;129:054112. doi: 10.1063/1.2958287. [DOI] [PubMed] [Google Scholar]
- 23.Hihara S, Pack CG, Kaizu K, Tani T, Hanafusa T, Nozaki T, Takemoto S, Yoshimi T, Yokota H, Imamoto N, et al. Local nucleosome dynamics facilitate chromatin accessibility in living mammalian cells. Cell Rep. 2012;2:1645–56. doi: 10.1016/j.celrep.2012.11.008. [DOI] [PubMed] [Google Scholar]
- 24.Pack C, Saito K, Tamura M, Kinjo M. Microenvironment and effect of energy depletion in the nucleus analyzed by mobility of multiple oligomeric EGFPs. Biophys J. 2006;91:3921–36. doi: 10.1529/biophysj.105.079467. [DOI] [PMC free article] [PubMed] [Google Scholar]
- 25.Alberts B, Johnson A, Lewis J, Raff M, Roberts K, Walter P. Molecular Biology of the Cell. 5th ed, New York (NY): Garland Press; 2007. [Google Scholar]
- 26.Manders EM, Kimura H, Cook PR. Direct imaging of DNA in living cells reveals the dynamics of chromosome formation. J Cell Biol. 1999;144:813–21. doi: 10.1083/jcb.144.5.813. [DOI] [PMC free article] [PubMed] [Google Scholar]
- 27.Dross N, Spriet C, Zwerger M, Müller G, Waldeck W, Langowski J. Mapping eGFP oligomer mobility in living cell nuclei. PLoS One. 2009;4:e5041. doi: 10.1371/journal.pone.0005041. [DOI] [PMC free article] [PubMed] [Google Scholar]
- 28.Bancaud A, Huet S, Daigle N, Mozziconacci J, Beaudouin J, Ellenberg J. Molecular crowding affects diffusion and binding of nuclear proteins in heterochromatin and reveals the fractal organization of chromatin. EMBO J. 2009;28:3785–98. doi: 10.1038/emboj.2009.340. [DOI] [PMC free article] [PubMed] [Google Scholar]
- 29.Weidemann T, Wachsmuth M, Knoch TA, Müller G, Waldeck W, Langowski J. Counting nucleosomes in living cells with a combination of fluorescence correlation spectroscopy and confocal imaging. J Mol Biol. 2003;334:229–40. doi: 10.1016/j.jmb.2003.08.063. [DOI] [PubMed] [Google Scholar]
- 30.Daban JR. High concentration of DNA in condensed chromatin. Biochem Cell Biol. 2003;81:91–9. doi: 10.1139/o03-037. [DOI] [PubMed] [Google Scholar]
- 31.Wachsmuth M, Caudron-Herger M, Rippe K. Genome organization: balancing stability and plasticity. Biochim Biophys Acta. 2008;1783:2061–79. doi: 10.1016/j.bbamcr.2008.07.022. [DOI] [PubMed] [Google Scholar]
- 32.Wedemeier A, Merlitz H, Wu CX, Langowski J. How proteins squeeze through polymer networks: a Cartesian lattice study. J Chem Phys. 2009;131:064905. doi: 10.1063/1.3205100. [DOI] [PubMed] [Google Scholar]
- 33.Fritsch CC, Langowski J. Chromosome dynamics, molecular crowding, and diffusion in the interphase cell nucleus: a Monte Carlo lattice simulation study. Chromosome Res. 2011;19:63–81. doi: 10.1007/s10577-010-9168-1. [DOI] [PubMed] [Google Scholar]
- 34.Lippincott-Schwartz J, Patterson GH. Photoactivatable fluorescent proteins for diffraction-limited and super-resolution imaging. Trends Cell Biol. 2009;19:555–65. doi: 10.1016/j.tcb.2009.09.003. [DOI] [PMC free article] [PubMed] [Google Scholar]
- 35.Wiesmeijer K, Krouwels IM, Tanke HJ, Dirks RW. Chromatin movement visualized with photoactivable GFP-labeled histone H4. Differentiation. 2008;76:83–90. doi: 10.1111/j.1432-0436.2007.00234.x. [DOI] [PubMed] [Google Scholar]
- 36.Kimura H, Cook PR. Kinetics of core histones in living human cells: little exchange of H3 and H4 and some rapid exchange of H2B. J Cell Biol. 2001;153:1341–53. doi: 10.1083/jcb.153.7.1341. [DOI] [PMC free article] [PubMed] [Google Scholar]
- 37.Tokunaga M, Imamoto N, Sakata-Sogawa K. Highly inclined thin illumination enables clear single-molecule imaging in cells. Nat Methods. 2008;5:159–61. doi: 10.1038/nmeth1171. [DOI] [PubMed] [Google Scholar]
- 38.Rogers SS, Waigh TA, Zhao X, Lu JR. Precise particle tracking against a complicated background: polynomial fitting with Gaussian weight. Phys Biol. 2007;4:220–7. doi: 10.1088/1478-3975/4/3/008. [DOI] [PubMed] [Google Scholar]
- 39.Mazza D, Abernathy A, Golob N, Morisaki T, McNally JG. A benchmark for chromatin binding measurements in live cells. Nucleic Acids Res. 2012;40:e119. doi: 10.1093/nar/gks701. [DOI] [PMC free article] [PubMed] [Google Scholar]
- 40.Levi V, Ruan Q, Plutz M, Belmont AS, Gratton E. Chromatin dynamics in interphase cells revealed by tracking in a two-photon excitation microscope. Biophys J. 2005;89:4275–85. doi: 10.1529/biophysj.105.066670. [DOI] [PMC free article] [PubMed] [Google Scholar]
- 41.Cremer T, Kreth G, Koester H, Fink RH, Heintzmann R, Cremer M, Solovei I, Zink D, Cremer C. Chromosome territories, interchromatin domain compartment, and nuclear matrix: an integrated view of the functional nuclear architecture. Crit Rev Eukaryot Gene Expr. 2000;10:179–212. doi: 10.1615/CritRevEukarGeneExpr.v10.i2.60. [DOI] [PubMed] [Google Scholar]
- 42.Cremer T, Cremer C. Chromosome territories, nuclear architecture and gene regulation in mammalian cells. Nat Rev Genet. 2001;2:292–301. doi: 10.1038/35066075. [DOI] [PubMed] [Google Scholar]
- 43.Schermelleh L, Solovei I, Zink D, Cremer T. Two-color fluorescence labeling of early and mid-to-late replicating chromatin in living cells. Chromosome Res. 2001;9:77–80. doi: 10.1023/A:1026799818566. [DOI] [PubMed] [Google Scholar]
- 44.Berezney R, Malyavantham KS, Pliss A, Bhattacharya S, Acharya R. Spatio-temporal dynamics of genomic organization and function in the mammalian cell nucleus. Adv Enzyme Regul. 2005;45:17–26. doi: 10.1016/j.advenzreg.2005.02.013. [DOI] [PubMed] [Google Scholar]
- 45.Albiez H, Cremer M, Tiberi C, Vecchio L, Schermelleh L, Dittrich S, Küpper K, Joffe B, Thormeyer T, von Hase J, et al. Chromatin domains and the interchromatin compartment form structurally defined and functionally interacting nuclear networks. Chromosome Res. 2006;14:707–33. doi: 10.1007/s10577-006-1086-x. [DOI] [PubMed] [Google Scholar]
- 46.Nora EP, Lajoie BR, Schulz EG, Giorgetti L, Okamoto I, Servant N, Piolot T, van Berkum NL, Meisig J, Sedat J, et al. Spatial partitioning of the regulatory landscape of the X-inactivation centre. Nature. 2012;485:381–5. doi: 10.1038/nature11049. [DOI] [PMC free article] [PubMed] [Google Scholar]
- 47.Dixon JR, Selvaraj S, Yue F, Kim A, Li Y, Shen Y, Hu M, Liu JS, Ren B. Topological domains in mammalian genomes identified by analysis of chromatin interactions. Nature. 2012;485:376–80. doi: 10.1038/nature11082. [DOI] [PMC free article] [PubMed] [Google Scholar]
- 48.Sexton T, Yaffe E, Kenigsberg E, Bantignies F, Leblanc B, Hoichman M, Parrinello H, Tanay A, Cavalli G. Three-dimensional folding and functional organization principles of the Drosophila genome. Cell. 2012;148:458–72. doi: 10.1016/j.cell.2012.01.010. [DOI] [PubMed] [Google Scholar]
- 49.Jaqaman K, Loerke D, Mettlen M, Kuwata H, Grinstein S, Schmid SL, Danuser G. Robust single-particle tracking in live-cell time-lapse sequences. Nat Methods. 2008;5:695–702. doi: 10.1038/nmeth.1237. [DOI] [PMC free article] [PubMed] [Google Scholar]
Associated Data
This section collects any data citations, data availability statements, or supplementary materials included in this article.