

Abstract
Objective: We aimed to compare the potential for inducing HIV production and the effect on T-cell activation of potent HDAC inhibitors undergoing clinical investigation.
Design: In vitro study
Methods: The latently infected cell lines ACH2 and U1 were treated with the HDAC inhibitors panobinostat, givinostat, belinostat, vorinostat and valproic acid. Viral induction was estimated by p24 production. Peripheral blood mononuclear cells from uninfected donors were treated with the HDAC inhibitors and the expression of activation markers on T-cell phenotypes was measured using flow cytometry. Finally, the ability of givinostat, belinostat and panobinostat to reactivate latent HIV-1 expression in primary T-cells was investigated employing a CCL19-induced latent primary CD4+ T cell infection model.
Results: The various HDAC inhibitors displayed significant potency differences in stimulating HIV-1 expression from the latently infected cell lines with panobinostat > givinostat ≈belinostat > vorinostat > valproic acid. Panobinostat was significantly more potent than all other HDAC inhibitors and induced virus production even in the very low concentration range 8–31 nM. The proportion of primary T-cells expressing the early activation marker CD69 increased moderately in all HDAC inhibitor-treated cells compared with untreated cells. Finally, proof was obtained that panobinostat, givinostat and belinostat induce virus production in latently infected primary cells at therapeutic concentrations with panobinostat being the most potent stimulator.
Conclusion: At therapeutic concentrations panobinostat stimulate HIV-1 expression in latently infected cells with greater potency than other HDAC inhibitors undergoing clinical investigation. These findings warrant further investigation and panobinostat is now being advanced into clinical testing against latent HIV infection.
Keywords: HIV, histone deacetylase inhibitors, HIV eradication, HIV cure
Introduction
The inability of highly active antiretroviral treatment (HAART) to eradicate HIV-infection has renewed interest in the search for a cure. The primary barrier preventing eradication of HIV-infection by HAART is a pool of long-lived latently infected cells of which central and transitional memory CD4+ T-cells appear the most important.1 These latently infected cells harbor integrated proviral DNA capable of resuming HIV-expression2,3 and fuelling viral rebound in the absence of HAART, but in the inactive state are unrecognizable to the immune system and unresponsive to antiretroviral drugs. Several therapeutic strategies are considered in HIV-cure related research. One approach is to exploit the ability of histone deacetylase (HDAC) inhibitors to reactivate HIV-1 expression in latently infected cells in the presence of HAART.4 Following HIV-1 expression, the infected cells presumably die as a result of viral cytopathic effects and/or immune mediated killing leading to a progressive reduction in the size of the reservoir even though a recent report suggests that the HIV-specific cytolytic T-lymphocyte (CTL) response may need enhancement.5
In the transcriptionally silent state of latently infected resting CD4+ T-cells, various transcription factors recruit histone deacetylases to the HIV-1 5′ long-terminal repeat (LTR) where they induce chromatin condensation and repress proviral transcription by promoting deacetylation of lysine residues on histones.6-12 Consistent with the role histone deacetylases play in repressing transcription, HDAC inhibitors have consistently been shown to disrupt HIV-latency and induce virus HIV-1 expression in latently infected cell lines, latently infected primary T-cells and resting CD4+ T-cells isolated from HIV-infected donors.4,13-20 Valproic acid (VPA) was the first HDAC inhibitor to be tested in a clinical HIV-study. Here a reduction in resting cell infection was seen in 3 of 4 study subjects.21 Several follow-up studies, however, failed to demonstrate any sustainable effect from VPA treatment22-24 and it is possible that VPA’s in vivo HDAC inhibition is too weak. Two clinical trials have been initiated to evaluate whether vorinostat (SAHA), an FDA-approved potent HDAC inhibitor, can induce virus production in HIV-infected patients on suppressive HAART. Results from one of these studies were published recently showing that vorinostat disrupts HIV latency in vivo.25 Yet, other HDAC inhibitors in clinical development may offer advantages over vorinostat in terms of in vivo achievable HDAC inhibition. Belinostat (PXD101), givinostat (ITF2357) and panobinostat (LBH589) are all in phase II or III trials for the treatment of non-HIV diseases. Givinostat has been shown to suppress production of pro-inflammatory cytokines at nanomolar concentrations26 and was safely used to treat children with systemic onset juvenile arthritis.27 Panobinostat is an orally bioavailable hydroxamic acid-derived HDAC inhibitor that has been used in the treatment of malignancies28-31 and appears to be the most potent pan-HDAC inhibitor in clinical development.32
We speculated that there might be good alternatives to vorinostat among the new and potent HDAC inhibitors with regard to inducing virus production. Hence, in the present study we compared the potential for inducing HIV-1 expression and the effect on T-cell activation of several potent HDAC inhibitors undergoing clinical investigation. We demonstrate that panobinostat is considerably more potent than any other HDAC inhibitor tested. Indeed, panobinostat induces virus production in latently infected cell lines and primary T-cells at concentrations well below what is obtained with oral clinical dosing. These findings warrant further investigation and panobinostat is now being advanced into clinical testing against latent HIV infection.
Results
Stimulation of latently infected cell lines
The various HDAC inhibitors displayed significant potency differences in inducing HIV-1 expression from the latently infected cell lines U1 and ACH2 with panobinostat > givinostat ≈belinostat > vorinostat > VPA. Panobinostat was significantly more potent than all other HDAC inhibitors and showed great potential for inducing virus production even in the very low concentration range (Fig. 1A and B). To relate these data to the clinical use of each HDAC inhibitor, we estimated the relevant therapeutic concentration ranges using available information in the literature. With the lowest oral dosing schedule of panobinostat (20 mg), peak plasma concentrations are around 60 nM compared with in vivo achievable concentrations of 200–250 nM for givinostat,26 900–1000 nM for vorinostat4,25 and 0.25–0.6 mM for VPA.14 No data could be obtained on oral belinostat. Virus production was induced at much lower concentrations with panobinostat within the therapeutic range (Fig. 1C and D).

Figure 1. HIV-1 expression in U1 and ACH2 cells treated with HDAC inhibitors. HIV-1 expression in U1 and ACH2 cells treated with panobinostat (LBH589), belinostat (PXD101), givinostat (ITF2357), vorinostat (SAHA) and valproic acid (VPA) for 48 h; median +/− IQR p24 concentrations of 15 (ACH2) and 8 (U1) separate experiments in each cell line are depicted in graphs A and B. Comparison of median +/− IQR induced viral production with indicated concentrations of LBH589 or SAHA is shown in C and D. Capped lines above error bars indicate the range of therapeutic plasma levels for each HDAC inhibitor. Dotted line indicates p24 levels in untreated cells.
Compared with untreated cells, panobinostat at 15.6nM and 31.1nM increased median p24 levels 27.7-fold and 51.8-fold in ACH2 cells and 12.8-fold and 19.9-fold in U1 cells, respectively. This was significantly higher than vorinostat in a clinically relevant concentration range 250–500nM (p < 0.001 for all analyses, except p = 0.003 comparing panobinostat at 15.6nM with vorinostat at 500nM in ACH2 cells). Vorinostat at 250nM and 500nM increased median p24 levels 2.4-fold and 6.9-fold in ACH2 cells and 1.5-fold and 3.1-fold in U1 cells, respectively. In comparison, belinostat at 250nM increased median p24 levels 7.4-fold in the U1 cells and 18.3-fold in the in ACH2 cells, while givinostat at 250nM increased median p24 levels 9.2-fold in the U1 cells and 18.5-fold in the in ACH2 cells.
Based on the U1 and ACH2 stimulation data we computed the EC50-value for each HDAC inhibitor (shown in Table 1) and found that the Cmax/EC50 ratio of a 20 mg panobinostat dose is 3.3 (ACH2 cells) to 5.6 (U1 cells) fold higher than the Cmax/EC50 ratio of a 400 mg vorinostat dose.
Table 1. Calculated EC50 (in nM) of HDAC inhibitors.
| Belinostat | Givinostat | Vorinostat | Panobinostat | Valproate | |
|---|---|---|---|---|---|
| U1 cells | |||||
| EC50 (CI), nM | 274.7 (211.2–357.3) | 254.3 (192.2–336.0) | 1197 (818.7–1750) | 12.78 (11.22–14.56) | 1531000 (219049–1.070e+007) |
| ACH2 cells | |||||
| EC50 (CI), nM | 255.1 (Very wide) | 360 (218.6–592.9) | 885.3 (626.4–1251) | 15.95 (7.581–33.58) | 993029 (Very wide) |
The half maximal effective concentration (EC50) for each HDAC inhibitor in U1 and ACH2 cells normalized to PMA-induced viral production. CI, confidence interval.
Neither when measured with flow cytometry nor with luminescence-based CytoTox-Glo (Promega, USA) assay was there any notable cell death above background in freshly isolated peripheral blood mononuclear cells (PBMCs) (Fig. 2). We did, however, observe higher toxicity in U1 cells than in PBMCs, but these observations could not account for the ability of panobinostat to induce virus production in the low nM concentration range.

Figure 2. Toxicity in lymphocytes and U1 cells treated with HDAC inhibitors. PBMCs from healthy donors were treated with panobinostat (LBH589) (2–62.5nM), givinostat (ITF2357), belinostat (PXD101), vorinostat (SAHA) (all 62.5–500nM) and valproic acid (VPA) (0.5mM). Panel A shows cell death in lymphocytes evaluated with flow cytometry using viability stain. Only data from the highest concentration of HDAC inhibitor is shown in figure. Toxicity of panobinostat was evaluated in U1 cells using a similar experimental setup. Panel B shows cell death in U1 cells treated with panobinostat. DMSO was used as negative control and PMA as positive control.
T-cell activation and phenotype markers
The proportion of primary T-cells expressing the early activation marker CD69 increased moderately in HDAC inhibitor-treated cells compared with untreated cells with the same potency pattern as was seen with the cell line stimulations: panobinostat > givinostat ≈belinostat > vorinostat > VPA. Figure 3A shows the mean percentage expression of CD69 in CD4+ T-cells across the range of HDAC inhibitor concentrations with data from 5 separate experiments (VPA omitted from Fig. 3), while Figure 3B and C shows CD69 expression in various CD4+ T-cell subsets from one representative experiment. Analyses restricted to the central memory T cell (Tcm) subset yielded a similar pattern of moderately increased CD69 expression with increasing HDAC inhibitor concentration (Fig. 3B). As anticipated, the expression of CD69 in untreated cells followed the pattern of cell differentiation with naïve T-cells < Tcm < transitional memory T cells (Ttm) < effector memory T cells (Tem). HDAC inhibitor treatment, except VPA, induced moderate elevations in CD69 expression in all these subsets, including the Tcm and Ttm subsets that have been identified as the major cellular reservoirs for HIV1 (Fig. 3C). Pseudo color plots of CD69 expression are available as supplementary information (Fig. S1).

Figure 3. CD69 expression in CD4+ T-cells treated with HDAC inhibitors. PBMCs from healthy donors were treated 16 (CD69, CD45RA, CCR7, CD27) or 40 (CCR5, CXCR4) hours with panobinostat (LBH589) (2–62.5nM), givinostat (ITF2357), belinostat (PXD101), vorinostat (SAHA) (all 62.5–500nM) and valproic acid (VPA) (0.5mM). Expression of the early activation marker CD69 (n = 5), the phenotype markers CD45RA, CD27 and CC7 (n = 5) and the HIV co-receptors CCR5 and CXCR4 (n = 4) were assessed by flow cytometry. Mean +/− SEM percentage CD69 expression in CD4+ T-cells across the full range of concentrations used for panobinostat (LBH589), givinostat (ITF2357), belinostat (PXD101) and vorinostat (SAHA) (2–500nM is shown in Fig. 2A with data from 5 separate experiments. Dotted line indicates CD69 expression in untreated cells. CD69 expression in CD4+ central memory T-cells and T-cell subsets are shown in Figure 2B andC with data from one selected experiment. CD69 expression was analyzed in the CD4+ T-cell subsets: naive T-cells (CD45RA+, CD27+, CCR7+), central memory T-cells (CD45RA-, CD27+, CCR7+; Tcm), transitional memory T-cells (CD45RA-, CD27+, CCR7-; Ttm) and effector memory T-cells (CD45RA-, CD27-, CCR7-; Tem). Alterations in CCR5 expression are shown in Figure 2D, expressed as mean +/− SEM percentage of untreated cells with data from 4 separate experiments.
CCR5 expression on monocytes decreased following HDAC inhibitor treatment. This was statistically significant for belinostat, givinostat and panobinostat, but not VPA or vorinostat in the concentrations examined. On the contrary, expression of CXCR4 or CCR5 on CD4+ T-cells was unaffected by HDAC inhibitor treatment (Fig. 3D).
Stimulation of resting latently infected primary CD4+ T-cells
We tested the ability of givinostat, belinostat and panobinostat to induce virus production at therapeutic concentrations in a resting primary CD4+ T-cell model of HIV latency. Belinostat and givinostat were tested at 250 and 500 nM and panobinostat at 7.5 and 15 nM. We found that all 3 HDAC inhibitors stimulated HIV-1 expression at these concentrations to levels significantly higher than untreated control cultures (Fig. 4A). Notably, we observed the same hierarchy panobinostat > givinostat ≈belinostat in the resting primary CD4+ T cells as observed in the U1 and ACH2 cell lines. Thus, we provide proof that givinostat, belinostat and panobinostat have the capacity to induce viral gene expression in latently infected primary cells. Panobinostat, in particular, induced virus production at concentrations well below those achieved with standard oral dosing. Analyzing the induction of HIV from the primary infected CD4+ T cells with the HDAC inhibitors relative to phorbol-12-myristate-13-acetate (PMA)/Phytohaemagglutinin (PHA) stimulation suggests that the three HDAC inhibitors induce HIV expression ranging from 30–70% of that, which can be achieved with mitogenic stimuli (Fig. 4B).
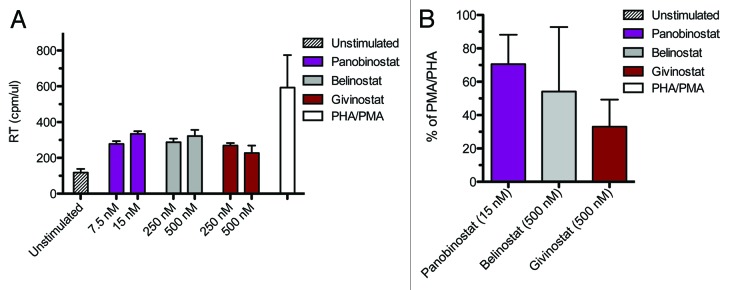
Figure 4. HIV-1 expression in latently infected primary CD4+ T cells. Panel A displays HIV-1 expression in latently infected resting CD4 T cells treated with panobinostat (LBH589), belinostat (PXD101), givinostat (ITF2357) and PMA/PHA for 72 h; mean +/− SEM RT/cpm. Panel B shows the percentage stimulation relative to the induction observed with PMA/PHA panobinostat (15 nM), belinostat (500 nM) and givinostat (500 nM); mean +/− SEM. Results are from two donors with each stimulation performed in duplicate.
Discussion
In this study we compared the potential for inducing HIV production and the effect on T-cell activation of a number of HDAC inhibitors undergoing clinical investigation. We found considerable potency differences with panobinostat being superior to all other HDAC inhibitors tested. This compound reactivated HIV-1 expression in latently infected cell lines and, more importantly, in latently infected primary CD4+ T-cells at concentrations as low as 8–32nM – well below the levels obtained with oral clinical dosing. Showing that therapeutic concentrations of panobinostat induce HIV-1 expression in latently infected cells, these findings provide rationale for a clinical study to assess the in vivo effect of panobinostat on virus production and the latent HIV-reservoir among HIV-infected patients on HAART.
Several other studies have investigated the ability of HDAC inhibitors to stimulate HIV-1 expression from latently infected cell lines, but only a limited number of compounds have been evaluated in primary T-cell models of HIV-latency or ex vivo in resting CD4+ T-cells from HIV-infected patients on suppressive HAART (reviewed in ref. 19). Thus, vorinostat, the most extensively studied HDAC inhibitor in HIV context, has consistently been shown to induce HIV production in latently infected cell lines and resting CD4+ T-cells from HIV-infected patients on suppressive HAART.4,13,19,33 Moreover, the first data showing that vorinostat disrupts HIV latency in vivo was published recently.25 In contrast, a recent study found that the levels of HIV production by HDAC inhibitor stimulated resting CD4+ T-cells from aviremic donors were not statistically significant from those of cells treated with media alone.34 In this study, therapeutic concentrations of the HDAC inhibitors vorinostat, VPA and oxamflatin were studied, but investigations did not include panobinostat, belinostat or givinostat. Of note, virion-associated HIV-RNA rather than cell-associated HIV-RNA was quantified and as the frequency of resting CD4+ T-cells carrying replication competent virus is as low as 1 per 106 cells, a large cell number must be evaluated for a robust read-out.
Givinostat has previously been shown to induce virus production in latently infected cell lines at therapeutic concentrations,14 but givinostat has not been evaluated in a primary T-cell model of HIV-latency and there is very limited data on panobinostat33 and belinostat20 with regard to their effect on HIV-latency. Notably, the significant potency variation between cell lines and primary T-cell models of HIV-latency emphasize the need to test the HDAC inhibitors in more than one system.33
Our results confirm the previous findings that givinostat induces virus production in latently infected cells at therapeutic concentrations.14 Hence, in light of the safety data from the use of givinostat in non-cancer patients27 this drug could be a future candidate for purging HIV-1 from the latent reservoir. In addition, givinostat inhibits production of pro-inflammatory cytokines and reduces systemic inflammation.26,35 This might prove beneficial as HIV-associated-inflammation is thought to contribute to maintaining HIV-latency. As seen previously14 we observed a marked decrease in CCR5 expression on monocytes with givinostat treatment and extend this finding to belinostat and panobinostat. However, CXCR4 expression and CCR5 expression on CD4+ T-cells were unaffected by HDAC inhibitor treatment. These results are reassuring as CCR5 density is an important driver for HIV-replication36 and upregulation of HIV entry co-receptors would be counterproductive for therapies that induce transcription of latent HIV-sequences.
Belinostat induced viral production in the latently infected cells lines at largely the same concentrations as givinostat. There is limited pharmacokinetic data published on the oral formulation of belinostat, but in study among 15 patients with malignant diseases aggressive dose-escalation resulted in peak plasma levels above 1000nM.37
More interesting is the impressive potency relative to therapeutic concentrations by which panobinostat stimulated HIV-1 expression in the latently infected cell lines and primary T-cells. Panobinostat is likely the most potent pan-HDAC inhibitor in clinical development and the elimination time of panobinostat is considerably longer than other HDAC inhibitor in clinical development.32 Accordingly, panobinostat display characteristics of prolonged histone hyper acetylation present 7 d after the second dose.32 This allows for dose reductions or intermittent dosing schedules to diminish the problematic thrombocytopenia seen with all HDAC inhibitors. In a previous study, concern was raised that future in vivo use of panobinostat may be limited as toxicity was observed in cell lines and resting CD4+ T-cells.19,33 However, neither by flow cytometry nor with the CytoTox Promega assay did we observe any notable toxicity in freshly isolated PBMCs treated with panobinostat. This discrepancy is probably in part explained by a cancer-cell specific cytotoxicity from panobinostat. In contrast to cancer cell lines, panobinostat is relatively sparring of healthy primary cells.32 For example, in patients with multiple myeloma panobinostat in concentrations up to 100nM did not significantly affect the viability of PBMCs or granulocytes.38 Accordingly, we did observe higher toxicity in cell lines than in PBMCs, but these observations could not account for the ability of panobinostat to induce virus production in the low nM concentration range. Other concerns relate to the non HIV-specific effects of HDAC inhibitors. Theoretically, these drugs could cause activation of endogenous retroviruses and/or DNA viruses, including CMV, hepatitis B virus and JC viruses. However, to date there is no evidence that the clinical use of HDAC inhibitors is associated with such reactivation.31,39 Moreover, in patients treated with panobinostat for cutaneous T-cell lymphoma (CTCL), microarray analysis of tumor samples revealed that approximately 5% of genes displayed altered expression with the majority being repressed.30 Interestingly, in all tested patients a total of 23 genes were commonly modified some of which modulate immune responses. However, as malignant cells are much more sensitive to HDAC inhibitors than normal human immune cells, and anti-tumor effects dominate over immunomodulatory effects when both cell types are present in vivo,40 gene expression modulation from panobinostat is likely much more pronounced in tumor samples than in healthy tissue. Finally, the authors of a recent study, assessing the off-target effects of vorinostat in human primary CD4+ T-cells using microarray gene expression analysis, concluded that vorinostat’s effect on transcription was sufficiently modest to support trials aiming to activate HIV replication as part of an eradication strategy.41
Based on previous experiences where interleukin-2 (IL-2) treatment combined with OKT3 led to cytokine-storm syndrome and irreversible CD4+ T-cell depletion,42 global T-cell activation is conceived harmful and should be avoided in HIV-eradication therapies. Therefore, the effects of HDAC inhibitors on T-cell activation are of interest for future clinical studies. However, whereas the role of HDAC inhibition has been widely studied in malignant cells, ongoing research is still attempting to unravel the effects of HDAC inhibitors on normal human immune function,43,44 including the intricate interactions of regulatory T-cells, antigen presenting cells and effector T-cells. This is an area of enormous complexity where both epigenetic and non-epigenetic effects may play a role.43 We found that increasing concentrations of all HDAC inhibitors induced moderate increases in CD69 expression, an early marker of T-cell activation, but the meaning of this finding is uncertain and certain limitations deserve mentioning. First, although including several activation markers such as CD38, HLA-DR or PD-1 would have increased the sensitivity of detecting T-cell activation, we only investigated CD69 to be able to analyze this activation marker in conjunction with T-cell phenotype markers and live/dead stain in a 6-color flow cytometry setup. CD69 was chosen over other activation markers due to its early expression during T-cell activation and its previously verified usefulness to monitor T-cell activation in vitro.45 However, CD69 expression occurs only transiently necessitating prompt handling during laboratory procedures. Second, the effect of HDAC inhibitors on CD69 expression appeared to be dependent on the background level of CD69 expression, i.e., in donors with low proportions of CD69+ T-cells HDAC inhibitors induced only minimal increases, whereas CD69 expression was more inducible in donor cells with higher background proportions of CD69+ T-cells. Finally, how increased CD69 expression might relate to the well-documented anti-inflammatory effects of HDAC inhibitors46,47 or to the previously observed early activation of CD4+ T-cells exerted by HDAC inhibitors through downregulating CD62L expression43 is uncertain. Clearly, it will be imperative to delineate the immunomodulatory effects of HDAC inhibitors on HIV-specific immunity in future research.
In a recent study, it was shown in vitro that HIV-1 specific CTL responses in HIV-infected individuals are insufficient to eliminate infected cells after virus reactivation, but that antigen-specific stimulation of patient CTLs lead to efficient killing of these cells.5 This suggests that immune enhancing strategies may need to accompany therapies designed to reactivate HIV-expression in latently infected cells, but the extent of induced virus production should also merit consideration. In this regard, it will be important to explore combinations of HDAC inhibitors with differing HDAC specificity and identify possible synergistic effects. Such treatment, if it can be administered safely, might induce virus production to a level that is recognized by CTLs in vivo. Also, the specific effects of HDAC inhibitor treatment on HIV-specific CD8+ immunity must be carefully evaluated in forthcoming HDAC inhibitor trials among HIV-infected patients.
HDAC inhibitors initially attracted attention in the oncology field due to their proapoptotic and cell cycle arrest actions on malignant cells, but how these effects relate to the activity on HIV production in terms of potency and side effects is largely unknown. The proapoptotic effects of HDAC inhibitors are exerted not only through direct histone acetylation and chromatin remodeling, but by pleiotropic cellular effects acting cooperatively to mediate potent antitumor activities.48 In addition, HDAC inhibitor effects vary depending on cell type and biochemical structure.19,48 Interestingly, cell line studies revealed that cells expressing HIV upon induction were more likely to undergo apoptosis than cells not expressing HIV49 indicating that HDAC inhibitors could display features of selective killing of HIV expressing cells corresponding to their tumor-cell-selective killing capacity. However, this remains to be shown in latently infected primary T cells. Chromatin immunoprecipitation assays have shown that the class I HDACs, HDAC1, 2 and 3, may be particularly important to maintaining latency.8,50 Therefore, HDAC inhibitors with specificity for class I HDACs are thought to contain less off-target effects than pan HDAC inhibitors, but this might also reduce potentially desirable pro-apoptotic effects.
We recognize several limitations of our study. First, we did not perform chromatin immunoprecipation (ChIP) assay to confirm histone acetylation in HDAC inhibitor treated cells. However, such analyses have been done extensively in previous studies4,30,35,37 proving that histone acetylation is a key mechanistic feature of the induced virus production seen with all the HDAC inhibitor tested. Second, latently infected cell lines poorly resemble the physiological conditions or the rarity of in vivo HIV-latency. For this reason we also tested panobinostat, givinostat and belinostat in a resting CD4+ T-cell model of HIV-latency and found similar results regarding relative potency, but there may still be differences to actual in vivo conditions. Notably, the read out in the resting CD4+ T-cell model was RT activity and not p24 levels as in the cell line studies. This was chosen to avoid deviating from the established protocol for the primary T cell model. Finally, in vitro exposure to the HDAC inhibitors may also differ from in vivo conditions with regard to tissue concentration, fluctuation and duration. We did not attempt to design the in vitro exposure according to specific data on dosing schedules, elimination or protein binding of each HDAC inhibitor, as we believe that such design would still be subject to many uncertainties and would not eliminate the limitations of extrapolating to physiological conditions.
In conclusion, we found that therapeutic concentrations of panobinostat, givinostat and belinostat stimulate HIV-1 expression in latently infected cell lines and resting primary T-cells with much higher potency than vorinostat and VPA. Panobinostat induces HIV production at very low concentrations, well below the plasma levels obtained with its clinical use in oncology trials. Based on these data we are conducting an investigator initiated clinical study to evaluate the in vivo ability of panobinostat to induce HIV-1 expression in latently infected cells and deplete the latent HIV-reservoir among patients on suppressive HAART.
Methods
Stimulation of latently infected cell lines
U1 cells and ACH2 cells (both obtained through the NIH AIDS Reagent Program) were seeded at 2 × 10⁵/well in a 96-well format in 100 uL RPMI media supplemented with 10% heat inactivated Fetal Bovine Serum (hiFBS) and 1% penicillin/streptomycin. HDAC inhibitor and PMA were added at desired concentrations in 100 uL media. Identical dimethyl sulfoxide (DMSO) levels were used for untreated control. All stimulations were performed in triplicate. 48 h later supernatants were harvested and left for inactivation in 1% Empegen for 1 h. Levels of HIV-1 p24 gag were determined by ELISA as described by the manufacturer (Aalto Bioreagents, Dublin, Ireland).
Activation of primary T lymphocytes
T cell activation upon HDAC inhibitor stimulation in vitro was assessed by measuring CD69 expression. CD69 was chosen over other activation markers due to its expression early during T cell activation. Briefly, PBMCs were purified using Ficoll Paque gradient centrifugation from fresh blood obtained from healthy donors. An amount of 5 × 10⁵ cells was stimulated by different concentrations of HDAC inhibitor in final volume of 500 uL RPMI media supplemented with 10% hiFBS and 1% pen/strep. After 16 h, cells were harvested and washed once in PBS. Cells were stained with Live-dead near IR at a final concentration of 2 uM (Invitrogen, Denmark) for 30 min on ice. Cells were then washed twice in PBS. Five uL Fc Block (Sigma, Denmark) at 10 mg/mL is added and incubated 10 min on ice. Subsequently, the cells were stained with 5 uL CD4 PerCPCy5.5, 5 uL CD27 PE-Cy7, 7 uL CD45RA FITC, 20 uL CCR7 PE (all antibodies from BD, USA) and 10 uL CD69 APC (BioLegend, USA) for 30 min on ice. Finally, cells were washed once in PBS and re-suspended in FACS flow buffer and stored on ice until analysis by flow cytometry on a FACS Canto II. Data was analyzed using FlowJo (TreeStar, USA).
Toxicity
To ascertain that the induced virus production was caused by stimulation of HIV-1 expression and not due to cell death, PBMCs from healthy donors were treated with givinostat, belinostat, vorinostat (all 62.5–500nM), panobinostat (2–500nM) and VPA (0.5mM). Proportions of live cells were analyzed using viability staining with Live-dead near IR at a final concentration of 2 uM (Invitrogen, Denmark) and analyzed by flow cytometry. As there may be a cancer cell specific toxicity from panobinostat, we performed similar toxicity analyses in U1 cells. CytoTox-Glo Cytotoxicity assay (Promega, USA) was used to evaluate cell death as described by the manufacturer. Briefly, 100.000 freshly isolated PBMCs obtained from healthy donors were plated in a 96-well plate and incubated with HDAC inhibitors for 18 h in a total of 100 uL RPMI media supplemented with 10% hiFBS and 1% pen/strep. 50 uL of CytoTox-Glo assay reagent was added and cells incubated for 15 min. Luminescence was measured on an Omega PolarStar (BMG Labtech, Germany). Fifty uL of Lysis reagent was added to all wells and incubated for 15 min. Luminescence was read again. Cell death was determined as Experimental luminescence/Total lysis luminescence × 100%.
Stimulation of resting latently infected primary CD4+ T-cells
We investigated the ability of givinostat, belinostat (250 and 500 nM) and panobinostat (7.5 and 15 nM) to reactivate latent HIV-1 in a CCL19-induced latent primary CD4+ T cell infection model as described previously.51,52 Briefly, resting CD4+ T cells were isolated from buffy coat using a negative bead selection strategy. Resting CD4+ T cells were incubated with 250 ng/mL CCL19 (R&D Systems, Australia) in RPMI with 10% hiFBS and 1% pen/strep for two days followed by infections with HIV-1 NL4–3 at 1 cpm (viral reverse transcriptase activity counts per minute) per cell for three hours. Cells were washed twice in media to remove residual virus. Subsequently, cells were maintained in media supplemented with 10 U/mL IL-2 for four days upon which re-stimulation with HDAC inhibitor or PMA (50 nM)/PHA (5 ug/mL) was performed. Supernatants were harvested three days post re-stimulation and viral production was measured using an RT activity assay.
Statistics
Induced HIV-1 expression was expressed as p24 levels or fold-increase compared with untreated cells. Comparison across HDAC inhibitors was done using the rank sum test. All reported P values are 2 tailed. To estimate the EC50 values of the HDAC inhibitors within each cell line, PMA-induced p24 production was defined as maximal and the p24 data was normalized according to this. Dose-response curves were constructed using a variable slope model (4 parameter dose-response curve); EC50 values and corresponding confidence intervals were estimated using nonlinear regression. All statistical analyses were performed in GraphPad Prism software (USA).
Supplementary Material
Author Contributions
T.A.R. and M.T. designed the study, performed data analysis and drafted the manuscript. M.T. performed stimulation studies with latently infected cell lines and the resting primary T-cell model. C.R.B. and J.M. performed flow cytometry and analyzed data, revised the manuscript and approved it for publication. O.S.S. and L.Ø. participated in the design of the study, participated in the data analyses, revised the manuscript and approved it for submission. F.W. and S.L. designed and participated in conducting stimulation studies with the resting primary T-cell model, revised the manuscript and approved it for publication. C.D. participated in the design of the study, performed data analyses, revised the manuscript and approved it for publication.
Submitted
11/15/12
Revised
01/22/13
Accepted
01/27/13
Disclosure of Potential Conflicts of Interest
The Aids Foundation, Denmark; The Institute of Clinical Medicine, Aarhus University; and The Hede Nielsen Foundation, Denmark, funded the study. Italfarmaco S.p.A. delivered ITF2357 (givinostat) free of charge for use in this study. S.L. has received institutional research grants from Merck, Gilead and Janssen and has received institutional payment for lectures/educational services from Gilead, Viiv and Merck. L.Ø. has received consultancy and speaker's fee from: Abbott, MSD, Pfizer, Bristol-Meyer Squibb, GlaxoSmithKline, ViiV Healthcare, Gilead and Tibotec. For the remaining authors, no conflicts of interest were declared.
Footnotes
Previously published online: www.landesbioscience.com/journals/vaccines/article/23800
References
- 1.Chomont N, El-Far M, Ancuta P, Trautmann L, Procopio FA, Yassine-Diab B, et al. HIV reservoir size and persistence are driven by T cell survival and homeostatic proliferation. Nat Med. 2009;15:893–900. doi: 10.1038/nm.1972. [DOI] [PMC free article] [PubMed] [Google Scholar]
- 2.Chun TW, Finzi D, Margolick J, Chadwick K, Schwartz D, Siliciano RF. In vivo fate of HIV-1-infected T cells: quantitative analysis of the transition to stable latency. Nat Med. 1995;1:1284–90. doi: 10.1038/nm1295-1284. [DOI] [PubMed] [Google Scholar]
- 3.Chun TW, Stuyver L, Mizell SB, Ehler LA, Mican JA, Baseler M, et al. Presence of an inducible HIV-1 latent reservoir during highly active antiretroviral therapy. Proc Natl Acad Sci U S A. 1997;94:13193–7. doi: 10.1073/pnas.94.24.13193. [DOI] [PMC free article] [PubMed] [Google Scholar]
- 4.Archin NM, Espeseth A, Parker D, Cheema M, Hazuda D, Margolis DM. Expression of latent HIV induced by the potent HDAC inhibitor suberoylanilide hydroxamic acid. AIDS Res Hum Retroviruses. 2009;25:207–12. doi: 10.1089/aid.2008.0191. [DOI] [PMC free article] [PubMed] [Google Scholar]
- 5.Shan L, Deng K, Shroff NS, Durand CM, Rabi SA, Yang HC, et al. Stimulation of HIV-1-specific cytolytic T lymphocytes facilitates elimination of latent viral reservoir after virus reactivation. Immunity. 2012;36:491–501. doi: 10.1016/j.immuni.2012.01.014. [DOI] [PMC free article] [PubMed] [Google Scholar]
- 6.Van Lint C, Emiliani S, Ott M, Verdin E. Transcriptional activation and chromatin remodeling of the HIV-1 promoter in response to histone acetylation. EMBO J. 1996;15:1112–20. [PMC free article] [PubMed] [Google Scholar]
- 7.Coull JJ, Romerio F, Sun JM, Volker JL, Galvin KM, Davie JR, et al. The human factors YY1 and LSF repress the human immunodeficiency virus type 1 long terminal repeat via recruitment of histone deacetylase 1. J Virol. 2000;74:6790–9. doi: 10.1128/JVI.74.15.6790-6799.2000. [DOI] [PMC free article] [PubMed] [Google Scholar]
- 8.Williams SA, Chen LF, Kwon H, Ruiz-Jarabo CM, Verdin E, Greene WC. NF-kappaB p50 promotes HIV latency through HDAC recruitment and repression of transcriptional initiation. EMBO J. 2006;25:139–49. doi: 10.1038/sj.emboj.7600900. [DOI] [PMC free article] [PubMed] [Google Scholar]
- 9.Imai K, Okamoto T. Transcriptional repression of human immunodeficiency virus type 1 by AP-4. J Biol Chem. 2006;281:12495–505. doi: 10.1074/jbc.M511773200. [DOI] [PubMed] [Google Scholar]
- 10.Jiang G, Espeseth A, Hazuda DJ, Margolis DM. c-Myc and Sp1 contribute to proviral latency by recruiting histone deacetylase 1 to the human immunodeficiency virus type 1 promoter. J Virol. 2007;81:10914–23. doi: 10.1128/JVI.01208-07. [DOI] [PMC free article] [PubMed] [Google Scholar]
- 11.Lusic M, Marcello A, Cereseto A, Giacca M. Regulation of HIV-1 gene expression by histone acetylation and factor recruitment at the LTR promoter. EMBO J. 2003;22:6550–61. doi: 10.1093/emboj/cdg631. [DOI] [PMC free article] [PubMed] [Google Scholar]
- 12.Tyagi M, Karn J. CBF-1 promotes transcriptional silencing during the establishment of HIV-1 latency. EMBO J. 2007;26:4985–95. doi: 10.1038/sj.emboj.7601928. [DOI] [PMC free article] [PubMed] [Google Scholar]
- 13.Contreras X, Schweneker M, Chen CS, McCune JM, Deeks SG, Martin J, et al. Suberoylanilide hydroxamic acid reactivates HIV from latently infected cells. J Biol Chem. 2009;284:6782–9. doi: 10.1074/jbc.M807898200. [DOI] [PMC free article] [PubMed] [Google Scholar]
- 14.Matalon S, Palmer BE, Nold MF, Furlan A, Kassu A, Fossati G, et al. The histone deacetylase inhibitor ITF2357 decreases surface CXCR4 and CCR5 expression on CD4(+) T-cells and monocytes and is superior to valproic acid for latent HIV-1 expression in vitro. J Acquir Immune Defic Syndr. 2010;54:1–9. doi: 10.1097/QAI.0b013e3181d3dca3. [DOI] [PMC free article] [PubMed] [Google Scholar]
- 15.Reuse S, Calao M, Kabeya K, Guiguen A, Gatot JS, Quivy V, et al. Synergistic activation of HIV-1 expression by deacetylase inhibitors and prostratin: implications for treatment of latent infection. PLoS One. 2009;4:e6093. doi: 10.1371/journal.pone.0006093. [DOI] [PMC free article] [PubMed] [Google Scholar]
- 16.Choi BS, Lee HS, Oh YT, Hyun YL, Ro S, Kim SS, et al. Novel histone deacetylase inhibitors CG05 and CG06 effectively reactivate latently infected HIV-1. AIDS. 2010;24:609–11. doi: 10.1097/QAD.0b013e328333bfa1. [DOI] [PubMed] [Google Scholar]
- 17.Ylisastigui L, Archin NM, Lehrman G, Bosch RJ, Margolis DM. Coaxing HIV-1 from resting CD4 T cells: histone deacetylase inhibition allows latent viral expression. AIDS. 2004;18:1101–8. doi: 10.1097/00002030-200405210-00003. [DOI] [PubMed] [Google Scholar]
- 18.Yin H, Zhang Y, Zhou X, Zhu H. Histonedeacetylase inhibitor Oxamflatin increase HIV-1 transcription by inducing histone modification in latently infected cells. Mol Biol Rep. 2011;38:5071–8. doi: 10.1007/s11033-010-0653-6. [DOI] [PubMed] [Google Scholar]
- 19.Wightman F, Ellenberg P, Churchill M, Lewin SR. HDAC inhibitors in HIV. Immunol Cell Biol. 2012;90:47–54. doi: 10.1038/icb.2011.95. [DOI] [PubMed] [Google Scholar]
- 20.Matalon S, Rasmussen TA, Dinarello CA. Histone deacetylase inhibitors for purging HIV-1 from the latent reservoir. Mol Med. 2011;17:466–72. doi: 10.2119/molmed.2011.00076. [DOI] [PMC free article] [PubMed] [Google Scholar]
- 21.Lehrman G, Hogue IB, Palmer S, Jennings C, Spina CA, Wiegand A, et al. Depletion of latent HIV-1 infection in vivo: a proof-of-concept study. Lancet. 2005;366:549–55. doi: 10.1016/S0140-6736(05)67098-5. [DOI] [PMC free article] [PubMed] [Google Scholar]
- 22.Archin NM, Cheema M, Parker D, Wiegand A, Bosch RJ, Coffin JM, et al. Antiretroviral intensification and valproic acid lack sustained effect on residual HIV-1 viremia or resting CD4+ cell infection. PLoS One. 2010;5:e9390. doi: 10.1371/journal.pone.0009390. [DOI] [PMC free article] [PubMed] [Google Scholar]
- 23.Archin NM, Eron JJ, Palmer S, Hartmann-Duff A, Martinson JA, Wiegand A, et al. Valproic acid without intensified antiviral therapy has limited impact on persistent HIV infection of resting CD4+ T cells. AIDS. 2008;22:1131–5. doi: 10.1097/QAD.0b013e3282fd6df4. [DOI] [PMC free article] [PubMed] [Google Scholar]
- 24.Routy JP, Tremblay CL, Angel JB, Trottier B, Rouleau D, Baril JG, et al. Valproic acid in association with highly active antiretroviral therapy for reducing systemic HIV-1 reservoirs: results from a multicentre randomized clinical study. HIV Med. 2012;13:291–6. doi: 10.1111/j.1468-1293.2011.00975.x. [DOI] [PubMed] [Google Scholar]
- 25.Archin NM, Liberty AL, Kashuba AD, Choudhary SK, Kuruc JD, Crooks AM, et al. Administration of vorinostat disrupts HIV-1 latency in patients on antiretroviral therapy. Nature. 2012;487:482–5. doi: 10.1038/nature11286. [DOI] [PMC free article] [PubMed] [Google Scholar]
- 26.Furlan A, Monzani V, Reznikov LL, Leoni F, Fossati G, Modena D, et al. Pharmacokinetics, safety and inducible cytokine responses during a phase 1 trial of the oral histone deacetylase inhibitor ITF2357 (givinostat) Mol Med. 2011;17:353–62. doi: 10.2119/molmed.2011.00020. [DOI] [PMC free article] [PubMed] [Google Scholar]
- 27.Vojinovic J, Dinarello CA, Damjano N, Oldoni T. Safety and Efficacy of Oral ITF2357 in Patients with Active Systemic Onset Juvenile Idiopathic Arthritis (SOJIA) - Results of a Phase II, Open Label, International, Multicentre Clinical Trial. Abstract 2008 Annual Scientific Meeting, American College of Rheumatology 2008. [Google Scholar]
- 28.Rathkopf D, Wong BY, Ross RW, Anand A, Tanaka E, Woo MM, et al. A phase I study of oral panobinostat alone and in combination with docetaxel in patients with castration-resistant prostate cancer. Cancer Chemother Pharmacol. 2010;66:181–9. doi: 10.1007/s00280-010-1289-x. [DOI] [PubMed] [Google Scholar]
- 29.Dickinson M, Ritchie D, DeAngelo DJ, Spencer A, Ottmann OG, Fischer T, et al. Preliminary evidence of disease response to the pan deacetylase inhibitor panobinostat (LBH589) in refractory Hodgkin Lymphoma. Br J Haematol. 2009;147:97–101. doi: 10.1111/j.1365-2141.2009.07837.x. [DOI] [PubMed] [Google Scholar]
- 30.Ellis L, Pan Y, Smyth GK, George DJ, McCormack C, Williams-Truax R, et al. Histone deacetylase inhibitor panobinostat induces clinical responses with associated alterations in gene expression profiles in cutaneous T-cell lymphoma. Clin Cancer Res. 2008;14:4500–10. doi: 10.1158/1078-0432.CCR-07-4262. [DOI] [PubMed] [Google Scholar]
- 31.Prince HM, Bishton MJ, Harrison SJ. Clinical studies of histone deacetylase inhibitors. Clin Cancer Res. 2009;15:3958–69. doi: 10.1158/1078-0432.CCR-08-2785. [DOI] [PubMed] [Google Scholar]
- 32.Prince HM, Bishton MJ, Johnstone RW. Panobinostat (LBH589): a potent pan-deacetylase inhibitor with promising activity against hematologic and solid tumors. Future Oncol. 2009;5:601–12. doi: 10.2217/fon.09.36. [DOI] [PubMed] [Google Scholar]
- 33.Wightman F, Ramanayake S, Saleh S, Solomon A, Dear A, Shebu-Xhilaga M, et al. Potency and Toxicity of HDACi and Other Immune Activators in Inducing HIV Production Using a Primary Resting T Cell Model of HIV Latency. Conference on Retroviruses and Opportunistic Infections. Boston, 2011. [Google Scholar]
- 34.Blazkova J, Chun TW, Belay BW, Murray D, Justement JS, Funk EK, et al. Effect of histone deacetylase inhibitors on HIV production in latently infected, resting CD4(+) T cells from infected individuals receiving effective antiretroviral therapy. J Infect Dis. 2012;206:765–9. doi: 10.1093/infdis/jis412. [DOI] [PMC free article] [PubMed] [Google Scholar]
- 35.Leoni F, Fossati G, Lewis EC, Lee JK, Porro G, Pagani P, et al. The histone deacetylase inhibitor ITF2357 reduces production of pro-inflammatory cytokines in vitro and systemic inflammation in vivo. Mol Med. 2005;11:1–15. doi: 10.2119/2006-00005.Dinarello. [DOI] [PMC free article] [PubMed] [Google Scholar]
- 36.Heredia A, Gilliam B, DeVico A, Le N, Bamba D, Flinko R, et al. CCR5 density levels on primary CD4 T cells impact the replication and Enfuvirtide susceptibility of R5 HIV-1. AIDS. 2007;21:1317–22. doi: 10.1097/QAD.0b013e32815278ea. [DOI] [PubMed] [Google Scholar]
- 37.Steele NL, Plumb JA, Vidal L, Tjørnelund J, Knoblauch P, Buhl-Jensen P, et al. Pharmacokinetic and pharmacodynamic properties of an oral formulation of the histone deacetylase inhibitor Belinostat (PXD101) Cancer Chemother Pharmacol. 2011;67:1273–9. doi: 10.1007/s00280-010-1419-5. [DOI] [PubMed] [Google Scholar]
- 38.Maiso P, Carvajal-Vergara X, Ocio EM, López-Pérez R, Mateo G, Gutiérrez N, et al. The histone deacetylase inhibitor LBH589 is a potent antimyeloma agent that overcomes drug resistance. Cancer Res. 2006;66:5781–9. doi: 10.1158/0008-5472.CAN-05-4186. [DOI] [PubMed] [Google Scholar]
- 39.Lewin SR, Rouzioux C. HIV cure and eradication: how will we get from the laboratory to effective clinical trials? AIDS. 2011;25:885–97. doi: 10.1097/QAD.0b013e3283467041. [DOI] [PubMed] [Google Scholar]
- 40.Vo DD, Prins RM, Begley JL, Donahue TR, Morris LF, Bruhn KW, et al. Enhanced antitumor activity induced by adoptive T-cell transfer and adjunctive use of the histone deacetylase inhibitor LAQ824. Cancer Res. 2009;69:8693–9. doi: 10.1158/0008-5472.CAN-09-1456. [DOI] [PMC free article] [PubMed] [Google Scholar]
- 41.Beliakova-Bethell N, Zhang JX, Singhania A, Lee V, Terry VH, Richman DD, et al. Suberoylanilide hydroxamic acid induces limited changes in the transcriptome of primary CD4(+) T cells. AIDS. 2013;27:29–37. doi: 10.1097/QAD.0b013e32835b3e26. [DOI] [PMC free article] [PubMed] [Google Scholar]
- 42.van Praag RM, Prins JM, Roos MT, Schellekens PT, Ten Berge IJ, Yong SL, et al. OKT3 and IL-2 treatment for purging of the latent HIV-1 reservoir in vivo results in selective long-lasting CD4+ T cell depletion. J Clin Immunol. 2001;21:218–26. doi: 10.1023/A:1011091300321. [DOI] [PubMed] [Google Scholar]
- 43.Akimova T, Beier UH, Liu Y, Wang L, Hancock WW. Histone/protein deacetylases and T-cell immune responses. Blood. 2012;119:2443–51. doi: 10.1182/blood-2011-10-292003. [DOI] [PMC free article] [PubMed] [Google Scholar]
- 44.Song W, Tai YT, Tian Z, Hideshima T, Chauhan D, Nanjappa P, et al. HDAC inhibition by LBH589 affects the phenotype and function of human myeloid dendritic cells. Leukemia. 2011;25:161–8. doi: 10.1038/leu.2010.244. [DOI] [PMC free article] [PubMed] [Google Scholar]
- 45.Krowka JF, Cuevas B, Maron DC, Steimer KS, Ascher MS, Sheppard HW. Expression of CD69 after in vitro stimulation: a rapid method for quantitating impaired lymphocyte responses in HIV-infected individuals. J Acquir Immune Defic Syndr Hum Retrovirol. 1996;11:95–104. doi: 10.1097/00042560-199601010-00013. [DOI] [PubMed] [Google Scholar]
- 46.Dinarello CA, Fossati G, Mascagni P. Histone deacetylase inhibitors for treating a spectrum of diseases not related to cancer. Mol Med. 2011;17:333–52. doi: 10.2119/molmed.2011.00116. [DOI] [PMC free article] [PubMed] [Google Scholar]
- 47.Grabiec AM, Tak PP, Reedquist KA. Function of histone deacetylase inhibitors in inflammation. Crit Rev Immunol. 2011;31:233–63. doi: 10.1615/CritRevImmunol.v31.i3.40. [DOI] [PubMed] [Google Scholar]
- 48.Bolden JE, Peart MJ, Johnstone RW. Anticancer activities of histone deacetylase inhibitors. Nat Rev Drug Discov. 2006;5:769–84. doi: 10.1038/nrd2133. [DOI] [PubMed] [Google Scholar]
- 49.Shehu-Xhilaga M, Rhodes D, Wightman F, Liu HB, Solomon A, Saleh S, et al. The novel histone deacetylase inhibitors metacept-1 and metacept-3 potently increase HIV-1 transcription in latently infected cells. AIDS. 2009;23:2047–50. doi: 10.1097/QAD.0b013e328330342c. [DOI] [PubMed] [Google Scholar]
- 50.Keedy KS, Archin NM, Gates AT, Espeseth A, Hazuda DJ, Margolis DM. A limited group of class I histone deacetylases acts to repress human immunodeficiency virus type 1 expression. J Virol. 2009;83:4749–56. doi: 10.1128/JVI.02585-08. [DOI] [PMC free article] [PubMed] [Google Scholar]
- 51.Saleh S, Solomon A, Wightman F, Xhilaga M, Cameron PU, Lewin SR. CCR7 ligands CCL19 and CCL21 increase permissiveness of resting memory CD4+ T cells to HIV-1 infection: a novel model of HIV-1 latency. Blood. 2007;110:4161–4. doi: 10.1182/blood-2007-06-097907. [DOI] [PubMed] [Google Scholar]
- 52.Saleh S, Wightman F, Ramanayake S, Alexander M, Kumar N, Khoury G, et al. Expression and reactivation of HIV in a chemokine induced model of HIV latency in primary resting CD4+ T cells. Retrovirology. 2011;8:80. doi: 10.1186/1742-4690-8-80. [DOI] [PMC free article] [PubMed] [Google Scholar]
Associated Data
This section collects any data citations, data availability statements, or supplementary materials included in this article.