

Abstract
Imatinib induces a complete cytogenetic regression in a large percentage of patients affected by chronic myeloid leukemia (CML) until mutations in the kinase domain of BCR-ABL appear. Alternative strategies for CML patients include the inhibition of phosphatidylinositol 3-kinase (PI3K)-Akt-mammalian target of rapamycin (mTOR) pathway, which is constitutively activated in leukemia cells and seems important for the regulation of cell proliferation, viability, and autophagy. In this study, we verified the effect of imatinib mesylate (IM), alone or in association with LY294002 (LY) (a specific PI3K protein tyrosine kinase inhibitor) or 4-amino-5-(4-methylphenyl)-7-(t-butyl)pyrazolo[3,4-d]-pyrimidine (PP1) (a Src tyrosine kinase inhibitor), on viability, intracellular calcium mobilization, apoptosis, and autophagy, in order to verify possible mechanisms of interaction. Our data demonstrated that PP1 and LY interact synergistically with IM by inducing apoptosis and autophagy in Bcr/Abl+ leukemia cells and this mechanism is related to the stress of the endoplasmic reticulum (ER). Our findings suggest a reasonable relationship between apoptotic and autophagic activity of tyrosine kinase inhibitors (TKIs) and the functionality of smooth ER Ca2+-ATPase and inositol triphosphate receptors, independently of intracellular calcium levels. Therapeutic strategies combining imatinib with PI3K and/or Src kinase inhibitors warrant further investigations in Bcr/Abl+ malignancies, particularly in the cases of imatinib mesylate-resistant disease.
Keywords: chronic myeloid leukemia, imatinib mesylate, PI3K inhibitor, Src kinase inhibitor, intracellular calcium [Ca2+]i, apoptosis, autophagy
Introduction
Therapeutic treatment with imatinib, a small-molecule drug that competitively inhibits the binding of ATP to the BCR-ABL tyrosine kinase, involves a complete cytogenetic regression of a large percentage of CML-treated patients1-3 but is ineffective in treating cases of patients with mutations in the kinase domains (Y253F/H; E255K/V; T315I; H396P/R43,44; M244V; M351T o F359V), for which the daily dose needs to be increased.4-9 In addition to increasing dosage, the search for and selection of new tyrosine kinase inhibitors is of great interest.10-13
Approaches to overcome drug resistance combine imatinib mesylate with other signaling inhibitors, such as flavopiridol,14 farnesyltransferase inhibitors,15 histone deacetylase inhibitors,16 and Akt inhibitors.17 It is commonly believed that the RAS/RAF-1/MEK1/2/ERK1/2 signaling pathway mediates survival signaling in several transformed cell types, including Bcr/Abl+ leukemia cells.18,19 Such findings have prompted the clinical development of several pharmacological MEK1/2 inhibitors, including PD184352 (or CI-1040), PD032591, and AZD6244 (ARRY142886).20-23 Results obtained from early clinical trials indicate that it is feasible to achieve the interruption of MEK1/2/ERK1/2 pathway with desired pharmacodynamics effect (e.g., ERK1/2 inactivation), giving benefits to Bcr/Abl+ leukemia cells, including those resistant to imatinib mesylate.20,24 New therapeutic approaches are thus warranted,25 and inhibition of the phosphatidylinositol 3-kinase (PI3K)-Akt-mammalian target of rapamycin (mTOR) pathway may become a future strategy, since this pathway is constitutively activated in the leukemia cells of most patients and seems important for the regulation of cell proliferation, viability, and autophagy.26-28 The PI3K/AKT/mTOR pathway is important for intracellular signaling of apoptosis in cancers29-32 such as breast,33 and non-small cell lung cancers.34
It has been widely demonstrated that Ca2+ signaling plays a pivotal role in proliferation of cancer cells. Several studies have demonstrated that even minor disruptions in either total Ca2+ levels or subcellular distribution can modulate the apoptotic response to a large number of stimuli. In most cell types, the endoplasmatic reticulum is the primary intracellular store of Ca2+, where it participates in the folding, modification, and sorting of newly synthesized proteins. Homeostasis between Ca2+ stores and cytosolic Ca2+ is maintained by ER-resident channels and transporters. The primary mechanism for ER Ca2+ influx is the smooth ER Ca2+-ATPase (SERCA), which mediates store filling. The release of Ca2+ from the ER is mediated by the inositol triphosphate receptor (IP3R). Recent studies suggest that IP3R-activated depletion of ER stores is also involved in the regulation of Ca2+ influx from the extracellular environment, a phenomenon known as capacitative Ca2+ influx.35
We have previously demonstrated that peripheral blood mononuclear cells derived from patients affected by chronic myeloid leukemia (CML) showed a deregulated calcium homeostasis and oxidative stress36 and that IM treatment, in vivo and in vitro, was able to modulate the intracellular calcium concentration of peripheral blood mononuclear cells of CML patients by acting at the level of InsP3 receptor in the endoplasmic reticulum as well as at level of the purinergic receptors on plasma membrane.
The role of Ca2+ in the regulation of autophagy has been investigated since 1993.37 This study indicated that both an increase and a decrease in the cytosolic [Ca2+]i was able to suppress autophagy. Further reports did not clarify the complex role of Ca2+ in autophagy, and apparently contrasting results have been published.38 In fact, Gordon et al. demonstrated that in hepatocytes of rats, agents such as thapsigargin (TG), 2,6-di-(tert-butyl)-1,4-benzohydroquinone (tBuBHQ), and ionomycin, that increase cytosolic Ca2+ levels by releasing Ca2+ from intracellular stores, strongly inhibit autophagy. These results suggest that depletion of sequestered Ca2+ from intracellular stores rather than cytosolic Ca2+ is a common mechanism of inhibition. Recently, Decuypere et al. demonstrated that in Hela cells a tight interrelation between intracellular Ca2+ signaling and autophagy stimulation. Ins(1,4,5)P3R-mediated Ca2+ signaling was critical for autophagy stimulation, since the Ca2+ chelator BAPTA-AM as well as the xestospongin B (Ins[1,4,5]P3R inhibitor) abolished the increase of LC3-mediated lipidation.39
Previous findings reported that cytosolic Ca2+ may stimulate autophagy, but these studies predominantly involved Ca2+-mobilizing triggers such as ionomycin (IONO), TG or Cd2+.40-42 These treatments led to disruption of intracellular Ca2+ homeostasis and subsequent stimulation of autophagy through a Ca2+-dependent pathway.
The purpose of this work was to study, in K562 cells and peripheral blood mononuclear cells from newly diagnosed CML patients (CML-PBM), the effect of imatinib mesylate (IM), a specific and potent BCR/ABL protein tyrosine kinase inhibitor, alone or in association with LY294002 (LY) (a specific PI3K protein tyrosine kinase inhibitor) or 4-Amino-5-(4-methylphenyl)-7-(t-butyl)pyrazolo[3,4-d]-pyrimidine (PP1) (a Src tyrosine kinase inhibitor), on viability, mobilization of intracellular calcium, apoptosis, and autophagy in order to verify possible mechanism of interaction.
Results
Cytotoxicity of TKIs in K562 and CML-PBL cells
In a first series of experiments we examined the cytotoxic effects of IM, PP1, and LY. K562 or CML-PBL cells were incubated with drugs for 24 h, and the cytotoxicity was determined by MTT assay (Fig. 1).
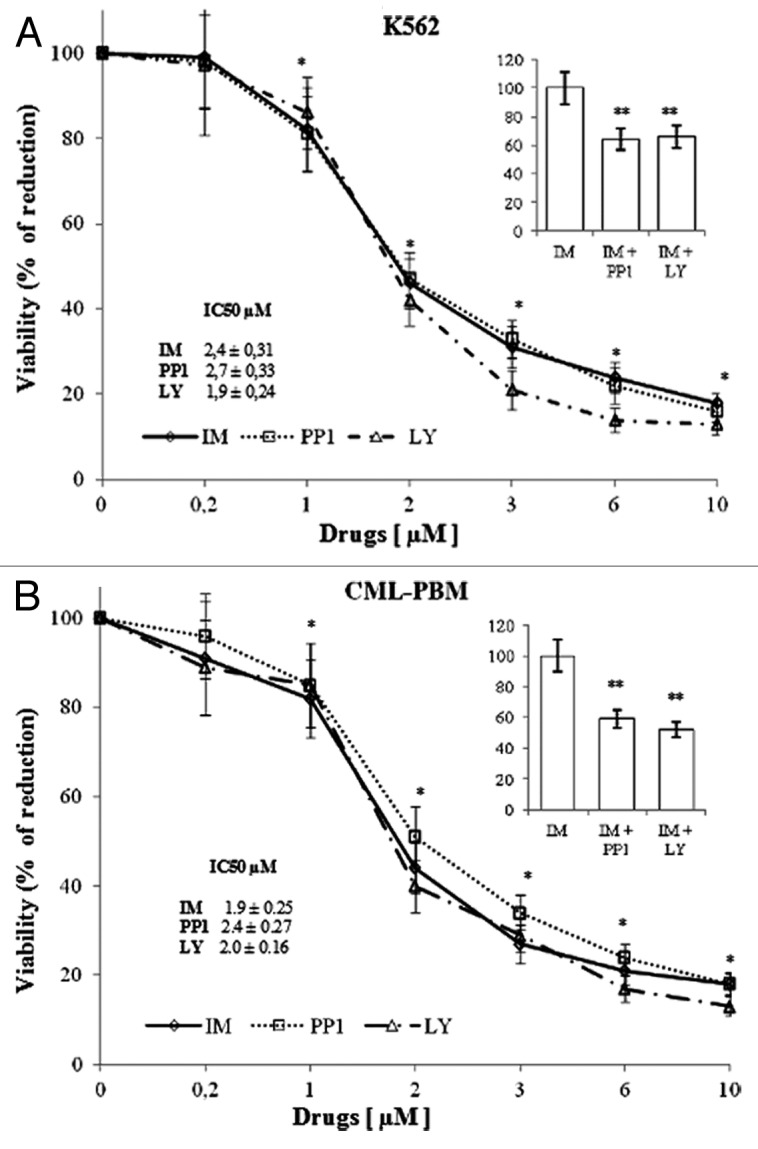
Figure 1. Cytotoxic effect of IM, PP1 and LY in K562 or CML-PBM cells. Increasing concentrations (range 0.2–10 µM) of IM, PP1, or LY were incubated with 106 of K562 or CML-PBM cells for 24 h at 37 °C in humidified atmosphere of 5% carbon dioxide in air. Data represent the mean of 4 independent experiments each in duplicate; bar represent S.D. (*P < 0.05 vs. control cells). (A and B) 106 of K562 or CML-PBM were incubated with 1 µM of IM alone or in association with equimolecular concentrations of PP1 or LY. Data represent the % variation respect IM alone. (**P < 0.05 vs. IM alone).
The IC50 of IM, PP1, and LY were, respectively, 2.4 ± 0.31, 2.7 ± 0.33, and 1.9 ± 0.24 µM in K562 and 1.9 ± 0.25, 2.4 ± 0.27, and 2.0 ± 0.16 µM, respectively, in CML-PBM cells. Panels A and B show the cytotoxicity data obtained using PP1 or LY (1 µM) at equimolecular doses with IM. As shown, PP1 and LY increased IM-induced cytotoxicity of 36% and 34%, respectively, in K562 cells and of 41% and 48%, respectively, in CML-PBM cells.
IM, PP1, and LY inhibit calcium mobilization induced by TG or InsP3
It has been established that low and high Bcr/Abl-expressing cells show impaired ER homeostasis and are unable to activate ER calcium-mediated apoptotic pathways.43,44 Our studies have shown that in vivo IM treatment is able to modulate the intracellular calcium concentration of peripheral blood mononuclear cells from CML patients.45 Figure 2 shows the results obtained by using increasing concentrations (range 0–50 μM) of IM, PP1, or LY on the mobilization of intracellular calcium induced by 2 μM TG. K562 and CML-PBM cells were loaded with FURA-2/AM and balanced for 10 min in a calcium-free medium for determination of TG activity. In K562 cells, IM, PP1, and LY reduced the mobilization of [Ca2+]i induced by TG in a dose-dependent manner with an IC50 of 7.7 ± 0.71, 10.4 ± 0.98, and 8.6 ± 0.87 μM, respectively, while in CML-PBM cells, the IC50 was of 7.1 ± 0.82, 9.4 ± 0.88 and of 8.8 ± 0.90 μM, respectively. Panel A shows the results obtained using IM (7.7 μM) with equimolecular doses of PP1 or LY in K562 cells, while panel B shows the results obtained using IM (7.1 μM) with equimolecular doses of PP1 or LY in CML-PBM cells. PP1 and LY showed a synergistic effect with IM by decreasing the calcium levels of 36% and 38%, respectively, in K562 and of 43% and 49%, respectively, in CML-PBM cells.
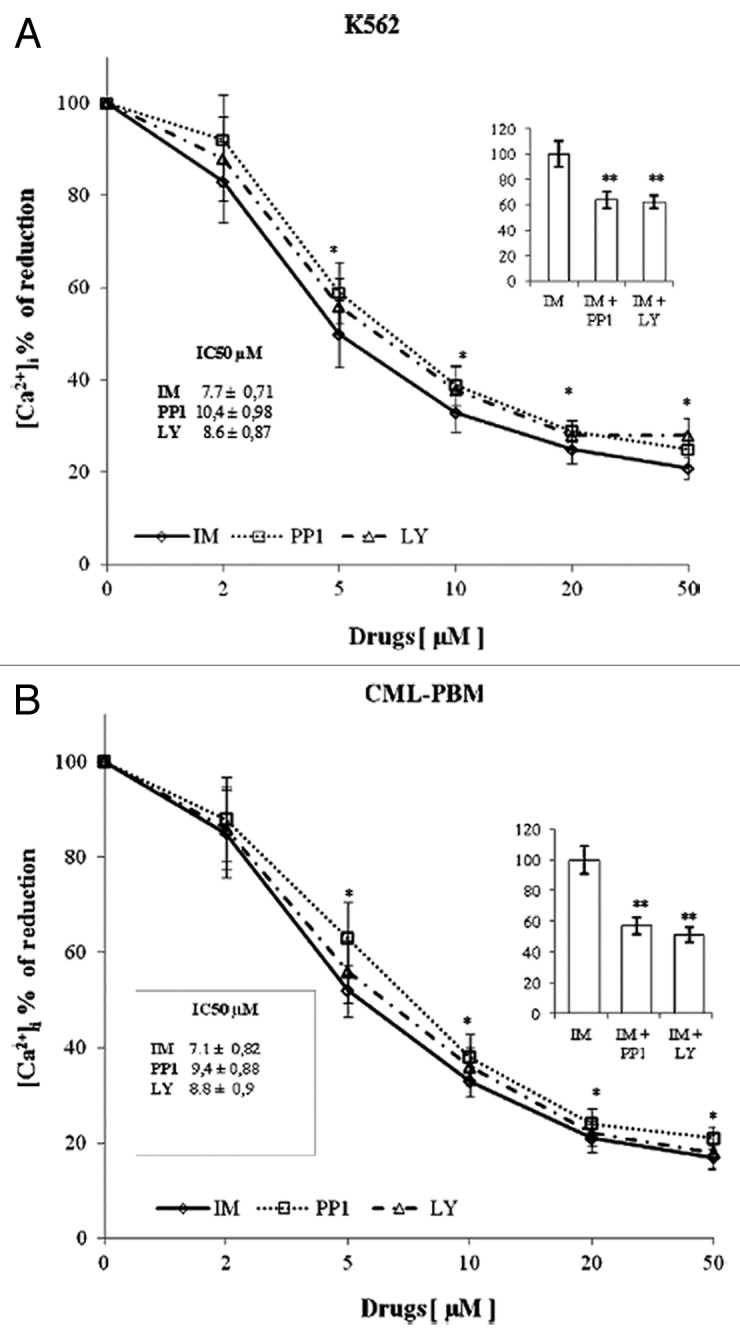
Figure 2. In vitro activity of increasing concentration of various tyrosine kinase inhibitors on calcium levels induced by TG in K562 or CML-PBM cells. 106 cells were incubated with 2 µM of TG alone or with increasing concentrations (0–50 µM) of IM, LY, or PP1 (KRH medium calcium free). (A) Represents the effect of 7.7 µM IM alone or in association with equimolecular doses of PP1 or LY in K562 cells. (B) Represents the effect of 7.1 µM IM alone or in association with equimolecular doses of PP1 or LY in CML-PBM cells. Data represent the [Ca2+]i values (mean ± S.D.) obtained in 4 distinct experiments performed in duplicate. (*P < 0.05 vs. TG alone; ** P < 0.05 vs. IM alone).
Figure 3 shows the results obtained using increasing concentrations (range 0–50 μM) of IM, PP1 and LY on the intracellular calcium mobilization induced by 5 μM InsP3 in K562 and CML-PBM cells. In K562 cells, IM, PP1, and LY reduced InsP3-induced intracellular calcium mobilization in a dose-dependent manner with an IC50 of 7.5 ± 1.1, 10.6 ± 1.7, and 8.8 ± 0.95 μM, respectively, while in CML-PBM cells, the IC50 was of 6.9 ± 0.63, 10.4 ± 0.89, and of 8.5 ± 0.84 μM, respectively. Panel A shows the results obtained using IM (7.5 μM) with equimolecular doses of PP1 or LY in K562 cells, and panel B shows the results obtained using IM (6.9 μM) with equimolecular doses of PP1 or LY in CML-PBM cells. PP1 and LY showed a synergistic effect, with IM decreasing calcium levels of 36% and 34%, respectively, in K562 and of 36% and 44%, respectively, in CML-PBM cells.
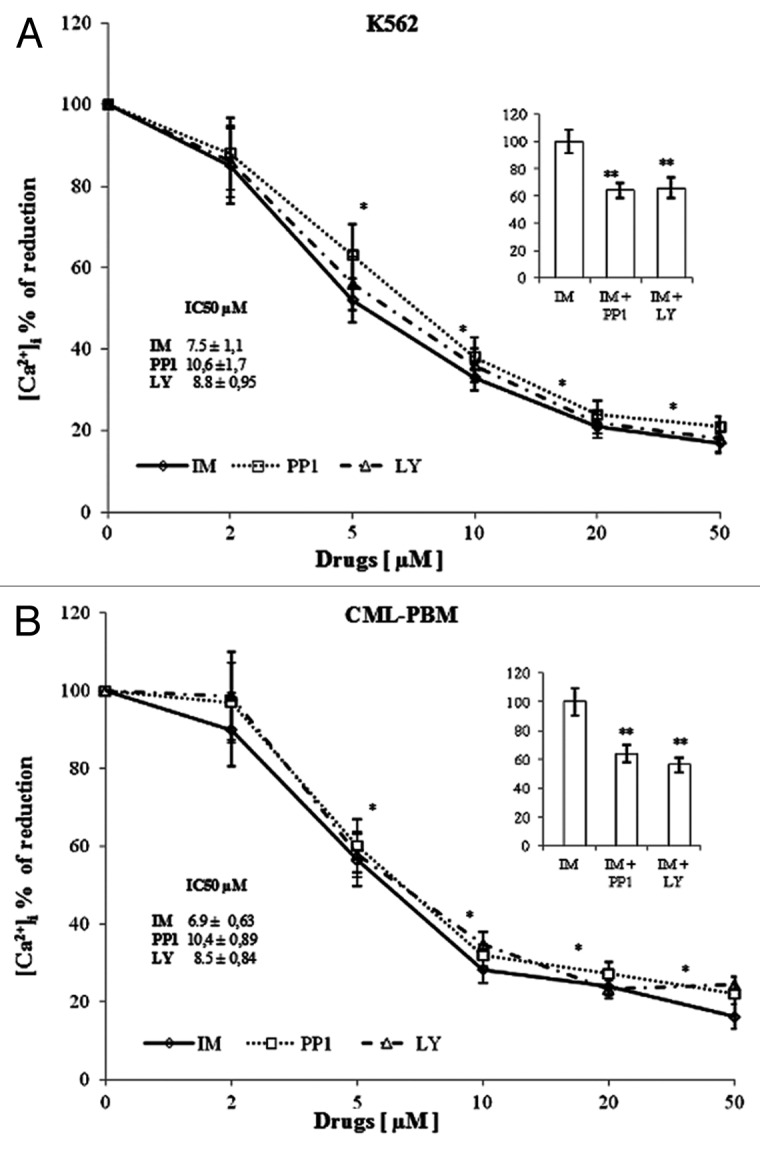
Figure 3. In vitro activity of increasing concentrations of various tyrosine kinase inhibitors on calcium levels induced by InsP3 in K562 or CML-PBM cells. 106 cells were incubated with 5 µM InsP3 alone or with increasing concentrations (0–50 µM) of IM, PP1, or LY (KRH medium, calcium-free). (A) Represents the effect of 7.5 µM IM alone or in association with equimolecular doses of PP1 or LY in K562 cells. (B) Represents the effect of 6.9 µM IM alone or in association with equimolecular doses of PP1 or LY in CML-PBM cells. Data represent the [Ca2+]i values (mean ± SD) obtained in 4 distinct experiments performed in duplicate. (*P < 0.05 vs. InsP3 alone; ** P < 0.05 vs. IM alone).
It is important to note that IM, PP1 and LY utilized alone, did not produce significant effects on the intracellular calcium mobilization induced by 10 μM of IONO (an aspecific ionophore) (data not shown).
Synergistic effect of PP1 and LY on IM-induced apoptosis and autophagy
The apoptotic activity of IM, PP1, and LY used alone or in association was evaluated by assaying the levels of oligonucleosomes in K562 and CML-PBM cells. Cells were incubated for 24 h with IM, PP1 and LY (1 μM) alone or in association at equimolecular doses. As showed in Figure 4, IM, PP1, and LY induced apoptosis in K562 and CML-PBM cells with O.D. values of 0.183 ± 0.025, 0.097 ± 0.012, 0.083 ± 0.0092 and of 0.206 ± 0.029, 0.099 ± 0.014, 0.101 ± 0.0098, respectively.
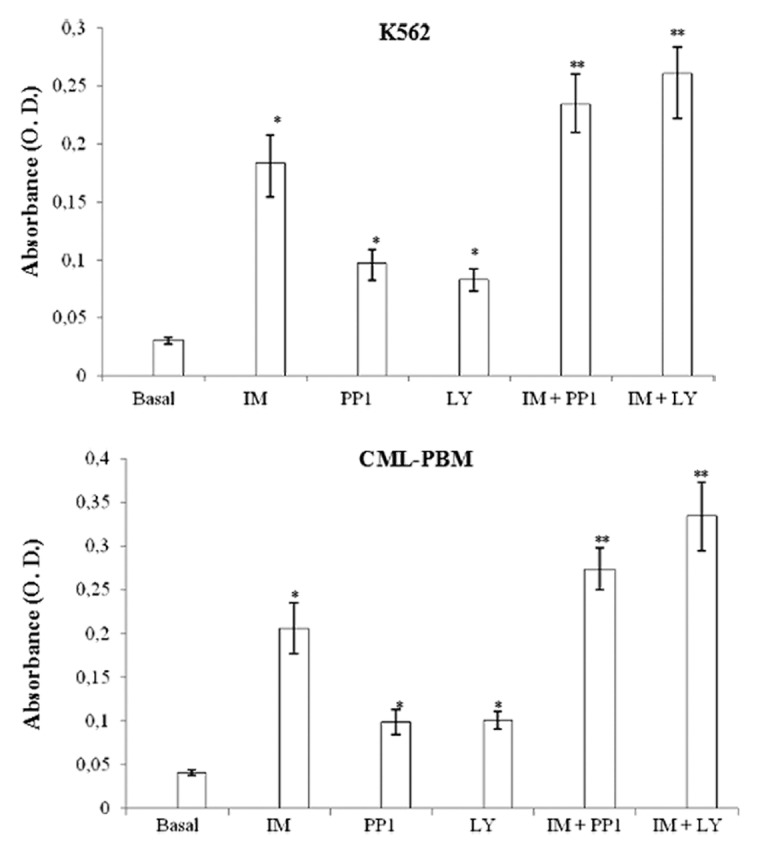
Figure 4. Activity of IM, PP1, or LY alone or in association on intracytosolic levels of oligo-nucleosomes in K562 or CML-PBM cells. 106 cells were incubated for 24 h with 2 µM IM, PP1 and LY used alone or in association at equimolecular doses at 37 °C in humidified atmosphere of 5% carbon dioxide in air. Data represents mean of absorbance (O.D.) ± SD obtained in 4 distinct experiments performed in duplicate. (*P < 0.05 vs. basal levels. **P < 0.05 vs. IM alone).
PP1 and LY showed a synergistic effect with IM when used in association at equimolecular doses in CML-PBM cells, increasing O.D. values from 0.206 ± 0.029 to 0.274 ± 0.024 (33.0%) and 0.334 ± 0.039 (62.1%), respectively. The same scenario was observed in K562 cells, in which PP1 and LY shifted the O.D. values from 0.183 ± 0.025 to 0.234 ± 0.026 (27.8%) and 0.261 ± 0.022 (42.6%), respectively.
The autophagic activity of IM, PP1, and LY used alone or in association was evaluated by western blot analysis of LC3II protein levels in K562 and CML-PBM cells. Cells were incubated for 6 h with IM, PP1, and LY (1 μM) alone or in association at equimolecular doses. Figure 5 shows IM, PP1, and LY induced autophagy in K562 and CML-PBM cells with A.U. values of 42.8 ± 4.5, 28.9 ± 3.1, 25.3 ± 2.1 and 53.3 ± 6.2, 24.7 ± 2.1, 22.9 ± 1.9, respectively.

Figure 5. Activity of IM, PP1, and LY used alone or in association on autophagy in K562 and CLM-PBM cells. Cultures of K562 and CLM-PBM cells were incubated for 6 h with 2 µM of IM, PP1 or LY alone or in association at equimolecular doses at 37 °C in humidified atmosphere of 5% CO2. Cells were scraped, harvested, lysed, and subjected to western blot analysis with antibodies against actin and LC3II. (A and B) Actin protein levels were detected to ensure equal protein loading. Densitometric analysis of blots relative to LC3II. Results are expressed as the mean of arbitrary units (A.U.) ± SD of 4 independent experiments. (*P < 0.05 vs. basal levels. ** P < 0.05 vs. IM alone).
PP1 and LY showed a synergic effect with IM when used in association at equimolecular doses in CML-PBM cells increasing A.U. values from 53.3 ± 6.2 to 77.8 ± 8.9 (45.9%) and 96.5 ± 10.3 (80.3%), respectively. The same scenario was observed in K562 cells in which PP1 and LY shifted A.U. values from 42.8 ± 4.5 to 60.8 ± 6.9 (42.0%) and 71.3 ± 8.1 (66.5%), respectively.
Intracellular calcium modulation mediates IM, PP1 and LY synergistic effect
In order to verify the correlation between induction of apoptosis and/or autophagy, IP3/IP3R, or SERCA signaling cascades, we used the thapsigargin (TG) (specific inhibitor of the SERCA channels and inducer of mTOR-independent autophagy), lithium chloride (Li) (a regulator of the levels of inositol-1, 4,5-trisphosphate and inhibitor of InsP3 receptors and autophagy inducer),46,47 IONO (an aspecific ionophore), and the BAPTA-AM (a chelator of intracellular calcium) in association with IM, PP1, and LY.
Figure 6 shows the results obtained using TG (2 μM), Li (10 mM), IONO (10 μM), and BAPTA-AM (10 μM) alone and in association with IM, PPI, and LY on apoptosis. The TG treatment increased O.D. values in K562 and CML-PBM cells from 0.027 ± 0.004 to 0.158 ± 0.021 and from 0.039 ± 0.0035 to 0.205 ± 0.022, respectively. Lithium treatment increased O.D. values in K562 and CML-PBM cells from 0.027 ± 0.004 to 0.112 ± 0.012 and from 0.039 ± 0.0035 to 0.154 ± 0.012, respectively. BAPTA-AM and IONO produced no effect on apoptosis.

Figure 6. Effect of TG (2 µM), Li (10 mM), and BAPTA-AM (10 µM) used alone or in association with IM alone or in association with PP1 or LY on intracytosolic levels of oligonucleosomes in K562 or CML-PBM cells. Cellular suspensions were incubated for 24 h with 2 µM TG or 10 mM Li or 10 µM BAPTA alone or in association with 2 µM IM alone or in association with equimolecular doses of PP1 or LY at 37 °C in humidified atmosphere of 5% carbon dioxide in air. Data represents mean of absorbance (O.D.) ± S.D. obtained in 4 distinct experiments performed in duplicate. (*P < 0.05 vs. control cells. ** P < 0.05 vs. IM alone. *** P < 0.05 vs. IM + PP1. ****P < 0.05 vs. IM + LY).
In K562 cells treated with IM, IM with PP1, and IM with LY, TG (2 μM) led to a further increase in apoptosis of 34.7%, 34.8%, and 38.6%, respectively. Even in CML-PBM cells treated with IM, IM with PP1, and IM with LY, TG led to an increase in apoptosis of 27.3%, 47.8%, and 38.5%, respectively.
The same scenario was observed using Li (10 mM) in association with IM, PPI, and LY. In fact, in K562 cells treated with IM, IM with PP1, and IM with LY, Li led to a further increase in apoptosis of 33.0%, 72.3%, and 86.6%, respectively. In CML-PBM cells, Li (10 mM) led to a further increase in apoptosis of 58.4%, 90.2%, and 85.0%, respectively.
On the contrary, BAPTA-AM (10 μM) used in association with IM, IM with PP1, and IM, significantly reduced drug-induced apoptosis. In fact, in K562 cells treated with IM, IM with PP1, and IM with LY, BAPTA-AM reduced apoptosis by 36.4%, 40.8%, and 46.3%. Likewise, in CML-PBM cells, BAPTA-AM reduced apoptosis by 48.1% in IM-treated cells, 77.2% in IM + PP1 treated cells, and 56.0% in IM + LY-treated cells. In K562 and CML-PBM cells, IONO used in association with IM, IM with PP1, and IM with LY produced no effect on apoptosis (data not shown).
Figure 7 shows the results obtained on autophagy using TG (2 μM), Li (10 mM), and BAPTA-AM (10 μM) alone and in association with IM, PPI, and LY.

Figure 7. Activity of TG (2 µM), Li (10 mM), and BAPTA-AM (10 µM) used alone or in association with 2 µM of IM alone or in association at equimolecular doses with PP1 or LY on autophagy in K562 and CLM-PBM cells. Cultures of K562 and CLM-PBM cells were incubated for 6 h at 37 °C in humidificated atmosphere of 5% CO2. Cells were scraped, harvested, lysed, and subjected to western blot analysis with antibodies against actin and LC3II. (A and B). Actin protein levels were detected to ensure equal protein loading. Densitometric analysis of blots relative to LC3II. Results are expressed as the mean of Arbitrary Units (A.U.) ± SD of 4 independent experiments. (*P < 0.05 vs. basal levels. ** P < 0.05 vs. IM alone).
The TG treatment increased autophagy in K562 and CML-PBM cells from 12.7 ± 2.1 to 67.5 ± 7.9 and from 13.2 ± 1.8 to 69.4 ± 8.8 (A.U. values), respectively. Lithium treatment increased autophagy in K562 and CML-PBM cells from 12.7 ± 2.1 to 51.4 ± 7.3 and from 13.2 ± 1.8 to 53.9 ± 6.5, respectively. BAPTA-AM and IONO produced no effect on apoptosis.
Cellular Ca2+ homeostasis has been reported to be perturbed by ER stress and to be causally linked to the induction of autophagy.48 Consistent with this, we observed, in K562 cells treated with IM, IM with PP1, and IM with LY, that TG (2 μM) increased autophagy from 42.9 ± 7.5 to 63.7 ± 7.5, from 60.8 ± 7.2 to 93.7 ± 8.1, and from 71.2 ± 7.9 to 91.5 ± 7.6, respectively. Also, in CML-PBM cells treated with IM and IM with PP1, TG led to an increase in autophagy from 52.7 ± 6.4 to 82.8 ± 9.2, from 78.3 ± 6.7 to 94.8 ± 8.7, and from 87.0 ± 7.4 to 98.1 ± 10.2, respectively.
The same scenario was observed using Li (10 mM) in association with IM, PPI, and LY. In fact, in K562 cells treated with IM, IM with PP1, and IM with LY, Li led to a further increase in autophagy from 42.9 ± 7.5 to 56.6 ± 6.1, from 60.8 ± 7.2 to 88.7 ± 7.7, and from 71.9 ± 7.9 to 86.9 ± 7.7, respectively. In CML-PBM cells treated with IM and IM with PP1, Li led to an increase in apoptosis from 52.7 ± 6.4 to 81.4 ± 9.0, from 78.3 ± 6.7 to 94.8 ± 8.7, and from 87.0 ± 7.4 to 98.1 ± 10.2, respectively.
On the contrary, BAPTA-AM (10 μM) used in association with IM, IM with PP1 and IM, significantly reduced drug-induced autophagy. In fact, in K562 cells treated with IM, IM with PP1, and IM with LY, BAPTA-AM reduced LC3-II levels by 68.2%, 74.6%, and 79.5%, respectively. Likewise in CML-PBM cells, BAPTA-AM reduced autophagy by 66.9% in IM-treated cells, 81.1% in IM + PP1 treated cells, and 83.6% in IM + LY-treated cells. In K562 and CML-PBM cells, IONO used in association with IM, IM with PP1, and IM with LY produced no effect on autophagy (data not shown).
Discussion
Several studies demonstrated that the alteration of ionized calcium concentration in the cytosol has been implicated in the initiation of secretion, contraction, and cell proliferation. It has been established that the endoplasmic reticulum can play a critical role in the regulation of proliferation and apoptosis independently, or upstream, of the mitochondria.49 Low and high Bcr-Abl-expressing cells show impaired ER homeostasis and are unable to activate ER calcium-mediated apoptotic pathways.43 Our recent studies demonstrated a lower activity of InsP3-dependent release of calcium from stores as well as a decreased function of purinergic-dependent calcium channels in CML cells.36 Moreover, Bellodi C, et al. showed, in primary CML cells and K562 cells, that in vitro treatment with 2 μM of IM induces apoptosis through inhibition of BCR/ABL protein and also through inhibition of the calcium release from the intracellular stores induced by thapsigargin.50 The data presented herein have shown that IM treatment, in K562 and CML-PBM cells, is able to modulate the intracellular calcium concentration by acting on SERCA and InsP3 receptors in the endoplasmic reticulum, and that the addition of equimolecular doses of PP1 or LY synergizes such activity.
Elevated cytosolic [Ca2+]i concentrations were also shown to promote the autophagic process. Decuypere et al.38 demonstrated in HeLa cells that autophagy induction is also a Ca2+-dependent process in response to a non-Ca2+-mobilizing trigger, starvation, since chelating the cytosolic Ca2+ with BAPTA-AM during starvation blunted autophagy stimulation. In addition, he demonstrated the important role for Ins (1,4,5) P3Rs in this process, since blocking Ins (1,4,5) P3Rs with Xestospongin B (a specific Ins [1,4,5] P3R inhibitor) also abolished LC3 lipidation, suggesting that autophagy stimulation depends on proper Ins(1,4,5)P3-mediated Ca2+ signaling, and is not only provoked by aberrant Ca2+ homeostasis. Another study has shown that stress of the ER is involved in the processes of apoptosis downregulating the PKR-like ER-resident kinase (PERK)44 and mTOR-independent autophagy. Ogata M, et al.51 demonstrated in SK-N-SH neuroblastoma that ER stressors, namely tunicamycin, an inhibitor of N glycosylation, and thapsigargin, an inhibitor of smooth ER Ca2+-ATPase, that JNK activation in the early phase of ER stress is required for autophagosome formation after ER stress but is not sufficient for the induction of apoptosis.52 In contrast, sustained activation of JNK for 24 h by ER stress could cause apoptosis.
In the present report, we demonstrated for the first time that PP1, a Src kinase inhibitor, and LY294002, a specific PI3K tyrosine kinase inhibitor, interact synergistically with IM in inducing apoptosis and autophagy in Bcr/Abl+ leukemia cells and are related to the stress of the endoplasmic reticulum. In fact, experiments performed with BAPTA-AM, a calcium chelator, significantly inhibited apoptosis and autophagy induced by TG and Li (a regulator of the levels of inositol-1, 4,5-trisphosphate and inhibitor of InsP3 receptors). Our data showed a reasonable relationship between the apoptotic and autophagic activity of the TKIs utilized and the functionality of receptors SERCA and Ins (1,4,5) P3 independently of intracellular calcium levels. In fact the inhibition of SERCA and InsP3 receptors observed in our experiments has led to an increase of autophagy and apoptosis, while the ionophore used had no effect.
In conclusion, our findings suggest that therapeutic strategies combining Imatinib with IP3K and/or Src kinase inhibitors warrant further investigation in Bcr/Abl+ malignancies, particularly in the cases of imatinib mesylate-resistant disease.
Materials and Methods
Chemicals
Imatinib (IM) kindly provided from Novartis SpA; RPMI-1640 from Labtek Laboratories, Eurobio; LY294002, 4-Amino-5-(4-methylphenyl)-7-(t-butyl)pyrazolo[3,4-d]-pyrimidine (PP1), lithium chloride (Li), Thapsigargin (TG), Inositol 1,4,5-triphosphate (InsP3), Ionomycin (IONO), Phytohaemagglutinin (PHA), fetal calf serum (FCS), hystopaque, propidium iodide (PI), were obtained from SIGMA.
Patients
For this study, 15 volunteer patients with CML (7 males and 8 females; mean age 53 y; range 35–57 y) were processed at the time of diagnosis. Eligible patients have been diagnosed with Ph+ CML-CP (Cytogenetic analysis showed that Ph chromosome were 100% of positive). Chronic phase was defined by the presence of <15% blasts, <20% basophils, and <30% blasts plus promyelocytes in the peripheral blood or bone marrow.
Leukocytes preparation
Peripheral blood mononuclear cells of CML patients (CML-PBM) newly diagnosed were isolated using the modification of a method of Boyum as described by Florio et al.53 Briefly, human blood from patients and control subjects was drawn in heparin (20 U/ml), stratified on Ficoll-Hystopaque gradients (density 1.077), and centrifuged for 30 min at 600 × g. The ring of leukocytes at the interface was collected and washed 2 times with 5 ml of PBS. The preparation was found to be 89% pure by flow cytometric analysis (range 84–91%; red blood cells 6.1%; polymorphonucleates 2.6%; platelets 2.1%). Lymphocytes were washed by centrifugation for 5 min at 600 × g and re-suspended in RPMI 1640 supplemented with 10% fetal calf serum (FCS), 1% penicillin and streptomycin, 2 mM glutamine. Aliquots of lympho-monocytes were incubated for 1 h in humidified atmosphere of 5% CO2 at 37 °C in culture plastic plates. Light microscopy and flow cytofluorimetric analysis of stained cells demonstrated that more than 96 ± 2% of the adherent cells were monocytes.
Viable lymphomonocytes (as evaluated by means of the trypan blue exclusion test) were seeded at 3 × 10⁶ cells in 6-well tissue culture plates and cultured overnight in RPMI 1640 complete medium.
Cell line culture
The BCR-ABL-positive K562 cell lines derived from a patient with CML in erythroid blast phase was provided by ATCC. K562 cells were cultured in RPMI 1640, supplemented with 10% (v/v) heated-inactivated fetal bovine serum (FBS) 100 U ml-1 of penicillin and 100 μg of streptomycin ml in a humidified atmosphere with 5% CO2 at 37 °C. Morphology was determined with Wright staining of cells centrifuged onto slides by cytospin (100 g, 4 min; Shandon, Runcorn).54
Cytotoxicity assay
K562 or peripheral blood mononuclear cells of CML patients (CML-PBM) newly diagnosed (1 × 10⁶/well) were distributed on a 96-well flat-bottomed plate and a final volume of 100 μL of RPMI medium with 10% bovine serum was obtained. After incubation with various drugs for 24 h, the cytotoxicity assay was performed with the 3-(4,5-dimethylthiazol-2-yl)-2,5-diphenyltetrazolium bromide (MTT) dye reduction assay as previously described.55
Intracellular calcium measurement
Intracellular Ca2+ concentrations [Ca2+]i were measured by using the radiometric fluorescent indicator dye FURA-2/AM, the membrane-permeant form of FURA-2/AM, as previously described, and opportunely modified.56 Briefly, CML cells were washed twice in PBS in 15 ml polypropylene tubes (Falcon/Becton Dickinson Labware) and resuspended in Krebs Ringer (KRH) medium (1 × 10⁶cells/mL) with 3.0 mM Ca2+-sensitive dye FURA-2/AM for 60 min at 30 °C. We also added the non-ionic detergent Pluronic acid F-127 (0.02% w/v) to each incubation batch as a dispersing agent. Cells were subsequently centrifuged and resuspended in KRH calcium-free or containing 1 mM CaCl2. The samples were then transferred to a thermostat-equipped cuvette (37 °C), maintained under continuous stirring and analyzed in a SPEX spectrophotofluorometer (2 wavelengths excitations, 340 and 380 nm, and emission intensities at 505 nm). The experiments were initiated by incubation of cell aliquots (1 × 10⁶ cells) with several drugs for 5 min. After stimulation with TG or InsP3, the recording was continued until the end of the [Ca2+]i peak. At the end of the experiment, the calibration was performed by determining the minimal fluorescence induced by 0.1% triton X-100 in presence of 5 mM EGTA (Fmin) and maximal fluorescence induced by 3 mM CaCl2 (Fmax). Intracellular calcium concentration was calculated according to the method of Grinkiewicz et al.,57 using the equation: [Ca2+]i = 224 × [(R – Rmin)/Rmax – R)], were R is the experimentally determined fluorescence ratio. Graphs show the mean ± standard deviation values of 4 experiments in duplicate.
Apoptosis assay
Apoptosis was also evaluated with a cell death ELISA kit (Boehringer Mannheim), which utilizes a monoclonal antibody against histone to detect DNA fragments in the cytosolic fraction of lysed cells. Cells treated or untreated were lysed according to the manufacturer’s instructions. The samples were transferred into 96-well dishes coated with a mouse monoclonal antibody against histone. After incubation and washing, anti-DNA-peroxidase was added to the wells. Cell culture supernatants removed from the cells after treatment (but before lysis) gave no signal, indicating that there were no necrotic cells during the treatment. The reaction was developed with the substrate supplied by the manufacturer, and the absorbance of the wells was read at 410 nm and results expressed as optical density values (O.D.).
Autophagy assay
In order to evaluate the autophagic potential of the different therapeutic associations, the levels of microtubule-associated protein 1A/1B-light chain 3 (LC3) and its conjugated form, LC3-phosphatidylethanolamine conjugate (LC3-II), were assayed by immunoblotting. Sodium dodecyl sulfate PAGE and western blot analysis were performed on treated and mock-treated K562 and CML-PBL cells, as previously described with some modifications.58
Cells were collected by centrifugation and resuspended in PBS. The pellets, obtained by centrifugation, were stored at −20 °C. Cells were homogenized directly into lysis buffer (50 mM Tris pH 7.5; 150 mM NaCl; 1 mM EDTA; 0.25% deoxycholic acid, 1% Triton X-100) with 20 mM sodium pyrophosphate, 0.1 mg/mL aprotinin, 2 mM phenylmethylsulphony fluoride (PMSF), 10 mM sodium orthovanadate (Na2VO3), and 50 mM sodium fluoride (NaF). Protein concentrations were determined by the use of a protein assay kit (Bio-Rad Laboratories).
Equal amounts of lysate samples were boiled and loaded on bis/acrylamide gels, separated by electrophoresis, and proteins were blotted from the gel onto nitrocellulose membranes. The membranes were blocked with 5% bovine serum albumin (BSA) in Tris buffered saline (TBS: 12.5 mM TRIS-HCl pH 7.4; 125 mM NaCl) at room temperature, washed with TBS 0.1% Tween and incubated with primary antibody.
The primary antibody used was rabbit anti-LC3 (MBL International Corporation catalog no. PM036; 1:1000 dilution). After appropriate washing steps, peroxidase-conjugated anti-rabbit IgG (GE Healtcare, catalog no. NA934) was applied for 1 h at a 1:1000 dilution. The blots were stripped and reprobed against mouse anti-actin antibody (Calbiochem; cat. no. CP10) at 1:5000 dilution to confirm equal loading of proteins in each lane. Protein expression levels were quantitatively estimated by densitometry using a Gel Doc scanner (BioRad) equipped with a densitometric workstation. The protein concentrations were normalized to the actin level and expressed as the densitometric ratio and results expressed as relative band density (arbitrary units-A.U.).
Total protein assay
Total proteins were determined by the method of Lowry et al.59
Statistical analysis
Data are expressed as mean ± standard deviation of 4 independent determinations. An error probability with P < 0.05 (including P < 0.01 and P < 0.001) was selected as significant. All experiments were performed in duplicate and the mean was used for analysis.
Acknowledgment
We thank all the patients and the U.O. Haematology of Hospital Praesidium Aversa, ASL Caserta (CE), who have provided normal and CML samples for our Biobank; Leonida Manco and Paolo Muzj (University of Naples Federico II, Naples, Italy) for their contribution to the initial phase of the project and for technical support. This work was supported by grant from: Italian Association Leukemia and Lymphoma (A.I.L.) - Caserta - ONLUS “Valentina Picazio”. Human Health Foundation Onlus (http://www.hhfonlus.org), Sbarro Health Research Organization (http://www.shro.org).
Glossary
Abbreviations:
- CML
chronic myeloid leukemia
- IM
imatinib mesylate
Disclosure of Potential Conflicts of Interest
No potential conflicts of interest were disclosed.
Footnotes
Previously published online: www.landesbioscience.com/journals/cc/article/25920
References
- 1.O’Brien SG, Guilhot F, Larson RA, Gathmann I, Baccarani M, Cervantes F, Cornelissen JJ, Fischer T, Hochhaus A, Hughes T, et al. IRIS Investigators Imatinib compared with interferon and low-dose cytarabine for newly diagnosed chronic-phase chronic myeloid leukemia. N Engl J Med. 2003;348:994–1004. doi: 10.1056/NEJMoa022457. [DOI] [PubMed] [Google Scholar]
- 2.Druker BJ, Guilhot F, O’Brien SG, Gathmann I, Kantarjian H, Gattermann N, Deininger MW, Silver RT, Goldman JM, Stone RM, et al. IRIS Investigators Five-year follow-up of patients receiving imatinib for chronic myeloid leukemia. N Engl J Med. 2006;355:2408–17. doi: 10.1056/NEJMoa062867. [DOI] [PubMed] [Google Scholar]
- 3.Stuart SA, Minami Y, Wang JY. The CML stem cell: evolution of the progenitor. Cell Cycle. 2009;8:1338–43. doi: 10.4161/cc.8.9.8209. [DOI] [PMC free article] [PubMed] [Google Scholar]
- 4.Gorre ME, Mohammed M, Ellwood K, Hsu N, Paquette R, Rao PN, Sawyers CL. Clinical resistance to STI-571 cancer therapy caused by BCR-ABL gene mutation or amplification. Science. 2001;293:876–80. doi: 10.1126/science.1062538. [DOI] [PubMed] [Google Scholar]
- 5.Hochhaus A, La Rosée P. Imatinib therapy in chronic myelogenous leukemia: strategies to avoid and overcome resistance. Leukemia. 2004;18:1321–31. doi: 10.1038/sj.leu.2403426. [DOI] [PubMed] [Google Scholar]
- 6.Corbin AS, La Rosée P, Stoffregen EP, Druker BJ, Deininger MW. Several Bcr-Abl kinase domain mutants associated with imatinib mesylate resistance remain sensitive to imatinib. Blood. 2003;101:4611–4. doi: 10.1182/blood-2002-12-3659. [DOI] [PubMed] [Google Scholar]
- 7.Kantarjian H, Talpaz M, O’Brien S, Garcia-Manero G, Verstovsek S, Giles F, Rios MB, Shan J, Letvak L, Thomas D, et al. High-dose imatinib mesylate therapy in newly diagnosed Philadelphia chromosome-positive chronic phase chronic myeloid leukemia. Blood. 2004;103:2873–8. doi: 10.1182/blood-2003-11-3800. [DOI] [PubMed] [Google Scholar]
- 8.Chomel JC, Turhan AG. Chronic myeloid leukemia stem cells in the era of targeted therapies: resistance, persistence and long-term dormancy. Oncotarget. 2011;2:713–27. doi: 10.18632/oncotarget.333. [DOI] [PMC free article] [PubMed] [Google Scholar]
- 9.Smith PG, Tanaka H, Chantry A. A novel co-operative mechanism linking TGFβ and Lyn kinase activation to imatinib resistance in chronic myeloid leukaemia cells. Oncotarget. 2012;3:518–24. doi: 10.18632/oncotarget.500. [DOI] [PMC free article] [PubMed] [Google Scholar]
- 10.Young MA, Shah NP, Chao LH, Seeliger M, Milanov ZV, Biggs WH, 3rd, Treiber DK, Patel HK, Zarrinkar PP, Lockhart DJ, et al. Structure of the kinase domain of an imatinib-resistant Abl mutant in complex with the Aurora kinase inhibitor VX-680. Cancer Res. 2006;66:1007–14. doi: 10.1158/0008-5472.CAN-05-2788. [DOI] [PubMed] [Google Scholar]
- 11.Carter TA, Wodicka LM, Shah NP, Velasco AM, Fabian MA, Treiber DK, Milanov ZV, Atteridge CE, Biggs WH, 3rd, Edeen PT, et al. Inhibition of drug-resistant mutants of ABL, KIT, and EGF receptor kinases. Proc Natl Acad Sci U S A. 2005;102:11011–6. doi: 10.1073/pnas.0504952102. [DOI] [PMC free article] [PubMed] [Google Scholar]
- 12.Dufies M, Cassuto O, Jacquel A, Robert G, Auberger P. Ponatinib circumvents all types of imatinib resistance in chronic myelogenous leukemia cell lines. Cell Cycle. 2013;12:1645–6. doi: 10.4161/cc.24982. [DOI] [PubMed] [Google Scholar]
- 13.Cassuto O, Dufies M, Jacquel A, Robert G, Ginet C, Dubois A, Hamouda A, Puissant A, Luciano F, Karsenti JM, et al. All tyrosine kinase inhibitor-resistant chronic myelogenous cells are highly sensitive to ponatinib. Oncotarget. 2012;3:1557–65. doi: 10.18632/oncotarget.692. [DOI] [PMC free article] [PubMed] [Google Scholar]
- 14.Yu C, Krystal G, Dent P, Grant S. Flavopiridol potentiates STI571-induced mitochondrial damage and apoptosis in BCR-ABL-positive human leukemia cells. Clin Cancer Res. 2002;8:2976–84. [PubMed] [Google Scholar]
- 15.Nakajima A, Tauchi T, Sumi M, Bishop WR, Ohyashiki K. Efficacy of SCH66336, a farnesyl transferaseinhibitor, in conjunction with imatinib against BCR-ABL-positive cells. Mol Cancer Ther. 2003;2:219–24. doi: 10.4161/cbt.2.3.390. [DOI] [PubMed] [Google Scholar]
- 16.Yu C, Rahmani M, Almenara J, Subler M, Krystal G, Conrad D, Varticovski L, Dent P, Grant S. Histone deacetylase inhibitors promote STI571-mediated apoptosis in STI571-sensitive and -resistant Bcr/Abl+ human myeloid leukemia cells. Cancer Res. 2003;63:2118–26. [PubMed] [Google Scholar]
- 17.Tseng PH, Lin HP, Zhu J, Chen KF, Hade EM, Young DC, Byrd JC, Grever M, Johnson K, Druker BJ, et al. Synergistic interactions between imatinib mesylate and the novel phosphoinositide-dependent kinase-1 inhibitor OSU-03012 in overcoming imatinib mesylate resistance. Blood. 2005;105:4021–7. doi: 10.1182/blood-2004-07-2967. [DOI] [PMC free article] [PubMed] [Google Scholar]
- 18.Deininger MW, Goldman JM, Melo JV. The molecular biology of chronic myeloid leukemia. Blood. 2000;96:3343–56. [PubMed] [Google Scholar]
- 19.McCubrey JA, Steelman LS, Chappell WH, Abrams SL, Franklin RA, Montalto G, Cervello M, Libra M, Candido S, Malaponte G, et al. Ras/Raf/MEK/ERK and PI3K/PTEN/Akt/mTOR cascade inhibitors: how mutations can result in therapy resistance and how to overcome resistance. Oncotarget. 2012;3:1068–111. doi: 10.18632/oncotarget.659. [DOI] [PMC free article] [PubMed] [Google Scholar]
- 20.Lorusso PM, Adjei AA, Varterasian M, Gadgeel S, Reid J, Mitchell DY, Hanson L, DeLuca P, Bruzek L, Piens J, et al. Phase I and pharmacodynamic study of the oral MEK inhibitor CI-1040 in patients with advanced malignancies. J Clin Oncol. 2005;23:5281–93. doi: 10.1200/JCO.2005.14.415. [DOI] [PubMed] [Google Scholar]
- 21.Allen LF, Sebolt-Leopold J, Meyer MB. CI-1040 (PD184352), a targeted signal transduction inhibitor of MEK (MAPKK) Semin Oncol. 2003;30(Suppl 16):105–16. doi: 10.1053/j.seminoncol.2003.08.012. [DOI] [PubMed] [Google Scholar]
- 22.Thompson N, Lyons J. Recent progress in targeting the Raf/MEK/ERK pathway with inhibitors in cancer drug discovery. Curr Opin Pharmacol. 2005;5:350–6. doi: 10.1016/j.coph.2005.04.007. [DOI] [PubMed] [Google Scholar]
- 23.Kohno M, Pouyssegur J. Targeting the ERK signaling pathway in cancer therapy. Ann Med. 2006;38:200–11. doi: 10.1080/07853890600551037. [DOI] [PubMed] [Google Scholar]
- 24.Nguyen TK, Rahmani M, Harada H, Dent P, Grant S. MEK1/2 inhibitors sensitize Bcr/Abl+ human leukemia cells to the dual Abl/Src inhibitor BMS-354/825. Blood. 2007;109:4006–15. doi: 10.1182/blood-2006-09-045039. [DOI] [PMC free article] [PubMed] [Google Scholar]
- 25.Stapnes C, Gjertsen BT, Reikvam H, Bruserud Ø. Targeted therapy in acute myeloid leukaemia: current status and future directions. Expert Opin Investig Drugs. 2009;18:433–55. doi: 10.1517/14728220902787628. [DOI] [PubMed] [Google Scholar]
- 26.Fasolo A, Sessa C. Current and future directions in mammalian target of rapamycin inhibitors development. Expert Opin Investig Drugs. 2011;20:381–94. doi: 10.1517/13543784.2011.541154. [DOI] [PubMed] [Google Scholar]
- 27.Albert S, Serova M, Dreyer C, Sablin MP, Faivre S, Raymond E. New inhibitors of the mammalian target of rapamycin signaling pathway for cancer. Expert Opin Investig Drugs. 2010;19:919–30. doi: 10.1517/13543784.2010.499121. [DOI] [PubMed] [Google Scholar]
- 28.Bowles DW, Jimeno A. New phosphatidylinositol 3-kinase inhibitors for cancer. Expert Opin Investig Drugs. 2011;20:507–18. doi: 10.1517/13543784.2011.562192. [DOI] [PubMed] [Google Scholar]
- 29.Morgensztern D, McLeod HL. PI3K/Akt/mTOR pathway as a target for cancer therapy. Anticancer Drugs. 2005;16:797–803. doi: 10.1097/01.cad.0000173476.67239.3b. [DOI] [PubMed] [Google Scholar]
- 30.Cortot A, Armand JP, Soria JC. [PI3K-AKT-mTOR pathway inhibitors] Bull Cancer. 2006;93:19–26. [PubMed] [Google Scholar]
- 31.Yap TA, Garrett MD, Walton MI, Raynaud F, de Bono JS, Workman P. Targeting the PI3K-AKT-mTOR pathway: progress, pitfalls, and promises. Curr Opin Pharmacol. 2008;8:393–412. doi: 10.1016/j.coph.2008.08.004. [DOI] [PubMed] [Google Scholar]
- 32.LoPiccolo J, Blumenthal GM, Bernstein WB, Dennis PA. Targeting the PI3K/Akt/mTOR pathway: effective combinations and clinical considerations. Drug Resist Updat. 2008;11:32–50. doi: 10.1016/j.drup.2007.11.003. [DOI] [PMC free article] [PubMed] [Google Scholar]
- 33.Di Cosimo S, Scaltriti M, Val D, Rojo F, Guzman M, Jimenez J, Seoane J, Arribas J, Baselga J. The PI3-K/AKT/mTOR pathway as a target for breast cancer therapy. J Clin Oncol. 2007;25(18S):3511. [Google Scholar]
- 34.Alvarez M, Roman E, Santos ES, Raez LE. New targets for non-small-cell lung cancer therapy. Expert Rev Anticancer Ther. 2007;7:1423–37. doi: 10.1586/14737140.7.10.1423. [DOI] [PubMed] [Google Scholar]
- 35.Vazquez G, Wedel BJ, Bird GS, Joseph SK, Putney JW. An inositol 1,4,5-trisphosphate receptor-dependent cation entry pathway in DT40 B lymphocytes. EMBO J. 2002;21:4531–8. doi: 10.1093/emboj/cdf467. [DOI] [PMC free article] [PubMed] [Google Scholar]
- 36.Ciarcia R, d’Angelo D, Pacilio C, Pagnini D, Galdiero M, Fiorito F, Damiano S, Mattioli E, Lucchetti C, Florio S, et al. Dysregulated calcium homeostasis and oxidative stress in chronic myeloid leukemia (CML) cells. J Cell Physiol. 2010;224:443–53. doi: 10.1002/jcp.22140. [DOI] [PubMed] [Google Scholar]
- 37.Gordon PB, Holen I, Fosse M, Røtnes JS, Seglen PO. Dependence of hepatocytic autophagy on intracellularly sequestered calcium. J Biol Chem. 1993;268:26107–12. [PubMed] [Google Scholar]
- 38.Decuypere JP, Bultynck G, Parys JB. A dual role for Ca(2+) in autophagy regulation. Cell Calcium. 2011;50:242–50. doi: 10.1016/j.ceca.2011.04.001. [DOI] [PubMed] [Google Scholar]
- 39.Decuypere JP, Welkenhuyzen K, Luyten T, Ponsaerts R, Dewaele M, Molgó J, Agostinis P, Missiaen L, De Smedt H, Parys JB, et al. Ins(1,4,5)P3 receptor-mediated Ca2+ signaling and autophagy induction are interrelated. Autophagy. 2011;7:1472–89. doi: 10.4161/auto.7.12.17909. [DOI] [PMC free article] [PubMed] [Google Scholar]
- 40.Grotemeier A, Alers S, Pfisterer SG, Paasch F, Daubrawa M, Dieterle A, Viollet B, Wesselborg S, Proikas-Cezanne T, Stork B. AMPK-independent induction of autophagy by cytosolic Ca2+ increase. Cell Signal. 2010;22:914–25. doi: 10.1016/j.cellsig.2010.01.015. [DOI] [PubMed] [Google Scholar]
- 41.Wang SH, Shih YL, Ko WC, Wei YH, Shih CM. Cadmium-induced autophagy and apoptosis are mediated by a calcium signaling pathway. Cell Mol Life Sci. 2008;65:3640–52. doi: 10.1007/s00018-008-8383-9. [DOI] [PMC free article] [PubMed] [Google Scholar]
- 42.Sakaki K, Wu J, Kaufman RJ. Protein kinase Ctheta is required for autophagy in response to stress in the endoplasmic reticulum. J Biol Chem. 2008;283:15370–80. doi: 10.1074/jbc.M710209200. [DOI] [PMC free article] [PubMed] [Google Scholar]
- 43.Keeshan K, Cotter TG, McKenna SL. High Bcr-Abl expression prevents the translocation of Bax and Bad to the mitochondrion. Leukemia. 2002;16:1725–34. doi: 10.1038/sj.leu.2402576. [DOI] [PubMed] [Google Scholar]
- 44.Kusio-Kobialka M, Podszywalow-Bartnicka P, Peidis P, Glodkowska-Mrowka E, Wolanin K, Leszak G, Seferynska I, Stoklosa T, Koromilas AE, Piwocka K. The PERK-eIF2α phosphorylation arm is a pro-survival pathway of BCR-ABL signaling and confers resistance to imatinib treatment in chronic myeloid leukemia cells. Cell Cycle. 2012;11:4069–78. doi: 10.4161/cc.22387. [DOI] [PMC free article] [PubMed] [Google Scholar]
- 45.Ciarcia R, Vitiello MT, Galdiero M, Pacilio C, Iovane V, d’Angelo D, Pagnini D, Caparrotti G, Conti D, Tomei V, et al. Imatinib treatment inhibit IL-6, IL-8, NF-KB and AP-1 production and modulate intracellular calcium in CML patients. J Cell Physiol. 2012;227:2798–803. doi: 10.1002/jcp.23029. [DOI] [PubMed] [Google Scholar]
- 46.Sarkar S, Floto RA, Berger Z, Imarisio S, Cordenier A, Pasco M, Cook LJ, Rubinsztein DC. Lithium induces autophagy by inhibiting inositol monophosphatase. J Cell Biol. 2005;170:1101–11. doi: 10.1083/jcb.200504035. [DOI] [PMC free article] [PubMed] [Google Scholar]
- 47.Chen R, Valencia I, Zhong F, McColl KS, Roderick HL, Bootman MD, Berridge MJ, Conway SJ, Holmes AB, Mignery GA, et al. Bcl-2 functionally interacts with inositol 1,4,5-trisphosphate receptors to regulate calcium release from the ER in response to inositol 1,4,5-trisphosphate. J Cell Biol. 2004;166:193–203. doi: 10.1083/jcb.200309146. [DOI] [PMC free article] [PubMed] [Google Scholar]
- 48.Høyer-Hansen M, Jäättelä M. Connecting endoplasmic reticulum stress to autophagy by unfolded protein response and calcium. Cell Death Differ. 2007;14:1576–82. doi: 10.1038/sj.cdd.4402200. [DOI] [PubMed] [Google Scholar]
- 49.Morishima N, Nakanishi K, Takenouchi H, Shibata T, Yasuhiko Y. An endoplasmic reticulum stress-specific caspase cascade in apoptosis. Cytochrome c-independent activation of caspase-9 by caspase-12. J Biol Chem. 2002;277:34287–94. doi: 10.1074/jbc.M204973200. [DOI] [PubMed] [Google Scholar]
- 50.Bellodi C, Lidonnici MR, Hamilton A, Helgason GV, Soliera AR, Ronchetti M, Galavotti S, Young KW, Selmi T, Yacobi R, et al. Targeting autophagy potentiates tyrosine kinase inhibitor-induced cell death in Philadelphia chromosome-positive cells, including primary CML stem cells. J Clin Invest. 2009;119:1109–23. doi: 10.1172/JCI35660. [DOI] [PMC free article] [PubMed] [Google Scholar]
- 51.Ogata M, Hino S, Saito A, Morikawa K, Kondo S, Kanemoto S, Murakami T, Taniguchi M, Tanii I, Yoshinaga K, et al. Autophagy is activated for cell survival after endoplasmic reticulum stress. Mol Cell Biol. 2006;26:9220–31. doi: 10.1128/MCB.01453-06. [DOI] [PMC free article] [PubMed] [Google Scholar]
- 52.Feng XQ, You Y, Xiao J, Zou P. [Thapsigargin-induced apoptosis of K562 cells and its mechanism] Zhongguo Shi Yan Xue Ye Xue Za Zhi. 2006;14:25–30. [PubMed] [Google Scholar]
- 53.Florio S, Ciarcia R, Crispino L, Pagnini U, Ruocco A, Kumar C, D’Andrilli G, Russo F. Hydrocortisone has a protective effect on CyclosporinA-induced cardiotoxicity. J Cell Physiol. 2003;195:21–6. doi: 10.1002/jcp.10216. [DOI] [PubMed] [Google Scholar]
- 54.Yin T, Wu YL, Sun HP, Sun GL, Du YZ, Wang KK, Zhang J, Chen GQ, Chen SJ, Chen Z. Combined effects of As4S4 and imatinib on chronic myeloid leukemia cells and BCR-ABL oncoprotein. Blood. 2004;104:4219–25. doi: 10.1182/blood-2004-04-1433. [DOI] [PubMed] [Google Scholar]
- 55.Montagnaro S, Ciarcia R, Pagnini F, De Martino L, Puzio MV, Granato GE, Avino F, Pagnini U, Iovane G, Giordano A. Bovine herpesvirus type 4 infection modulates autophagy in a permissive cell line. J Cell Biochem. 2013;114:1529–35. doi: 10.1002/jcb.24494. [DOI] [PubMed] [Google Scholar]
- 56.Florio S, Crispino L, Ciarcia R, Vacca G, Pagnini U, de Matteis A, Pacilio C, D’Andrilli G, Kumar C, Giordano A. MPA increases idarubicin-induced apoptosis in chronic lymphatic leukaemia cells via caspase-3. J Cell Biochem. 2003;89:747–54. doi: 10.1002/jcb.10556. [DOI] [PubMed] [Google Scholar]
- 57.Grynkiewicz G, Poenie M, Tsien RY. A new generation of Ca2+ indicators with greatly improved fluorescence properties. J Biol Chem. 1985;260:3440–50. [PubMed] [Google Scholar]
- 58.Klionsky DJ, Abdalla FC, Abeliovich H, Abraham RT, Acevedo-Arozena A, Adeli K, Agholme L, Agnello M, Agostinis P, Aguirre-Ghiso JA, et al. Guidelines for the use and interpretation of assays for monitoring autophagy. Autophagy. 2012;8:445–544. doi: 10.4161/auto.19496. [DOI] [PMC free article] [PubMed] [Google Scholar]
- 59.Lowry OH, Rosebrough NJ, Farr AL, Randall RJ. Protein measurement with the Folin phenol reagent. J Biol Chem. 1951;193:265–75. [PubMed] [Google Scholar]