Abstract
Hemodynamic stresses are presumed to play an important role in the development of calcific aortic valve disease (CAVD). The elucidation of the shear stress mechanisms involved in the pathogenesis of CAVD has been hampered by the complexity of the native unsteady and side-specific valvular flow environment. To address this gap, this article describes the design and validation of a novel device to expose leaflet samples to time-dependent side-specific shear stress. The device built on a double cone-and-plate geometry was dimensioned based on our previous single-sided shear stress device that minimizes secondary flow effects inherent to this geometry. A fluid–structure interaction (FSI) model was designed to predict the actual shear stress produced on a tissue sample mounted in the new device. Staining was performed on porcine leaflets conditioned in the new bioreactor to assess endothelial integrity and cellular apoptosis. The FSI results demonstrated good agreement between the target (native) and the actual side-specific shear stress produced on a tissue sample. No significant difference in endothelial integrity and cellular apoptosis was detected between samples conditioned for 96 h and fresh controls. This new device will enable the investigation of valvular response to normal and pathologic hemodynamics and the potential mechano-etiology of CAVD.
Keywords: Mechanobiology, Signal transduction, Hemodynamics, Flow, Remodeling, Inflammation
INTRODUCTION
The aortic valve achieves unidirectional blood flow between the left ventricle of the heart and the aorta. It functions in a complex mechanical environment including bending and tensile stresses, pressure, and fluid shear stress.48 Calcific aortic valve disease (CAVD) is the most common aortic valve disorder.37 This condition whose prevalence increases with age is characterized by an accumulation of calcium on the valve leaflets that contributes to the obstruction of the left ventricular outflow and progressive heart failure. Although initially described as an interplay between genetic and cardiovascular risk factors, the etiology of CAVD is increasingly regarded as an active process43 potentially triggered by pathologic alterations of the valve hemodynamic environment.10,35 Resulting from the relative motion between the deforming leaflets and the surrounding blood flow, fluid shear stress plays a critical role in the valve hemodynamic environment and has been identified as a key player in valvular homeostasis.10,41,53 Two of the earliest recognized effects of shear stress on valvular endothelial cells are the re-organization of focal adhesion complexes9 and changes in cytoskeletal alignment as compared to static cells cultures,18 suggesting the sensitivity of the valvular endothelium to this particular mechanical stimulus. Studies have also demonstrated the dependence of valvular remodeling activity on steady shear stress magnitude.41,53 The particular sensitivity of valvular tissue to the local fluid stress environment and the dependence of valvular homeostasis on fluid shear stress also suggest a potential role for hemodynamic stresses in valvular pathogenesis.35,39 Therefore, understanding the complex relationships between valvular tissue biology and the shear stress environment is critical to better understand valvular function and disease progression.
The characterization of the effects of shear stress on valvular biology requires the replication of the native valvular shear stress environment in the laboratory setting. As demonstrated in vivo29 in vitro31–33,52 and in silico15,17,22,45,51 valvular shear stress is side-specific. The ventricular surface of the leaflets is exposed to a high unidirectional pulsatile shear stress, while the aortic surface experiences a low bidirectional oscillatory shear stress (Fig. 1). Two kinds of devices have been utilized to expose valvular cells to shear stress: the parallel-plate flow chamber, and the cone-and-plate viscometer. The former consists of two parallel plates between which fluid flow is established under an imposed pressure gradient. Owing to the large inertia of the driving components, such device is generally limited to the production of a steady shear stress. The cone-and-plate apparatus which consists of an inverted cone rotating above a flat stationary plate36 is more suitable for the production of a time-varying shear stress. Under certain conditions (i.e., low Reynolds number, small angle between the cone, and the plate), this device produces a flow essentially oriented along the circumferential direction and the shear stress distribution τ on the plate can be approximated as
FIGURE 1.
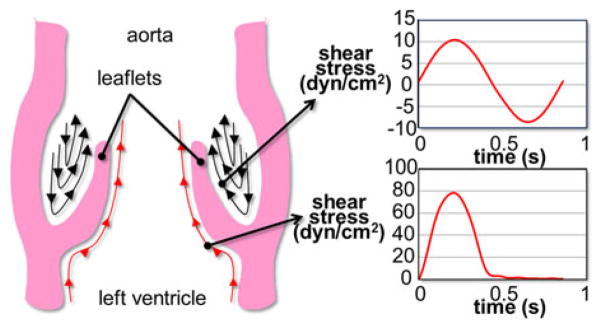
Native side-specific shear stress experienced by aortic valve leaflets over one cardiac cycle.
| (1) |
where μ is the dynamic viscosity of the working fluid, α is the angle between the cone and the plate, h is the distance between the cone apex and the plate, and r is the radial coordinate.7,13,21,36,40,44 Cone-and-plate bioreactors have been used to expose endothelial cell monolayers to time-dependent shear stress.14,19,23,26 Although such devices are suitable for the study of cellular response to shear stress, their implementation with whole pieces of tissue is more problematic due to the thickness of the tissue that results in local flow perturbations and secondary flow. In order to address this issue, we have described in a former study an improved cone-and-plate device to expose aortic valve leaflet samples under controlled time-varying shear stress.48 The device consisted of a cylindrical base containing nine equiangularly spaced wells, each accommodating a cylindrical tissue holder. A circular cover positioned on the base surface was utilized to clamp the periphery of the samples against the holders while exposing one sample surface to flow. Although this design permitted for the first time to expose one surface of leaflet tissue to in vivo-like hemodynamic conditions, its main limitation was its inability to expose simultaneously both leaflet surfaces to different shear stresses, i.e., a requirement for the production of the native side-specific valvular hemodynamic environment. The development of suitable ex vivo models that realistically duplicate the native hemodynamic conditions of valve leaflets is necessary to the understanding of the mechanisms involved in CAVD.
Therefore, the aim of this study was to design and validate a novel device based on the cone-and-plate principle, which is capable of exposing simultaneously but independently both surfaces of aortic valve leaflets to their native side-specific shear stress. The ability of the novel bioreactor to produce the native time-varying shear stress waveforms on both leaflet surfaces was investigated computationally using the commercial fluid–structure interaction (FSI) modeling software ANSYS. The device was also validated biologically with respect to its capability to maintain tissue under viable and sterile conditions for up to 96 h. The implementation of this device in future mechanobiological studies will enable the elucidation of the role played by fluid shear stress in aortic valve biology and its potential involvement in valvular pathogenesis.
MATERIALS AND METHODS
Geometrical and Mechanical Requirements
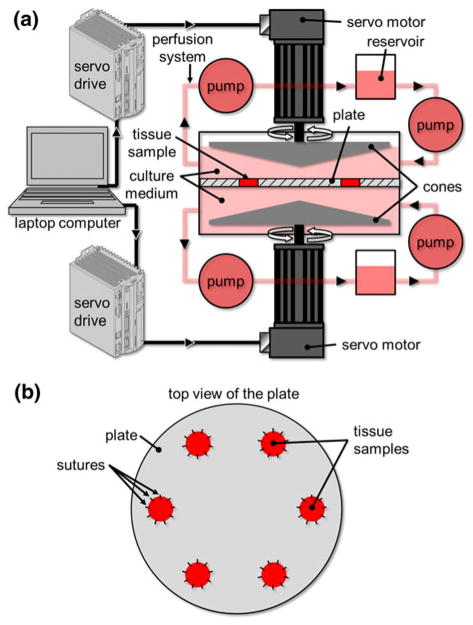
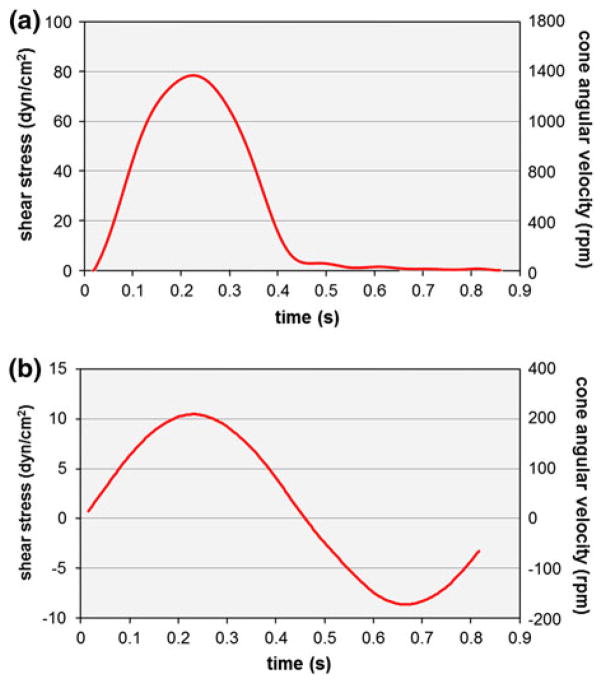
The requirements of the new device are to expose valve leaflet samples to (1) time-varying; (2) side-specific shear stresses. Those requirements were addressed by adopting a double cone-and-plate design consisting of two inverted cones rotating above one side of a plate mounted in the center of the bioreactor and separating the device into two compartments (Fig. 2). The characteristic dimensions (cone diameter: 74 mm; cone angle: 179°; cone apex–plate distance: 200 μm; radial tissue location: 20 mm from the center of the plate) were chosen similar to those adopted in our previous design because of their demonstrated capabilities to limit secondary flow effects.48 The native side-specific shear stress experienced by the aortic and ventricular surfaces of aortic valve leaflets was obtained from computational fluid dynamics simulations of the flow through a trileaflet valve22 (see Fig. 1). This model was chosen for its fine spatial and temporal resolutions and its ability to predict valvular flow under near-physiologic transvalvular pressure and cardiac output conditions. Although the leaflet deformation was prescribed based on a separate structural deformation calculation,24 the model was able to capture the side-specificity of the leaflet wall-shear stress previously described by in vivo magnetic resonance phase-velocity mapping measurements29 as well as the peak-systolic wall-shear stress (79 dyn/cm2) captured by laser-Doppler velocity measurements on the ventricular surface of a polymeric valve.52 Based on the model predictions, the physiologic surface-averaged shear stress experienced by the ventricular surface of the leaflet consisted of pulsatile waveform varying between 0 and 79 dyn/cm2 over a cardiac period of 860 ms while the physiologic surface-averaged shear stress experienced by the aortic surface consisted of a bidirectional oscillatory waveform ranging from −8 to +10 dyn/cm2. With the knowledge of the bioreactor geometry, the location of the tissue samples (r = 20 mm from the center of the plate), the target shear stress variations on both sides of the tissue samples, and the properties of the working fluid (Dulbecco’s Modified Eagle’s Medium–high glucose, Sigma-Aldrich Co., St Louis, MO) as determined in our previous study48 (density: 1000 kg/m3; kinematic viscosity: 0.95 cSt), Eq. (1) was used to determine the respective theoretical cone angular velocities (Fig. 3).
FIGURE 2.
Schematic of the double cone-and-plate device: (a) cone-and-plate device and perfusion system; (b) tissue-mounting plate.
FIGURE 3.
Theoretical cone angular velocities calculated using Eq. (1) and producing the target native shear stress experienced by: (a) the ventricular; and (b) the aortic surface of aortic valve leaflets.
Fluid–Structure Interaction (FSI) Model
The production of two different flow environments in the top and bottom compartments of the bioreactor was expected to result in a pressure differential across the tissue samples, which would lead in turn to tissue deformation. The deflection of the tissue samples under this time-varying pressure gradient could affect the validity of Eq. (1) and the calculated cone velocities. In addition, it was critical to verify that the maximum deflection of the samples remained smaller than the clearance between each cone and the plate. Another concern with the experimental design was the possible strain produced in the samples due to their vertical deflection. Given the particular mechano-sensitivity of aortic valve leaflets to stretch,1,30 it was important to verify that strain levels remained below thresholds known to result in a biological response and that fluid shear stress was the dominant mechanical stimulus experienced by the tissue samples mounted in the bioreactor. Those analyses were conducted computationally using the FSI capabilities of the commercial software ANSYS® CFX. Owing to symmetry, only a 60° section of the bioreactor was modeled. The three-dimensional geometry consisted of a cylindrical tissue sample (diameter: 7 mm; thickness: 0.5 mm) and the fluid domains located in the top and bottom bioreactor compartments. The leaflet material was modeled as linear elastic and isotropic (density: 1056 kg/m3; Young’s modulus: 1.5 MPa; Poisson’s ratio: 0.45), an approximation employed in previous studies11,16,17 and justified by the small size of the tissue samples (diameter: 7 mm). The properties of the culture medium (density: 1000 kg/m3; kinematic viscosity: 0.95 cSt) were assigned to the fluid domains. The lateral surface of the sample in contact with the plate was assigned a fixed-wall condition while the top and bottom surfaces in contact with the fluid domains were modeled as fluid–structure interfaces. The surfaces of the fluid domains interfacing with the top and bottom cones were modeled as moving walls rotating at the angular velocities calculated from Eq. (1) and expected to produce the native ventricular and aortic shear stress waveforms, respectively (see Fig. 3). The periodicity of the geometry was prescribed by assigning an interface condition to the two vertical surfaces bounding the fluid domain. All the other surfaces were modeled as fixed walls. The flow and structure equations were solved using the arbitrary Lagrangian–Eulerian (ALE) approach20 in which the fluid (culture medium) and structure (leaflet sample) domains are discretized using two deforming grids and the fluid mesh is updated at each time step to conform to the moving structure boundary. The structural domain was discretized using 2466 hexahedral elements while the fluid domain (i.e., top and bottom compartments) was meshed using 19,164 hexahedral elements. The flow and leaflet equations were solved implicitly and iteratively until convergence was reached at each time step. A time-stepping of 0.02 s was chosen (i.e., 1/43 of a cardiac cycle). The simulation was initialized with both cones at rest and was run for five periods to eliminate transient effects. The data collected at each time point over the fifth period consisted of the maximum vertical deflection of the tissue sample, the minimum and maximum strains experienced by the sample in the tissue radial (i.e., direction of flow) and circumferential directions, the wall-shear stress distributions on both sides of the tissue sample and the respective instantaneous surface-averaged wall-shear stresses. In addition, the dependence of those metrics on tissue material properties and thickness was investigated via two sensitivity analyses aimed at characterizing the impact of the inherent intersample variability on tissue mechanics. In the first sensitivity analysis, three elastic moduli (1.0, 1.5, and 6.5 MPa) selected in the physiologic range of leaflet radial elastic moduli50 were implemented in the FSI model. The choice of the radial over the circumferential elastic modulus was justified by the particular orientation of the tissue samples in the bioreactor (i.e., radial direction of the samples aligned with the direction of the cone motion) and the expected maximum tissue deformation in that direction. In the second sensitivity analysis, three tissue thicknesses (400, 500, and 600 μm) were implemented in the FSI model while maintaining the thickness of the mounting plate at 500 μm. Those values correspond to the average leaflet thickness ± one standard deviation obtained from measurements performed in our laboratory (n = 6).
Biological Assessment
The ability of the novel shear stress bioreactor to expose biological tissue to native side-specific shear stress while maintaining sterile conditions and preserving the tissue endothelium was tested experimentally. Twelve leaflets were excised from porcine aortic valves obtained from a local slaughterhouse (Martin’s Custom Butchering, Wakarusa, IN) and transported to the laboratory in ice-cold phosphate buffer saline (PBS, Sigma-Aldrich). All subsequent operations were conducted in a sterile flow hood. A circular sample (diameter: 7 mm) was extracted from the basal region of each leaflet using a custom-made tissue punch. Six samples used as fresh controls were immediately embedded in optimal cutting temperature compound (Electron Microscopy Sciences, Hatfield, PA) and flash-frozen in liquid nitrogen, while the six remaining samples were sutured to the plate. The bioreactor was assembled and placed in an incubator at 37 °C and 5% CO2. The perfusion system was turned on to fill both compartments of the cone-and-plate assembly with culture medium (Dulbecco’s Modified Eagle’s Medium supplemented with 3.7 g/L sodium bicarbonate, 0.05 g/L ascorbic acid, 10% non-essential amino acid solution and 1% penicillin–streptomycin; all from Sigma-Aldrich). The cones were programmed with the angular velocities (see Fig. 3) required to expose each surface of the specimens to its specific native shear stress for 96 h. After conditioning, the specimens were embedded in optimal cutting temperature compound and flash-frozen in liquid nitrogen. The blocks containing conditioned tissue and the blocks containing fresh tissue were cut into 7-μm sections taken every 500 μm throughout the depth of the block with a cryostat and were then mounted on glass slides. Endothelium integrity was characterized via von Willebrand factor immunostaining (anti-vWF, Sigma-Aldrich) and silver nitrate en-face staining (Sigma-Aldrich) based on previously documented protocols.25,47 Cellular apoptosis was assessed using TUNEL assay (In Situ cell death detection kit, Roche Diagnostics, Indianapolis, IN). Detections of apoptotic and vWF-positive cells were performed under a mercury lamp using a TR/FITC/DAPI filter. Cells with apoptotic fragments were detected under ultra-violet (UV) fluorescence using the FITC filter of the mercury lamp. The UV filter was used to image DAPI-stained cell nuclei. The apoptosis level was calculated as the ratio of the number of apoptotic cells to the total number of cells on each image. Student t-test was used for testing the difference between the control group and the conditioned tissue group. Given the rough topology of the fibrosa, silver nitrate staining was imaged only on the ventricularis (i.e., surface exposed to the most unfavorable shear stress magnitudes and temporal variations) using a standard light microscope. Endothelial cell coverage on the ventricularis was quantified using Image J (NIH, Bethesda, MD) by calculating the ratio of the number of cells detected by silver nitrate staining to the surface area occupied by the tissue sample on each image. A p-value of less than 0.05 was used as a measure of statistical significance.
RESULTS
Design Solution
Cone-and-Plate Assembly
The complete design solution is shown in Fig. 4a. The tissue-mounting plate consists of a thin circular plate (diameter: 115.4 mm, thickness: 0.5 mm) made of 300-series stainless steel and featuring six equiangularly spaced holes (diameter: 7.0 mm) located at 20 mm from the center of the plate. The plate thickness was chosen to match the measured average thickness of leaflets samples (i.e., 0.5 ± 0.1 mm; n = 6) to minimize the effects of tissue thickness on the surrounding flow. Located around each hole are 10 suture holes (diameter: 0.76 mm) enabling the fixation of the tissue specimens to the plate. Side-specific shear stress is produced by the rotation of two cones made of Delrin (diameter: 74 mm; angle: 179°), each fixed to a stainless-steel shaft (top diameter: 9.5 mm; bottom diameter: 38.1 mm; height: 54 mm) using three screws. Two cylindrical flanges made of polycarbonate (top flange: top outer diameter: 29.7 mm; bottom outer diameter: 115.4 mm; height: 41.5 mm; bottom flange: top outer diameter: 128.0 mm; bottom outer diameter: 27.4 mm; height: 56.9 mm) are made to clamp the periphery of the plate via two “o”-rings (4464T222, McMaster-Carr, Aurora, OH) and close the device via six screws. Two vertical holes drilled through the top surface of the top flange ensure appropriate gas exchange between the culture medium located inside the device and the environment external to the bioreactor. Each flange contains one pair of sealed ball bearings (double sealed bearing 2780T53, McMaster Carr) to permit the rotation of the shafts relative to the flanges with minimal friction. In order to prevent leakage of culture medium through the bottom flange, a rotary shaft-ring seal (9562K42, McMaster-Carr) is mounted between the flange and the shaft above the top ball bearing. The distance between the top cone and the upper surface of the plate is adjusted via a cylindrical shaft collar sitting on the upper-most ball bearing and fixed on the shaft via a set screw. A second screw is threaded on top of the set screw to prevent it from backing out. The required distance of 200 μm between the apex of the cone and the plate is set before assembly by intercalating between the plate and the cone two cover slips (Model 48368-062, VWR Scientific Inc., West Chester, PA) whose combined thickness was measured to be 202 ± 4 μm. A similar solution (shaft collar and set screws) is implemented to adjust the vertical distance between the bottom cone and the lower surface of the plate. After the heights of both cones are adjusted and secured, the cover slips are removed and the device assembled.
FIGURE 4.
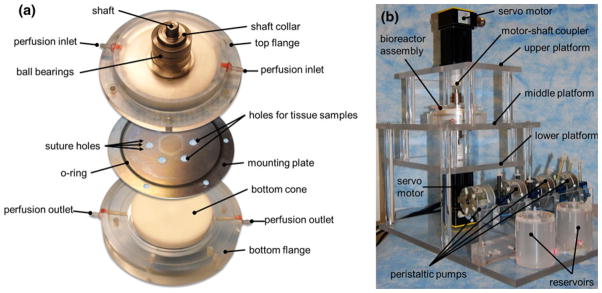
Design solution: (a) exploded view of the cone-and-plate assembly; and (b) mounting table.
Driving and Monitoring System
A table was designed to maintain the cone-and-plate assembly in position during its operation (Fig. 4b). The table made of polycarbonate consists of three horizontal platforms. The top and bottom platforms accommodate the servo motors while the middle platform accommodates the cone-and-plate assembly. The mount is fixed to a rectangular polycarbonate base accommodating the perfusion system which consists of two sealed reservoirs containing culture medium and four peristaltic pumps (SP200FO, APT Instruments, Rochester, IL), and perfusing medium at a constant flow rate of 1.8 mL/min. The total volume of culture medium utilized to run the device is 275 mL: each compartment of the double cone-and-plate bioreactor contains 30 mL of medium while the perfusion system (i.e., reservoirs and Tygon tubing) accommodates 215 mL of medium (each reservoir: 100 mL; tubing: 15 mL). Two rotary servo motors (SM232AE-NPSN, Parker-Hannifin Corp., Cleveland, OH) are fixed to the top and bottom platforms and are coupled to the top and bottom shafts of the cone-and-plate assembly via two helical beam clamp-on coupling devices (2505K133, McMaster-Carr), allowing for both parallel and angular misalignments. The motors are controlled by two single-axis servo drives (Model GV6 K Gemini GV-L3, Parker-Hannifin Corp.). The two drives are linked by a 6-DB9 F/F null modem cable, while one drive is connected to a laptop computer (T400 ThinkPad, Lenovo Inc., Morrisville, NC) running a proprietary servo drive software (Motion Planner, Parker-Hannifin Corp.) via a RJ 45 connector.
Mechanical Validation
Tissue Deflection and Shear Stress Predictions
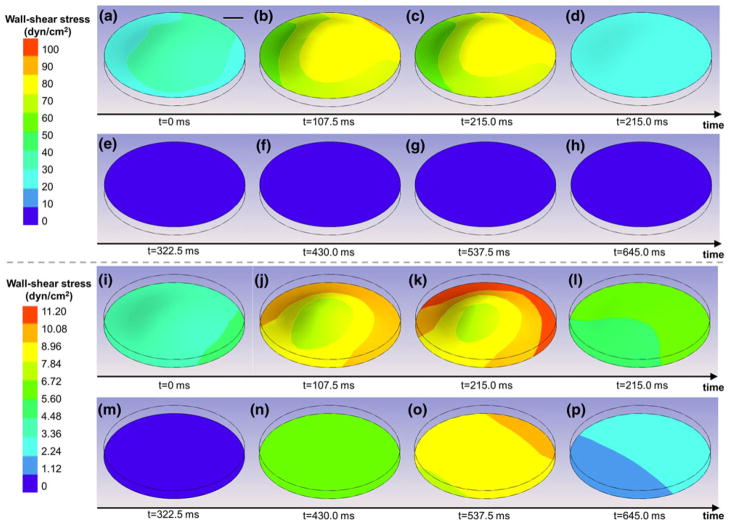
The FSI model of the bioreactor was run to predict the deformation and wall-shear stress distributions on both surfaces of a leaflet sample. The sample deformation and the variations of the wall-shear stress distributions at eight time points on the upper (ventricular) and lower (aortic) surface of the leaflet sample are shown in Figs. 5a–5h and 5i–5p, respectively. The maximum vertical deflection of the sample predicted by the model is 47.7 μm and occurs near peak systole (t = 0.2 s). This deformation is only 8.7% of the total clearance (0.55 mm) between the surface of the cone and the surface of the plate at the location where the sample is mounted. Therefore, the time-dependent pressure gradient across the tissue samples resulting from the production of different flows in the top and bottom compartments of the bioreactor does not cause the tissue to contact the cone and does not impair the normal operation of the device.
FIGURE 5.
FSI predictions of the deformations and wall-shear stress distributions on: (a–h) the ventricular (top); and (i–p) the aortic (bottom) surface of a tissue sample mounted in the bioreactor during one period.
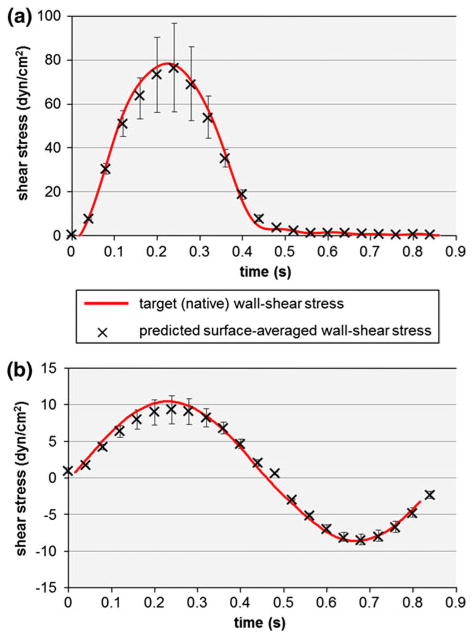
The observation of the shear stress distributions on the lower (aortic) and upper (ventricular) surface of the leaflet sample suggests the non-uniformity of the shear stress on each surface. This non-uniformity can be explained by the deformation of the sample in response to the time-dependent pressure gradient established by the differential rotation of the two cones, the existence of a secondary flow resulting from the finite dimensions of the bioreactor, and the existence of a finite gap between the apex of each cone and the plate. However, the surface-averaged shear stress variations predicted by the FSI model on the top (ventricular) and bottom (aortic) surfaces of the tissue sample are in good agreement with the respective target (native) shear stresses both qualitatively and quantitatively (Fig. 6). The maximum surface-averaged wall-shear stress on the ventricular surface is 76.4 dyn/cm2, which is 3.3% lower than the native maximum wall-shear stress of 79 dyn/cm2 on that surface. Similarly, the maximum surface-averaged wall-shear stress on the aortic surface is 9.4 dyn/cm2, which is 6% lower than the native maximum wall-shear stress of 10 dyn/cm2 on that surface. In addition, the root-mean square errors between the computed and targeted shear stress waveforms are 5.5% and 6.7% of the peak shear stress value on the ventricular and aortic surface, respectively. Therefore, the results demonstrate the ability of the novel shear stress device to expose valvular leaflet tissue to its native side-specific shear stress.
FIGURE 6.
Comparison between the target (native) wall-shear stress and the surface-averaged wall-shear stress predicted by the FSI model over a tissue sample on: (a) the ventricular; and (b) the aortic side of a tissue sample. The error bars indicate the maximum and minimum wall-shear stress values computed over the surface of the tissue sample.
Effect of Tissue Elastic Modulus
The results of the dependence of sample deflection, strain and shear stress distributions on tissue elastic properties are summarized in Table 1. As expected, there is a nearly linear inverse relationship between tissue elastic modulus and sample deflection. The maximum tissue deflection obtained with the smallest elastic modulus considered in this sensitivity study (i.e., 1.0 MPa) is only 13% of the total available clearance between the cone and the plate. Strains were computed in both the sample radial and circumferential directions. As expected, an increase in elastic modulus results in a decrease in strain magnitude in both directions. Interestingly, similar strain magnitudes are obtained in both directions, regardless of the elastic modulus. This can be explained by the isotropic and incompressible material formulation implemented in the FSI model and the location of the maximum tissue deflection near the center of the sample (see Fig. 5). More importantly, the maximum tissue radial and circumferential strains (i.e., 1.1%) obtained with the lowest elastic modulus are negligible as compared to the average strains experienced by aortic valve leaflets in vivo (i.e., radial strain: 40%; circumferential strain: 10%).6,49 Those results demonstrate that shear stress is the dominant mechanical stimulus experienced by the samples mounted in the bioreactor. Finally, there is a weaker correlation between tissue elastic modulus and wall-shear stress. The results suggest 8% decrease and 13% increase in peak surface-averaged wall-shear stress on the ventricular and aortic surface, respectively, in response to a 6.5-fold increase in elastic modulus (from 1.0 to 6.5 MPa).
TABLE 1.
Effect of tissue elastic modulus on sample deflection, strain and, wall-shear stress.
| Elastic modulus (MPa) | Maximum tissue deflection (μm) | Radial strain (%)
|
Circumferential strain (%)
|
Surface-averaged ventricular shear stress (dyn/cm2)
|
Surface-averaged aortic shear stress (dyn/cm2)
|
||||
|---|---|---|---|---|---|---|---|---|---|
| Min | Max | Min | Max | Min | Max | Min | Max | ||
| 1.0 | 72 | −0.5 | 1.1 | −0.5 | 1.1 | 0.6 | 79.1 | −8.5 | 8.9 |
| 1.5 | 48 | −0.4 | 0.7 | −0.4 | 0.7 | 0.6 | 76.4 | −8.5 | 9.4 |
| 6.5 | 11 | −0.1 | 0.2 | −0.1 | 0.2 | 0.6 | 72.8 | −8.5 | 10.1 |
Effect of Tissue Thickness
The effects of tissue thickness on sample deflection, and strain and shear stress distributions are summarized in Table 2. Sample deflection is weakly correlated with tissue thickness. The mounting of a tissue sample 20% thicker and 20% thinner than the plate results in a significant 56% and 85% increase in peak tissue deflection, respectively. Interestingly, while variability in elastic modulus was shown to impact only the maximum strain experienced by the sample (see Table 1), the introduction of a discrepancy between the tissue thickness and the plate thickness affects both the minimum and maximum strain levels. However, the maximum strain level (i.e., 1.5%) resulting from the mounting of a tissue sample 20% thicker than the plate is still negligible as compared to the physiologic leaflet strain levels measured in vivo. Finally, the FSI predictions suggest that variability in sample thickness is associated with variability in wall-shear stress on each sample surface. The mounting of a sample 20% thinner than the plate results in 2% increase and 11% decrease in the ranges of wall-shear stress experienced by the ventricularis and fibrosa, respectively. On the other hand, the mounting of a sample 20% thicker than the plate results in 30% increase and 8% increase in the ranges of wall-shear stress experienced by the ventricularis and fibrosa, respectively.
TABLE 2.
Effect of tissue thickness on sample deflection, strain, and wall-shear stress.
| Tissue thickness (μm) | Maximum tissue deflection (μm) | Radial strain (%)
|
Circumferential strain (%)
|
Surface-averaged ventricular shear stress (dyn/cm2)
|
Surface-averaged aortic shear stress (dyn/cm2)
|
||||
|---|---|---|---|---|---|---|---|---|---|
| Min | Max | Min | Max | Min | Max | Min | Max | ||
| 400 | 75 | −1.1 | 1.2 | −1.0 | 1.0 | 0.6 | 78.3 | −6.7 | 9.2 |
| 500 | 48 | −0.4 | 0.7 | −0.4 | 0.7 | 0.6 | 76.4 | −8.5 | 9.4 |
| 600 | 89 | −1.4 | 1.5 | −1.5 | 1.5 | 0.7 | 99.3 | −9.5 | 9.9 |
Biological Validation
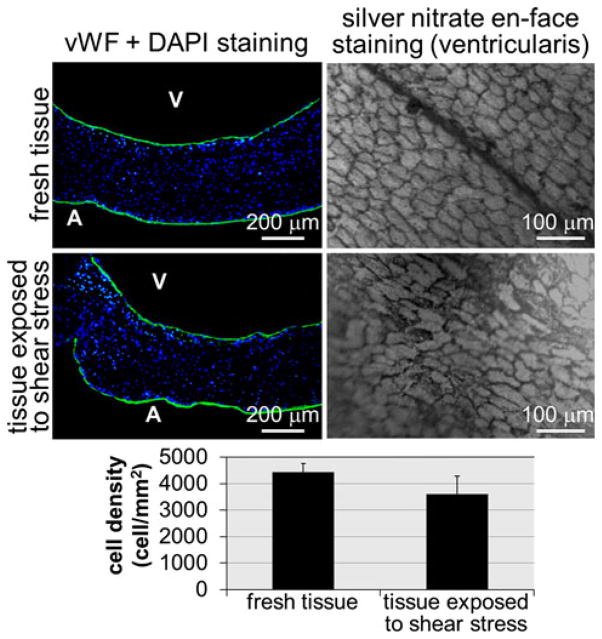
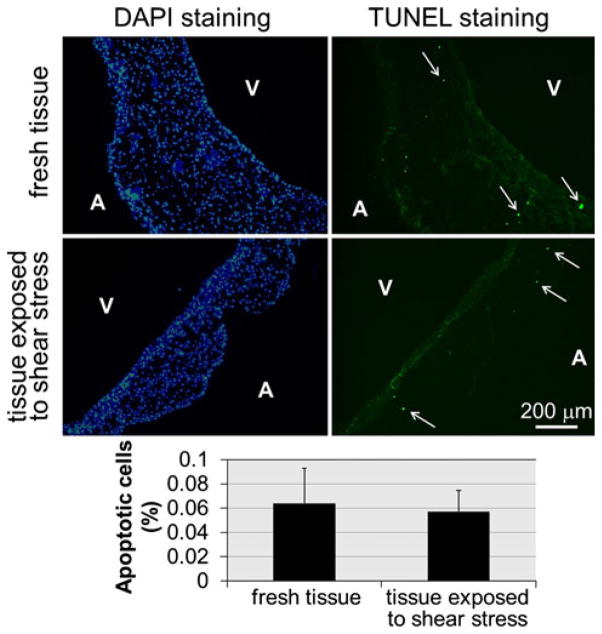
The validated cone angular velocities producing the native side-specific wall-shear stress on the tissue samples were programmed in the servo drives, and after conditioning for 96 h, six porcine aortic valve leaflet specimens were analyzed in terms of endothelial integrity, cellular morphology, and cellular apoptosis. First, it was critical to verify that the shear stress conditions imposed by the culture system did not affect the integrity of the endothelial layer of the tissue samples. The results obtained from vWF immuno-staining demonstrate the preservation of the endothelial layer on each side of the tissue sample exposed to native shear stress conditions (Fig. 7). Silver nitrate en-face staining performed on the ventricularis of fresh tissue, and the tissue exposed to physiologic shear stress for 96 h suggests no qualitative difference in endothelial cell morphology and alignment (Fig. 7). Although the quantitative data suggest a 18% decrease in endothelial cell density on the ventricularis of conditioned tissue relative to that in fresh tissue, this difference was not statistically significant (p > 0.05; n = 5). DAPI staining on fresh tissue and tissue conditioned under physiologic shear stress shows that normal cell morphology and viability were maintained during culture in the novel cone-and-plate device (Fig. 8). No cell fragments or apoptotic bodies were detected. In addition, minor cellular apoptosis was detected via TUNEL assay throughout the tissue in both tissue groups (Fig. 8). Cellular apoptosis, where observed, was not localized to either side of the leaflet and was distributed in the endothelial, sub-endothelial and interstitial layers of the tissue. Specimens exposed to native side-specific shear stress in the bioreactor were characterized by a percentage of apoptotic cells (0.057 ± 0.018%) not statistically different (p > 0.05; n = 6) from that calculated on fresh tissue (0.064 ± 0.029%). Although no quantitative assessments of tissue necrosis and medium sterility were performed, the regular inspection of the culture medium during each experimental run did not evidence any trace of contamination or loss of sterility. This biological validation demonstrates the ability of the bio-reactor to maintain leaflet structure, cell viability, and cell proliferation for the intended culture duration of 96 h.
FIGURE 7.
Comparison of endothelium integrities in fresh tissue and tissue exposed to physiologic shear stress for 96 h: vWF and DAPI staining (A: aortic surface; V: ventricular surface; green: vWF-positive cells; blue: DAPI-positive cells); silver nitrate en-face staining on the ventricularis; and quantification of endothelial cell coverage (error bars indicate standard deviation; n = 5).
FIGURE 8.
TUNEL and DAPI stainings on fresh tissue and tissue exposed to native side-specific shear stress for 96 h (A: aortic surface; V: ventricular surface; green: apoptotic cells; blue: DAPI-positive cells); and quantitative results (error bars indicate standard deviation; n = 6).
DISCUSSION
CAVD that causes 44,000 deaths annually has a significant societal impact.37 The exploration of the next generation of therapeutic targeted cellular strategies that will focus on early detection and management of CAVD though non-invasive methods requires the elucidation of the mechanisms involved in valvular pathogenesis. Although mechanical forces are increasingly pointed as potential regulators of CAVD, the investigation of their effects on valvular biology has been hampered by the complexity of the native valvular hemodynamics characterized by unsteadiness and side-specificity. As pointed out by the Working Group on calcific aortic stenosis appointed in 2009 by the National Heart, Lung, and Blood Institute (see http://www.nhlbi.nih.gov/meetings/workshops/cas.htm), the development and validation of improved models are needed to realistically duplicate the conditions in which human CAVD develops. Therefore, the capability of our novel shear stress device to condition leaflet tissue to in vivo-like side-specific shear stress is a critical and significant improvement over previous devices restricted to the exposure of cell monolayers3,4,8 or only one side of tissue samples48 to shear stress.
Although the novel shear stress device was validated with respect to its capability to replicate the native physiologic valvular shear stress, it could also be programmed to expose leaflet samples to shear stress stimuli linked to conditions leading to CAVD. For example, hypertension, which is a known risk factor for valvular calcification,42 has been associated with changes in transvalvular flow rate27,28,34 that could lead in turn to abnormal leaflet wall-shear stress. Similarly, abnormal valve anatomies such as bicuspid and stenotic aortic valves which are prone to calcification generate significant hemodynamic abnormalities2,12,38 that could also result in shear stress alterations. Finally, patients with Paget’s disease who experience chronically elevated stroke volume are more prone to valvular calcification.46 Studies on the characterization of the side-specific shear stress experienced by valve leaflets under such conditions are currently under way in our laboratory. Specifically, we are developing computational and experimental methodologies based on FSI modeling and particle-image velocimetry, respectively, to capture the native valvular shear stress state under such conditions. The programming of the new shear stress device with those pathological waveforms will permit to investigate the effects of pathologically relevant shear stresses on valvular pathogenesis.
Although the results of the two sensitivity analyses demonstrate the dependence of sample deflection, strain and wall-shear stress on tissue elastic properties and thickness, the tissue strains resulting from the differential pressure between the top and bottom compartments of the bioreactor are negligible as compared to the physiologic levels experienced in vivo6,49 and remain below the thresholds known to trigger a biological response.1,30 These results demonstrate the capability of the bioreactor to expose tissue samples to isolated shear stress. In addition, the wall-shear stress distribution on each side of the samples is minimally impacted by physiologic variations in elastic modulus. Therefore, provided that intersample variability can be maintained within an acceptable range, the characterization of the tissue mechanical properties before an experiment is not necessary. In contrast, the established dependence of sample wall-shear stress on tissue thickness demonstrates the need to minimize the discrepancy between the thickness of the mounting plate and that of the samples. Practically, this will be achieved by fabricating mounting plates of different thicknesses. Variability in intersample thickness will be compensated for by measuring the thickness of each sample before an experiment, selecting a group of samples characterized by the same thickness, and selecting a mounting plate whose thickness closely matches that of the samples. The bioreactor operating conditions will have to be re-formulated following the same FSI modeling approach as that described in this article to account for the effect of the new plate geometry on the shear stress produced on the surface of the samples. It is important to note that the novel shear stress device will be primarily implemented to study the role played by shear stress resulting from abnormal (e.g., hypertensive, high cardiac output) flow conditions, which will involve the exposure of normal tissue to abnormal hemodynamics. The use of leaflet samples systematically excised from the basal region of aortic valve leaflets obtained from 6-month-old pigs will greatly limit intersample variability. Although the implementation of the bioreactor with samples extracted from a different leaflet region or from an abnormal leaflet is possible, it would first require the characterization of the specific material properties and thickness of the tissue specimens before an experiment. An FSI approach similar to that described in this article could then be followed to determine suitable operating conditions (i.e., cone angular velocities) producing the desired shear stress environment.
As compared to our previous single-sided shear stress device48 that permitted the exposure of valvular tissue to shear stress for up to 48 h, the new device was shown to maintain sterile conditions and to preserve tissue integrity for 96 h. This significant extension in conditioning time is achieved because of the production of a more realistic shear stress environment and the exposure of both tissue sides to culture medium. This capability will be useful in investigating the effects of shear stress on the rate of valvular biological response.
Finally, the native valvular hemodynamic stress environment includes stretch, pressure, and flow. Ex vivo and in vitro studies have shown that each mechanical signal results in a specific response in terms of cellular alignment, proliferation, biosynthetic activity, tissue remodeling, and tissue pathogenesis. While the response of leaflet tissue to isolated fluid shear stress is important, the effects of combined mechanical forces need to be considered to obtain a complete understanding of valvular biology. Therefore, the new shear stress device could be complemented by a flexible plate5 exposing the samples to cyclic strain and a pressure chamber54 enclosing the cone-and-plate assembly and achieving desired levels of cyclic pressure.
Acknowledgments
The authors would like to thank Dr. Fotis Sotiropoulos and Dr. Liang Ge (University of Minnesota, Minneapolis, MN) for providing the shear stress data of their computational fluid dynamic aortic valve model; Dr. Santanu Chandra (University of Notre Dame, Notre Dame, IN) for his feedback; and Martin’s Custom Butchering (Wakarusa, IN) for supplying porcine hearts for this research.
References
- 1.Balachandran K, Konduri S, Sucosky P, Jo H, Yoganathan AP. An ex vivo study of the biological properties of porcine aortic valves in response to circumferential cyclic stretch. Ann Biomed Eng. 2006;34:1655–1665. doi: 10.1007/s10439-006-9167-8. [DOI] [PMC free article] [PubMed] [Google Scholar]
- 2.Beppu S, Suzuki S, Matsuda H, Ohmori F, Nagata S, Miyatake K. Rapidity of progression of aortic stenosis in patients with congenital bicuspid aortic valves. Am J Cardiol. 1993;71:322–327. doi: 10.1016/0002-9149(93)90799-i. [DOI] [PubMed] [Google Scholar]
- 3.Blackman BR, Barbee KA, Thibault LE. In vitro cell shearing device to investigate the dynamic response of cells in a controlled hydrodynamic environment. Ann Biomed Eng. 2000;28:363–372. doi: 10.1114/1.286. [DOI] [PubMed] [Google Scholar]
- 4.Blackman BR, Garcia-Cardena G, Gimbrone MA., Jr A new in vitro model to evaluate differential responses of endothelial cells to simulated arterial shear stress waveforms. J Biomech Eng. 2002;124:397–407. doi: 10.1115/1.1486468. [DOI] [PubMed] [Google Scholar]
- 5.Breen LT, McHugh PE, McCormack BA, Muir G, Quinlan NJ, Heraty KB, Murphy BP. Development of a novel bioreactor to apply shear stress and tensile strain simultaneously to cell monolayers. Rev Sci Instrum. 2006;77:104301. [Google Scholar]
- 6.Brewer RJ, Mentzer RM, Jr, Deck JD, Ritter RC, Trefil JS, Nolan SP. An in vivo study of the dimensional changes of the aortic valve leaflets during the cardiac cycle. J Thorac Cardiovasc Surg. 1977;74:645–650. [PubMed] [Google Scholar]
- 7.Buschmann MH, Dieterich P, Adams NA. Analysis of flow in cone-and-plate apparatus with respect to spatial and temporal effects on endothelial cells. Biotechnol Bioeng. 2004;89:493–502. doi: 10.1002/bit.20165. [DOI] [PubMed] [Google Scholar]
- 8.Bussolari SR, Dewey CF, Jr, Gimbrone MA., Jr Apparatus for subjecting living cells to fluid shear stress. Rev Sci Instrum. 1982;53:1851–1854. doi: 10.1063/1.1136909. [DOI] [PubMed] [Google Scholar]
- 9.Butcher JT, Penrod AM, Garcia AJ, Nerem RM. Unique morphology and focal adhesion development of valvular endothelial cells in static and fluid flow environments. Arterioscler Thromb Vasc Biol. 2004;24:1429–1434. doi: 10.1161/01.ATV.0000130462.50769.5a. [DOI] [PubMed] [Google Scholar]
- 10.Butcher JT, Simmons CA, Warnock JN. Mechanobiology of the aortic heart valve. J Heart Valve Dis. 2008;17:62–73. [PubMed] [Google Scholar]
- 11.Cacciola G, Peters GW, Schreurs PJ. A three-dimensional mechanical analysis of a stentless fibre-reinforced aortic valve prosthesis. J Biomech. 2000;33:521–530. doi: 10.1016/s0021-9290(99)00222-5. [DOI] [PubMed] [Google Scholar]
- 12.Chambers JB. Aortic stenosis. Eur J Echocardiogr. 2009;10:i11–i19. doi: 10.1093/ejechocard/jen240. [DOI] [PubMed] [Google Scholar]
- 13.Chung CA, Tzou MR, Ho RW. Oscillatory flow in a cone-and-plate bioreactor. J Biomech Eng. 2005;127:601–610. doi: 10.1115/1.1933964. [DOI] [PubMed] [Google Scholar]
- 14.Dai G, Natarajan S, Zhang Y, Vaughn S, Blackman BR, Kamm RD, Garcia-Cardena G, Gimbrone MA., Jr Distinct endothelial phenotypes evoked by arterial waveforms derived from atherosclerosis-susceptible and -resistant regions of human vasculature. Proc Natl Acad Sci. 2004;101:14871–14876. doi: 10.1073/pnas.0406073101. [DOI] [PMC free article] [PubMed] [Google Scholar]
- 15.De Hart J, Baaijens FP, Peters GW, Schreurs PJ. A computational fluid-structure interaction analysis of a fiber-reinforced stentless aortic valve. J Biomech. 2003;36:699–712. doi: 10.1016/s0021-9290(02)00448-7. [DOI] [PubMed] [Google Scholar]
- 16.De Hart J, Peters GWM, Schreurs PJG, Baaijens FPT. A two-dimensional fluid-structure interaction model of the aortic valve. J Biomech. 2000;33:1079–1088. doi: 10.1016/s0021-9290(00)00068-3. [DOI] [PubMed] [Google Scholar]
- 17.De Hart J, Peters GWM, Schreurs PJG, Baaijens FPT. A three-dimensional computational analysis of fluid-structure interaction in the aortic valve. J Biomech. 2003;36:103–112. doi: 10.1016/s0021-9290(02)00244-0. [DOI] [PubMed] [Google Scholar]
- 18.Deck JD. Endothelial cell orientation on aortic valve leaflets. Cardiovasc Res. 1986;20:760–767. doi: 10.1093/cvr/20.10.760. [DOI] [PubMed] [Google Scholar]
- 19.Dewey CF, Jr, Bussolari SR, Gimbrone MA, Jr, Davies PF. The dynamic response of vascular endothelial cells to fluid shear stress. J Biomech Eng. 1981;103:177–185. doi: 10.1115/1.3138276. [DOI] [PubMed] [Google Scholar]
- 20.Donea J, Guiliani S, Halleux JP. An arbitrary Lagrangian-Eulerian finite-element method for transient dynamic fluid structure interactions. Comput Methods Appl Mech Eng. 1982;33:689–723. [Google Scholar]
- 21.Fewell ME, Hellums JD. The secondary flow of Newtonian fluids in cone-and-plate viscometers. Trans Soc Rheol. 1977;21:535–565. [Google Scholar]
- 22.Ge L, Sotiropoulos F. Direction and magnitude of blood flow shear stresses on the leaflets of aortic valves: is there a link with valve calcification? J Biomech Eng. 2010;132:014505. doi: 10.1115/1.4000162. [DOI] [PubMed] [Google Scholar]
- 23.Go YM, Patel RP, Maland MC, Park H, Beckman JS, Darley-Usmar VM, Jo H. Evidence for peroxynitrite as a signaling molecule in flow-dependent activation of c-Jun NH(2)-terminal kinase. Am J Physiol. 1999;277:H1647–H1653. doi: 10.1152/ajpheart.1999.277.4.H1647. [DOI] [PubMed] [Google Scholar]
- 24.Haj-Ali R, Dasi LP, Kim HS, Choi J, Leo HW, Yoganathan AP. Structural simulations of prosthetic tri-leaflet aortic heart valves. J Biomech. 2008;41:1510–1519. doi: 10.1016/j.jbiomech.2008.02.026. [DOI] [PubMed] [Google Scholar]
- 25.Hajra L, Evans AI, Chen M, Hyduk SJ, Collins T, Cybulsky MI. The NF-kappa B signal transduction pathway in aortic endothelial cells is primed for activation in regions predisposed to atherosclerotic lesion formation. Proc Natl Acad Sci USA. 2000;97:9052–9057. doi: 10.1073/pnas.97.16.9052. [DOI] [PMC free article] [PubMed] [Google Scholar]
- 26.Jo H, Song H, Mowbray A. Role of NADPH oxidases in disturbed flow- and BMP4-induced inflammation and atherosclerosis. Antioxidants Redox Signal. 2006;8:1609–1619. doi: 10.1089/ars.2006.8.1609. [DOI] [PubMed] [Google Scholar]
- 27.Kadem L, Dumesnil JG, Rieu R, Durand LG, Garcia D, Pibarot P. Impact of systemic hypertension on the assessment of aortic stenosis. Heart. 2005;91:354–361. doi: 10.1136/hrt.2003.030601. [DOI] [PMC free article] [PubMed] [Google Scholar]
- 28.Kaden JJ, Haghi D. Hypertension in aortic valve stenosis—a Trojan horse. Eur Heart J. 2008;29:1934–1935. doi: 10.1093/eurheartj/ehn306. [DOI] [PubMed] [Google Scholar]
- 29.Kilner PJ, Yang GZ, Wilkes AJ, Mohiaddin RH, Firmin DN, Yacoub MH. Asymmetric redirection of flow through the heart. Nature. 2000;404:759–761. doi: 10.1038/35008075. [DOI] [PubMed] [Google Scholar]
- 30.Ku CH, Johnson PH, Batten P, Sarathchandra P, Chambers RC, Taylor PM, Yacoub MH, Chester AH. Collagen synthesis by mesenchymal stem cells and aortic valve interstitial cells in response to mechanical stretch. Cardiovasc Res. 2006;71:548–556. doi: 10.1016/j.cardiores.2006.03.022. [DOI] [PubMed] [Google Scholar]
- 31.Leo HL, Dasi LP, Carberry J, Simon HA, Yoganathan AP. Fluid dynamic assessment of three polymeric heart valves using particle image velocimetry. Ann Biomed Eng. 2006;34:936–952. doi: 10.1007/s10439-006-9117-5. [DOI] [PubMed] [Google Scholar]
- 32.Leo HL, Simon H, Carberry J, Lee SC, Yoganathan AP. A comparison of flow field structures of two tri-leaflet polymeric heart valves. Ann Biomed Eng. 2005;33:429–443. doi: 10.1007/s10439-005-2498-z. [DOI] [PubMed] [Google Scholar]
- 33.Lim WL, Chew YT, Chew TC, Low HT. Pulsatile flow studies of a porcine bioprosthetic aortic valve in vitro: PIV measurements and shear-induced blood damage. J Biomech. 2001;34:1417–1427. doi: 10.1016/s0021-9290(01)00132-4. [DOI] [PubMed] [Google Scholar]
- 34.Mascherbauer J, Fuchs C, Stoiber M, Schima H, Pernicka E, Maurer G, Baumgartner H. Systemic pressure does not directly affect pressure gradient and valve area estimates in aortic stenosis in vitro. Eur Heart J. 2008;29:2049–2057. doi: 10.1093/eurheartj/ehn209. [DOI] [PubMed] [Google Scholar]
- 35.Merryman WD. Mechano-potential etiologies of aortic valve disease. J Biomech. 2010;43:87–92. doi: 10.1016/j.jbiomech.2009.09.013. [DOI] [PMC free article] [PubMed] [Google Scholar]
- 36.Mooney M, Ewart RH. The conicylindrical viscometer. Physics. 1934;5:350–354. 350. [Google Scholar]
- 37.Nkomo VT, Gardin JM, Skelton TN, Gottdiener JS, Scott CG, Enriquez-Sarano M. Burden of valvular heart diseases: a population-based study. Lancet. 2006;368:1005–1011. doi: 10.1016/S0140-6736(06)69208-8. [DOI] [PubMed] [Google Scholar]
- 38.Otto CM. Valvular aortic stenosis: disease severity and timing of intervention. J Am Coll Cardiol. 2006;47:2141–2151. doi: 10.1016/j.jacc.2006.03.002. [DOI] [PubMed] [Google Scholar]
- 39.Otto CM, Kuusisto J, Reichenbach DD. Characterization of the early lesion of ‘degenerative’ valvular aortic stenosis. Histological and immunohistochemical studies. Circulation. 1994;90:844–853. doi: 10.1161/01.cir.90.2.844. [DOI] [PubMed] [Google Scholar]
- 40.Pelech I, Shapiro AH. Flexible disk rotating on a gas film next to a wall. J Appl Mech. 1964;31:577–584. [Google Scholar]
- 41.Platt MO, Xing Y, Jo H, Yoganathan AP. Cyclic pressure and shear stress regulate matrix metalloproteinases and cathepsin activity in porcine aortic valves. J Heart Valve Dis. 2006;15:622–629. [PubMed] [Google Scholar]
- 42.Rabkin SW. The association of hypertension and aortic valve sclerosis. Blood Press. 2005;14:264–272. doi: 10.1080/08037050500233320. [DOI] [PubMed] [Google Scholar]
- 43.Rajamannan NM, Subramaniam M, Rickard D, Stock SR, Donovan J, Springett M, Orszulak T, Fullerton DA, Tajik AJ, Bonow RO, Spelsberg T. Human aortic valve calcification is associated with an osteoblast phenotype. Circulation. 2003;107:2181–2184. doi: 10.1161/01.CIR.0000070591.21548.69. [DOI] [PMC free article] [PubMed] [Google Scholar]
- 44.Sdougos HP, Bussolari SR, Dewey CF. Secondary flow and turbulence in a cone-and-plate device. J Fluid Mech. 1984;138:379–404. [Google Scholar]
- 45.Sotiropoulos F, Borazjani I. A review of state-of-the-art numerical methods for simulating flow through mechanical heart valves. Med Biol Eng Comput. 2009;47:245–256. doi: 10.1007/s11517-009-0438-z. [DOI] [PMC free article] [PubMed] [Google Scholar]
- 46.Strickberger SA, Schulman SP, Hutchins GM. Association of Paget’s disease of bone with calcific aortic valve disease. Am J Med. 1987;82:953–956. doi: 10.1016/0002-9343(87)90157-4. [DOI] [PubMed] [Google Scholar]
- 47.Sucosky P, Balachandran K, Elhammali A, Jo H, Yoganathan AP. Altered shear stress stimulates upregulation of endothelial VCAM-1 and ICAM-1 in a BMP-4-and TGF-beta1-dependent pathway. Arterioscler Thromb Vasc Biol. 2009;29:254–260. doi: 10.1161/ATVBAHA.108.176347. [DOI] [PMC free article] [PubMed] [Google Scholar]
- 48.Sucosky P, Padala M, Elhammali A, Balachandran K, Jo H, Yoganathan AP. Design of an ex vivo culture system to investigate the effects of shear stress on cardiovascular tissue. J Biomech Eng. 2008;130:035001-1–035001-8. doi: 10.1115/1.2907753. [DOI] [PMC free article] [PubMed] [Google Scholar]
- 49.Thubrikar M, Nolan SP, Bosher LP, Deck JD. The cyclic changes and structure of the base of the aortic valve. Am Heart J. 1980;99:217–224. doi: 10.1016/0002-8703(80)90768-1. [DOI] [PubMed] [Google Scholar]
- 50.Thubrikar M, Piepgrass WC, Bosher LP, Nolan SP. The elastic modulus of canine aortic valve leaflets in vivo and in vitro. Circ Res. 1980;47:792–800. doi: 10.1161/01.res.47.5.792. [DOI] [PubMed] [Google Scholar]
- 51.Weinberg EJ, Kaazempur Mofrad MR. A multiscale computational comparison of the bicuspid and tri-cuspid aortic valves in relation to calcific aortic stenosis. J Biomech. 2008;41:3482–3487. doi: 10.1016/j.jbiomech.2008.08.006. [DOI] [PubMed] [Google Scholar]
- 52.Weston MW, LaBorde DV, Yoganathan AP. Estimation of the shear stress on the surface of an aortic valve leaflet. Ann Biomed Eng. 1999;27:572–579. doi: 10.1114/1.199. [DOI] [PubMed] [Google Scholar]
- 53.Weston MW, Yoganathan AP. Biosynthetic activity in heart valve leaflets in response to in vitro flow environments. Ann Biomed Eng. 2001;29:752–763. doi: 10.1114/1.1397794. [DOI] [PubMed] [Google Scholar]
- 54.Xing Y, Warnock JN, He Z, Hilbert SL, Yoganathan AP. Cyclic pressure affects the biological properties of porcine aortic valve leaflets in a magnitude- and frequency-dependent manner. Ann Biomed Eng. 2004;32:1461–1470. doi: 10.1114/b:abme.0000049031.07512.11. [DOI] [PubMed] [Google Scholar]


