Abstract
Background
Neonatal anthropometric charts of the distribution of measurements, mainly birth weight, taken at different gestational ages are widely used by obstetricians and pediatricians. However, the relationship between delivery mode and neonatal anthropometric data has not been investigated in Japan or other countries.
Methods
The subjects were selected from the registration database of the Japan Society of Obstetrics and Gynecology (2003–2005). Tenth centile, median, and 90th centile of birth weight by sex, birth order, and delivery mode were observed by gestational age from 22 to 42 weeks among eligible singleton births.
Results
After excluding 248 outliers and 5243 births that did not satisfy the inclusion criteria, 144 980 births were included in the analysis. The distribution of 10th centile curves was skewed toward lower birth weights during the preterm period among both first live births and second and later live births delivered by cesarean section. More than 40% of both male and female live births were delivered by cesarean section at 37 weeks or earlier.
Conclusions
The large proportion of cesarean sections influenced the skewness of the birth weight distribution in the preterm period.
Key words: birth weight, distribution, gestational age, cesarean section, preterm
INTRODUCTION
Neonatal anthropometric charts are based on the distribution of measurements, mainly birth weight, of neonates at different gestational ages.1 The Japanese neonatal anthropometric charts, which were revised in 1995,2 are widely distributed to Japanese obstetricians and pediatricians for managing pregnancy and newborns.
Because more than 10 years had passed since publishing the revised charts, the research committee of the Ministry of Health, Welfare, and Labour for Multicenter Benchmark Research on Neonatal Outcomes in Japan attempted to develop new anthropometric charts. Due to the small sample size, the 1995 charts only contained data classified by sex and birth order. Using the registration database of the Japan Society of Obstetrics and Gynecology (JSOG), which includes a large number of pregnant women and their babies, we attempted to construct charts by mode of delivery, ie, vaginal delivery and cesarean section, as well as sex and birth order. This delivery mode-specific chart is unique to Japan, as no such chart exists in other countries.3–7 In this study, we describe the different birth-weight distributions by gestational age and mode of delivery and discuss the factors that influenced this distribution.
METHODS
JSOG manages a registration system for pregnant women and their infants. To construct new neonatal anthropometric charts, we collected data from 2003 to 2005 on gestational age, birth weight, sex, birth order, and information on complications of singleton births from this database. Because JSOG approved the use of their database for the purpose of creating new neonatal anthropometric charts, this study was not subject to institutional review. Stillborn infants and those with severe asphyxia (Apgar score of 0 at 1 and 5 minutes after delivery), hydrops, or malformations were excluded from the analysis. Infants with missing information on sex or gestational age were also excluded.
Regarding mode of delivery, 6 modes were reported in the registration database: natural vaginal delivery, vacuum-assisted vaginal delivery, forceps-assisted vaginal delivery, elective cesarean section, emergency cesarean section, and others. Natural vaginal delivery, vacuum-assisted vaginal delivery, and forceps-assisted vaginal delivery were defined as vaginal delivery, and elective and emergency cesarean sections were defined as cesarean delivery in this study. Because more than 80% of births delivered by elective cesarean section were delivered from 37 to 41 gestational weeks and approximately 60% of those delivered by emergency cesarean section were delivered at 36 week or earlier, we combined these modes of delivery in the analysis. Pregnant women for whom mode of delivery was classified as “others” were excluded from this analysis.
First, 10th centile, median, and 90th centile of birth weight by sex and birth order (first live births or second and later live births) were observed by gestational age from 22 to 42 weeks among all eligible births. Then, a similar observation was made by delivery mode. The values obtained were then plotted and fitted to cubic curves using the least squares method.
RESULTS
During the study period, 147 medical facilities participated in the JSOG registration system, and 150 471 singleton births were reported to the registration database. A total of 5243 births were excluded from the analysis; thus, the study population comprised 145 228 births. Then, an additional 248 clinical outliers were excluded from this population. Consequently, 144 980 singleton births (74 740 boys and 70 240 girls) were included in the analysis (Table 1). Among the 74 740 boys, 39 707 were first live births and 35 033 were second or later live births. Among the 70 240 girls, 36 827 and 33 413 were first live births and second or later live births, respectively.
Table 1. Number of singleton births by gestational week and birth order, 2003–2005.
| Gestational week | Male | Female | ||||
| First live births | Second and later live births | Total | First live births | Second and later live births | Total | |
| 22 | 26 | 30 | 56 | 21 | 30 | 51 |
| 23 | 76 | 63 | 139 | 48 | 52 | 100 |
| 24 | 92 | 107 | 199 | 73 | 84 | 157 |
| 25 | 103 | 129 | 232 | 96 | 125 | 221 |
| 26 | 140 | 122 | 262 | 97 | 152 | 249 |
| 27 | 156 | 185 | 341 | 135 | 129 | 264 |
| 28 | 203 | 202 | 405 | 151 | 175 | 326 |
| 29 | 197 | 209 | 406 | 161 | 170 | 331 |
| 30 | 252 | 234 | 486 | 228 | 222 | 450 |
| 31 | 273 | 304 | 577 | 236 | 235 | 471 |
| 32 | 393 | 417 | 810 | 300 | 325 | 625 |
| 33 | 502 | 486 | 988 | 381 | 382 | 763 |
| 34 | 741 | 653 | 1394 | 517 | 533 | 1050 |
| 35 | 944 | 876 | 1820 | 724 | 680 | 1404 |
| 36 | 1537 | 1428 | 2965 | 1240 | 1262 | 2502 |
| 37 | 3720 | 5083 | 8803 | 3306 | 4561 | 7867 |
| 38 | 6691 | 8126 | 14 817 | 5751 | 7424 | 13 175 |
| 39 | 9698 | 8301 | 17 999 | 8795 | 7846 | 16 641 |
| 40 | 9271 | 6129 | 15 400 | 9446 | 6756 | 16 202 |
| 41 | 4463 | 1894 | 6357 | 4812 | 2186 | 6998 |
| 42 | 229 | 55 | 284 | 309 | 84 | 393 |
| Total | 39 707 | 35 033 | 74 740 | 36 827 | 33 413 | 70 240 |
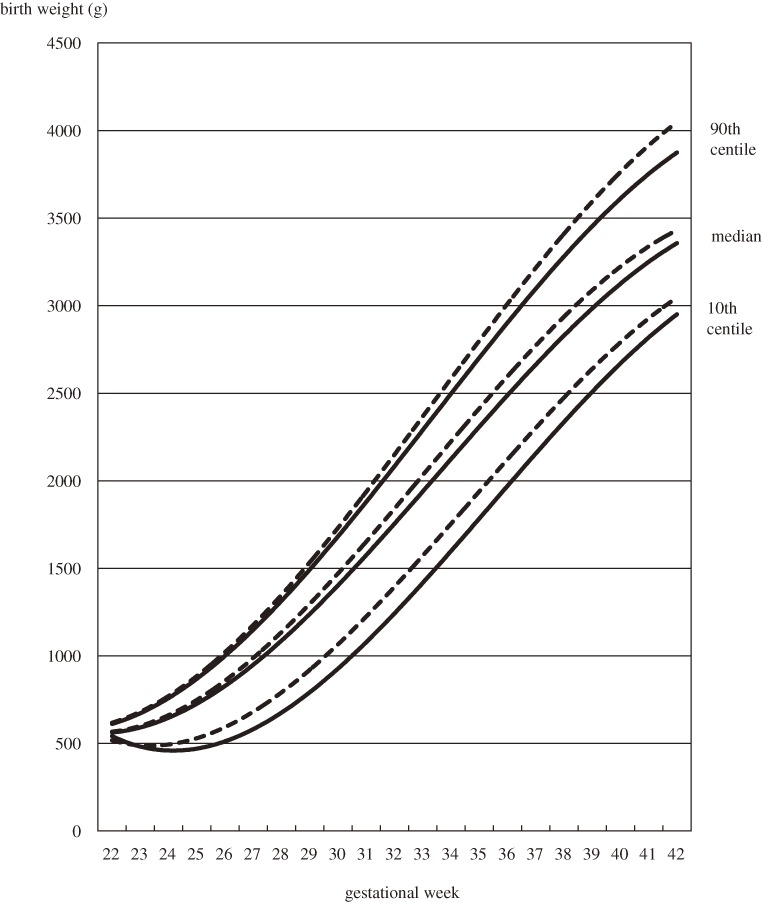
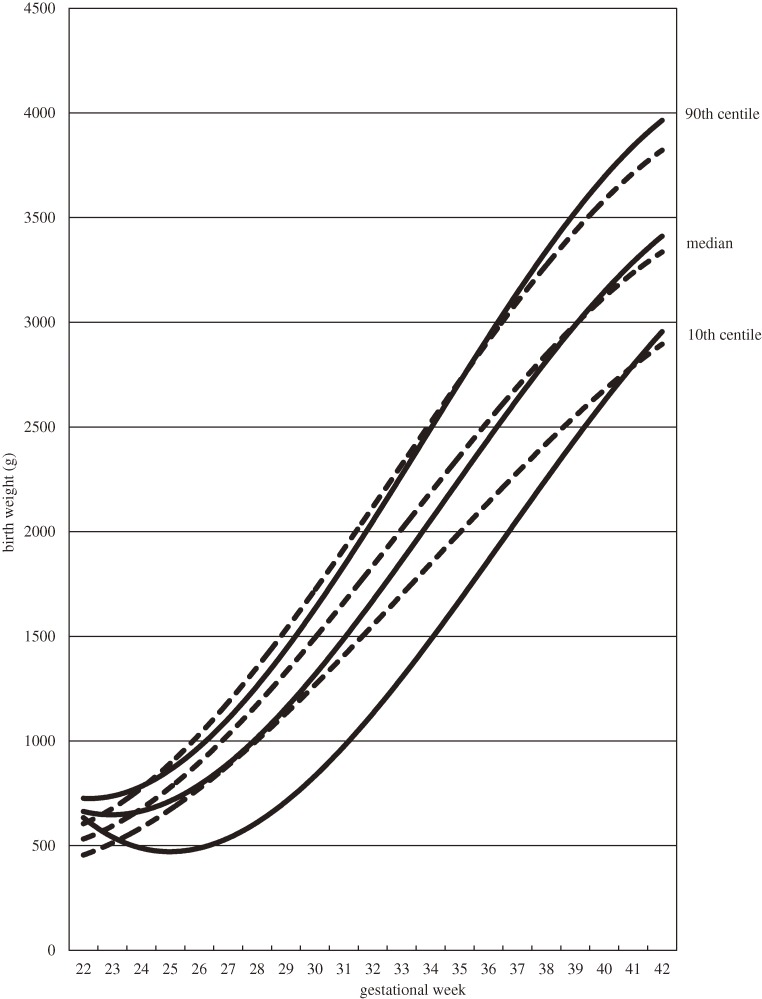
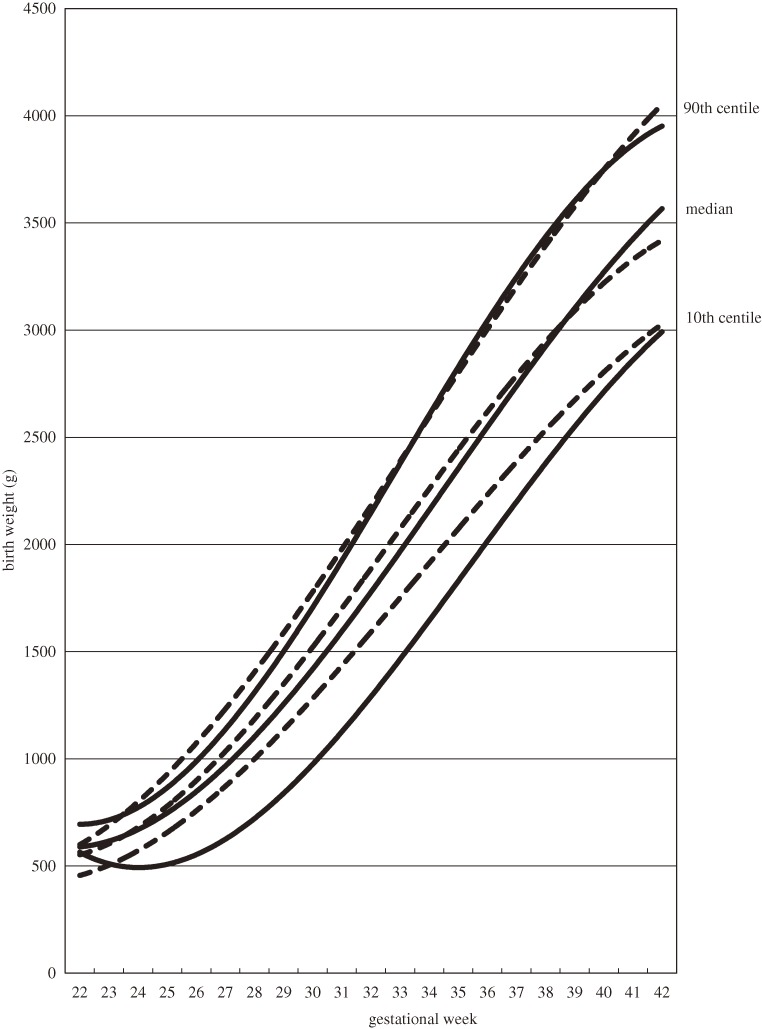
Figure 1 shows the birth weight distribution of singleton male infants by gestational age and birth order. The 10th centile curves of first live births and second and later live births were skewed to lower birth weights in the preterm period. When the birth weight distributions are classified by delivery mode, the 10th centile curves were skewed to lower birth weights among both first live births and second and later live births delivered by cesarean section (Table 2, Figures 2 and 3). Coefficients of determination of all fitted curves were higher than 0.98, and the skewness was similar in 10th centile curves of birth weight of female infants who were delivered by cesarean section (data not shown).
Figure 1. Distribution of birth weights of singleton males by gestational age and birth order, 2003–2005. Cubic curves were drawn using the least squares method. Solid lines show first live births; dotted lines show second and later live births.
Table 2. Tenth centile, median, and 90th centile of birth weights of singleton males by gestational week and birth order, 2003–2005.
| Gestational week | Vaginal delivery (g) | Cesarean deliverya (g) | ||||
| 10th centile | Median | 90th centile | 10th centile | Median | 90th centile | |
| First live births | ||||||
| 22 | 443 | 507 | 558 | — | — | — |
| 23 | 520 | 602 | 674 | 505 | 594 | 670 |
| 24 | 589 | 680 | 769 | 470 | 637 | 798 |
| 25 | 619 | 784 | 976 | 422 | 718 | 862 |
| 26 | 806 | 900 | 1026 | 544 | 864 | 1014 |
| 27 | 928 | 1060 | 1182 | 650 | 980 | 1158 |
| 28 | 1038 | 1156 | 1379 | 678 | 1056 | 1342 |
| 29 | 1093 | 1371 | 1542 | 689 | 1147 | 1430 |
| 30 | 1270 | 1510 | 1688 | 830 | 1325 | 1618 |
| 31 | 1408 | 1638 | 1864 | 941 | 1402 | 1794 |
| 32 | 1546 | 1774 | 2076 | 1118 | 1638 | 2000 |
| 33 | 1731 | 2000 | 2356 | 1260 | 1834 | 2236 |
| 34 | 1834 | 2190 | 2513 | 1406 | 2010 | 2444 |
| 35 | 1944 | 2338 | 2694 | 1558 | 2176 | 2664 |
| 36 | 2050 | 2508 | 2912 | 1760 | 2406 | 2930 |
| 37 | 2272 | 2714 | 3142 | 2200 | 2719 | 3170 |
| 38 | 2460 | 2876 | 3308 | 2374 | 2880 | 3360 |
| 39 | 2632 | 3025 | 3446 | 2500 | 3026 | 3618 |
| 40 | 2728 | 3142 | 3580 | 2663 | 3221 | 3770 |
| 41 | 2815 | 3234 | 3686 | 2796 | 3297 | 3848 |
| 42 | 2816 | 3297 | 3818 | 2858 | 3311 | 3863 |
| Second and later live births | ||||||
| 22 | 458 | 513 | 590 | 546 | 570 | 593 |
| 23 | 460 | 594 | 678 | 450 | 596 | 774 |
| 24 | 594 | 682 | 800 | 481 | 658 | 770 |
| 25 | 684 | 805 | 899 | 572 | 798 | 915 |
| 26 | 724 | 960 | 1120 | 648 | 856 | 1018 |
| 27 | 870 | 1050 | 1270 | 584 | 996 | 1179 |
| 28 | 1092 | 1226 | 1492 | 732 | 1134 | 1348 |
| 29 | 1142 | 1334 | 1510 | 936 | 1296 | 1536 |
| 30 | 1223 | 1513 | 1779 | 990 | 1384 | 1682 |
| 31 | 1487 | 1680 | 1916 | 1160 | 1580 | 1880 |
| 32 | 1569 | 1864 | 2200 | 1180 | 1727 | 2082 |
| 33 | 1732 | 2040 | 2388 | 1388 | 1865 | 2236 |
| 34 | 1910 | 2204 | 2524 | 1530 | 2162 | 2582 |
| 35 | 1985 | 2378 | 2750 | 1660 | 2318 | 2830 |
| 36 | 2170 | 2610 | 3054 | 2001 | 2580 | 3102 |
| 37 | 2405 | 2822 | 3270 | 2380 | 2820 | 3275 |
| 38 | 2595 | 3006 | 3442 | 2566 | 2982 | 3466 |
| 39 | 2734 | 3145 | 3584 | 2602 | 3120 | 3648 |
| 40 | 2850 | 3270 | 3742 | 2692 | 3265 | 3773 |
| 41 | 2940 | 3372 | 3830 | 2824 | 3366 | 3976 |
| 42 | 2950 | 3308 | 4080 | 2926 | 3567 | 3800 |
Figure 2. Distribution of birth weights of first live male births by gestational age and delivery mode, 2003–2005. Cubic curves were drawn using the least squares method. Solid lines show births by cesarean section; dotted lines show births by vaginal delivery.
Figure 3. Distribution of birth weights of second and later live male births by gestational age and delivery mode, 2003–2005. Cubic curves were drawn using the least squares method. Solid lines show births by cesarean section; dotted lines show births by vaginal delivery.
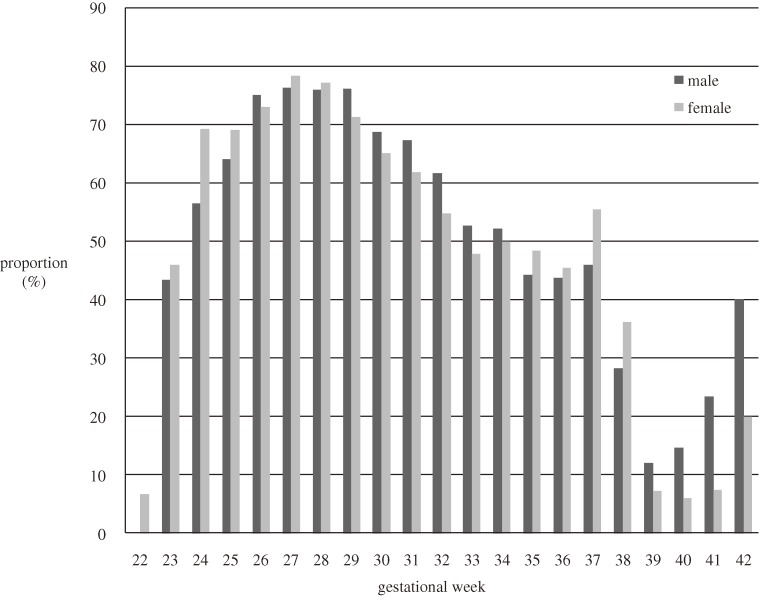
The proportion of first live births delivered by cesarean section by gestational age is shown in Figure 4. More than 40% of male and female births were delivered by cesarean section at 37 weeks or earlier. From 26 to 29 weeks, more than 70% of births were delivered by cesarean section.
Figure 4. Proportion of first live cesarean section births by gestational age, 2003–2005.
DISCUSSION
The 10th centile birth weight curves of Japanese singleton infants by gestational age were skewed toward low values during the preterm period. Cesarean section influenced this distribution because the proportion of births delivered by cesarean section was large during the preterm period, especially from 26 to 29 weeks. As curves for 24 to 26 gestational weeks appeared to be markedly skewed toward low values, there was a difference in gestational period between the area of the curves with the most skewness and that representing the largest proportion of cesarean sections. We were unable to determine the reason for this, as no country has included delivery mode in neonatal anthropometric charts.2–7 Due to this uncertainty, the research committee for creating new neonatal anthropometric charts in Japan decided to eliminate cesarean deliveries from the charts. The new Japanese neonatal anthropometric chart will thus include only the birth weight of singleton infants born by vaginal delivery as standard curves, which are created after excluding factors related to fetal growth. We used the least squares methods to calculate the distribution of birth weights in this study because it was also employed in the revised charts in 1995.2 The LMS (λ, μ, σ) method, however, will be used to create the new Japanese charts.8
More than 40% of preterm infants were delivered by cesarean section in Japan. The proportion of cesarean sections was reported to be increasing among preterm infants in the United States.9–11 The reasons for cesarean section are not available in the JSOG registration database; however, one known reason is fetal growth restriction (FGR), which is a decrease in the fetal growth rate that inhibits an infant from obtaining its complete genetic growth potential. FGR is caused by placental dysfunction or maternal complications such as pre-eclampsia.12,13 It is associated with increased perinatal mortality and morbidity, as well as with increased risk of long-term complications such as impaired neurodevelopment, adult type 2 diabetes, and hypertension.13 Ultrasonography techniques, including the non-stress test, biophysical profile scoring, and pulse Doppler methods, enable obstetricians to carefully evaluate fetal growth.14 Due to these methods of fetal management, especially observation of growth in fetal head circumference, obstetricians are more likely to deliver fetuses with FGR during preterm in the event of non-reassuring fetal status. Indeed, approximately 80% of fetuses with FGR were delivered by cesarean section in European countries.15 Cesarean section is also likely to be selected in cases of preterm premature rupture of membranes.16
Because the JSOG database mainly includes tertiary hospitals, low birth weight infants were overrepresented in our study population as compared with the general population. It has been reported that whereas 8.5% of male births and 10.8% of female births were less than 2500 grams in the general population, approximately 25% of births were less than 2500 grams in some tertiary hospitals.17–19 In addition, pregnant women with complications might be more likely to be admitted to, and undergo cesarean section in, tertiary hospitals. Due to this selection bias, 10th centile birth weights of cesarean section births may be less than those of the general population. The reliability of gestational age is the most important issue in creating neonatal anthropometric charts. We were unable to confirm whether gestational age was assessed by ultrasonography during first trimester among pregnant women registered in the JSOG system. Many Japanese clinics and hospitals that treat pregnant women have ultrasonography equipment. However, because estimation of gestational age by ultrasonography was not mentioned in Japanese guidelines for obstetrical practice, some facilities may have calculated gestational age by asking pregnant women about their last menstrual period.20
In conclusion, the 10th centile birth weight curves of Japanese singleton infants delivered by cesarean section by gestational age were skewed toward low values during the preterm period. This might reflect the fact that fetuses with FGR were more likely to be delivered by cesarean section to prevent worsening fetal growth. Thus, the birth weights of singleton infants born by vaginal delivery were used as standard curves to develop new Japanese neonatal anthropometric charts.
ACKNOWLEDGMENTS
This study was supported in part by grants from the Ministry of Health, Labour and Welfare in Japan. We thank JSOG for providing their registration data. We are also grateful to Drs. S. Kusuda, T. Kubo, H. Aoya, R. Mori, N. Shinozuka, and M. Kageyama.
Conflicts of interest: None declared.
REFERENCES
- 1.Bertino E , Milani S , Fabris C , De Curtis M. Neonatal anthropometric charts: what they are, what they are not . Arch Dis Child Fetal Neonatal Ed. 2007;92:F7–10 10.1136/adc.2006.096214 [DOI] [PMC free article] [PubMed] [Google Scholar]
- 2.Ogawa Y , Iwamura T , Kuriya N , Nishida H , Takeuchi H , Takada M , et al. Birth size standards by gestational age for Japanese neonates . Acta Neonatol Japonica. 1998;34:624–32(in Japanese) [Google Scholar]
- 3.Kramer MS , Platt RW , Wen SW , Joseph KS , Allen A , Abrahamowicz M , et al. A new and improved population-based Canadian reference for birth weight for gestational age . Pediatrics. 2001;108:e35 10.1542/peds.108.2.e35 [DOI] [PubMed] [Google Scholar]
- 4.Bonellie S , Chalmers J , Gray R , Greer I , Jarvis S , Williams C. Centile charts for birthweight for gestational age for Scottish singleton births . BMC Pregnancy Childbirth. 2008;8:5 10.1186/1471-2393-8-5 [DOI] [PMC free article] [PubMed] [Google Scholar]
- 5.Davidson S , Sokolover N , Erlich A , Litwin A , Linder N , Sirota L. New and improved Israeli reference of birth weight, birth length, and head circumference by gestational age: a hospital-based study . Isr Med Assoc J. 2008;10:130–4 [PubMed] [Google Scholar]
- 6.Niklasson A , Albertsson-Wikland K. Continuous growth reference from 24th week of gestation to 24 months by gender . BMC Pediatr. 2008;8:8 10.1186/1471-2431-8-8 [DOI] [PMC free article] [PubMed] [Google Scholar]
- 7.Visser GH , Eilers PH , Elferink-Stinkens PM , Merkus HM , Wit JM. New Dutch reference curves for birthweight by gestational age . Early Hum Dev. 2009;85:737–44 10.1016/j.earlhumdev.2009.09.008 [DOI] [PubMed] [Google Scholar]
- 8.Cole TJ , Green PJ. Smoothing reference centile curves: the LMS method and penalized likelihood . Stat Med. 1992;11:1305–19 10.1002/sim.4780111005 [DOI] [PubMed] [Google Scholar]
- 9.Ananth CV , Joseph KS , Oyelese Y , Demissie K , Vintzileos AM. Trends in preterm birth and perinatal mortality among singletons: United States, 1989 through 2000 . Obstet Gynecol. 2005;105:1084–91 10.1097/01.AOG.0000158124.96300.c7 [DOI] [PubMed] [Google Scholar]
- 10.Davidoff MJ , Dias T , Damus K , Russell R , Bettegowda VR , Dolan S , et al. Changes in the gestational age distribution among U.S. singleton births: impact on rates of late preterm birth, 1992 to 2002 . Semin Perinatol. 2006;30:8–15 10.1053/j.semperi.2006.01.009 [DOI] [PubMed] [Google Scholar]
- 11.Leveno KJ Rising cesarean delivery and preterm birth rates. Are they related? Obstet Gynecol. 2008;111:810–1 10.1097/AOG.0b013e31816bfe6d [DOI] [PubMed] [Google Scholar]
- 12.Odegård RA , Vatten LJ , Nilsen ST , Salvesen KA , Austgulen R. Preeclampsia and fetal growth . Obstet Gynecol. 2000;96:950–5 10.1016/S0029-7844(00)01040-1 [DOI] [PubMed] [Google Scholar]
- 13.Alberry M , Soothill P. Management of fetal growth restriction . Arch Dis Child Fetal Neonatal Ed. 2007;92:F62–7 10.1136/adc.2005.082297 [DOI] [PMC free article] [PubMed] [Google Scholar]
- 14.Tokuhisa T , Ibara S. Intrauterine growth restriction (IUGR) . Obstet Gynecol Prac. 2004;53:1283–92(in Japanese) [Google Scholar]
- 15.GRIT Study Group A randomized trial of timed delivery for the compromised preterm fetus: short term outcomes and Bayesian interpretation . BJOG. 2003;110:27–32 [DOI] [PubMed] [Google Scholar]
- 16.Fujimori K , Sato A. Timing and methods of termination in pregnancy . Obstet Gynecol Therapy. 2008;96:714–9(in Japanese) [Google Scholar]
- 17.Official Statistics of Japan Web site [Internet]. Vital statistics 2009; [cited 2010 November 18]. Available from: http://www.e-stat.go.jp
- 18.Division of Obstetrics. Annual report 2008. Tokyo: National Center for Child Health and Development (Japan), Division of Obstetrics; 2010 Mar (in Japanese).
- 19.Mitsuda N. Annual report 2008. Osaka: Osaka Medical Center and Research Institute for Maternal and Child Health (Japan), Division of Obstetrics; 2009. p. 31–7 (in Japanese).
- 20.Japan Society of Obstetrics and Gynecology. Guideline for obstetrical practice in Japan 2008. Tokyo: Japan Society of Obstetrics and Gynecology; 2008. p. 1–7 (in Japanese).


