Fig. 1.
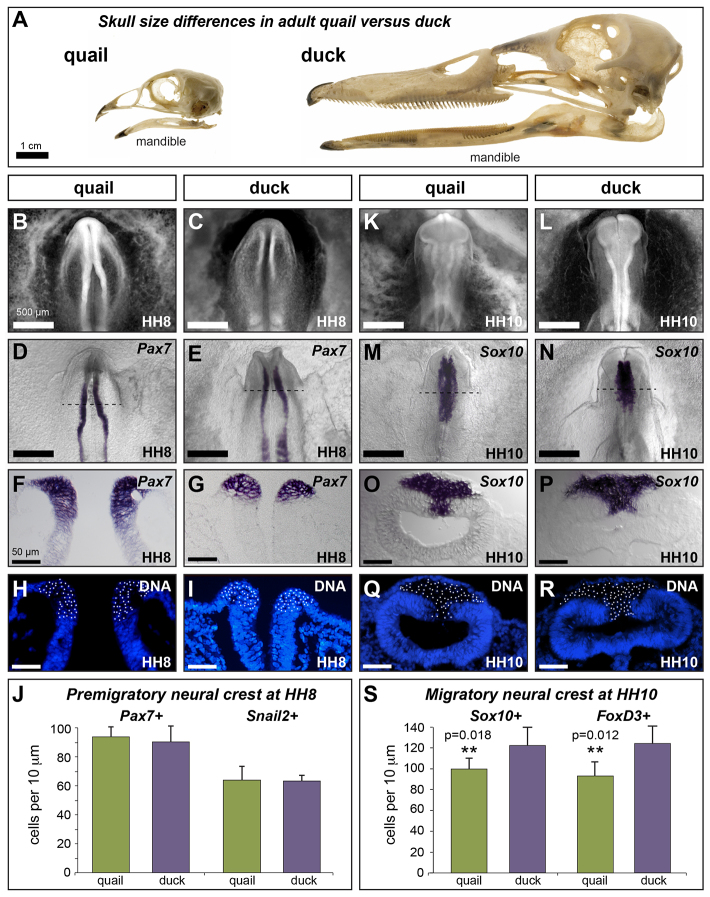
Species-specific differences emerge progressively during development. (A) Adult quail and duck skulls showing species-specific differences in jaw size, highlighted by the mandible. (B,C) Ethidium bromide staining of HH8 quail and duck embryos. (D-G) In situ hybridization (ISH) for Pax7 in HH8 quail (D,F) and duck (E,G) embryos. (H,I) Cross-sections of quail (H) and duck (I) Pax7 ISH embryos counter-stained to identify cell nuclei. (J) Quantification of Pax7-positive (quail: 93.8±6.9; duck: 90.3±11.1; P=0.34; n=4) and Snail2-positive (quail: 63.5±11.7; duck: 62.9±3.2; P=0.93; n=4) NC progenitors at HH8. (K,L) Ethidium bromide staining of HH10 quail and duck embryos. (M-P) ISH for Sox10 in HH10 (M,O) quail and (N,P) duck embryos. (Q,R) Cross-sections of quail (Q) and duck (R) Sox10 ISH embryos counter-stained to identify cell nuclei. (S) Quantification of Sox10-positive (quail: 96.4±4.1; duck: 121.1±9.5; **P=0.018; n=3) and FoxD3-positive (quail: 91.0±8.1; duck: 121.8±9.1; **P=0.012; n=3) delaminated NC progenitors in the midbrain at HH10. Scale bar measurement in B applies to B-N and that in F applies to F-R. Error bars represent s.d.

