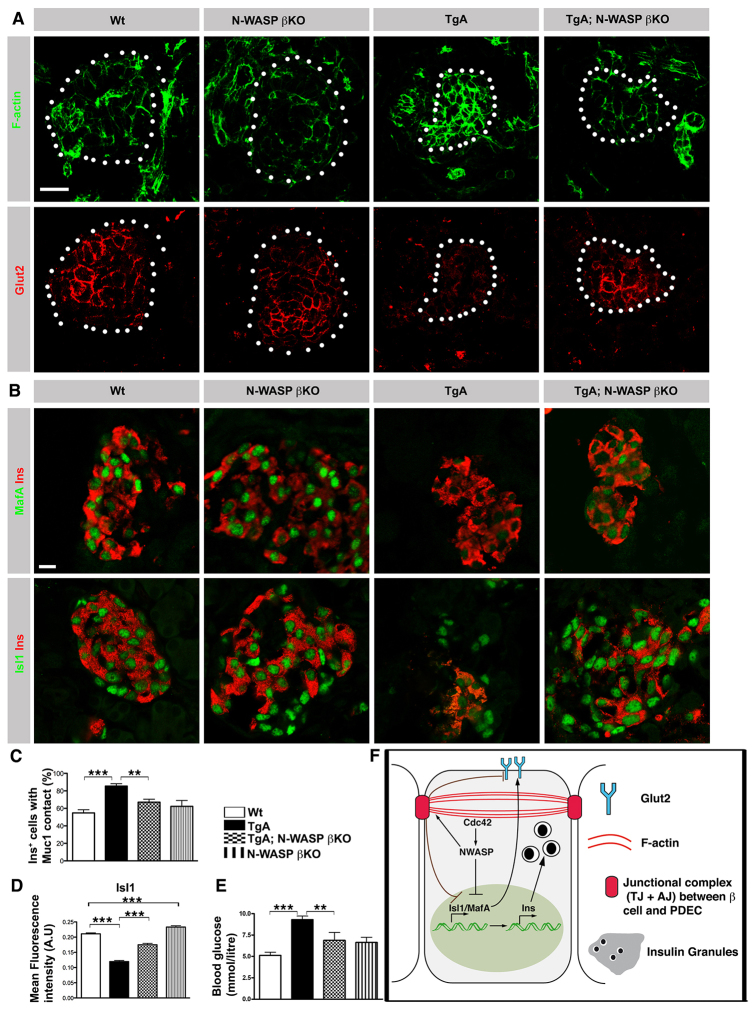
Fig. 8.
Ablation of N-WASP partially restores caCdc42-induced inhibition of β cell delamination and differentiation. (A) Sections of P4 Wt, N-WASP βKO, TgA and TgA;N-WASP βKO pancreata were immunostained with antibodies against F-actin (green) and Glut2 (red). Islets are marked with dotted circles and were identified using Ins staining (supplementary material Fig. S7D). Wt and N-WASP βKO Ins+ cells show similar expression levels/subcellular distributions of F-actin and Glut2. TgA Ins+ cells show increased F-actin and reduced Glut2. F-actin and Glut2 expression levels/distribution of Ins+ cells is partially restored in TgA;N-WASP βKO. (B) Sections from P4 Wt, N-WASP βKO, TgA and TgA;N-WASP βKO pancreata were immunostained with antibodies against MafA (green, upper panels), Isl1 (green, lower panels) and Ins (red). Isl1 expression is restored to Wt levels in TgA;N-WASP βKO Ins+ cells in comparison with TgA Ins+ cells, whereas MafA expression is partially restored. (C) Quantification of the Ins+ cell number facing the lumen (in contact with Muc1) in serial sections of P4 Wt, TgA, TgA; N-WASP β KO and N-WASP β KO pancreata. Only individual or doublet Ins+ cells were counted as the majority of the Ins+ cells had delaminated and clustered into islet-like structures. The data are expressed as the percentage of all single and doublet Ins+ cells (excluding Ins+ in clusters) that are in contact with Muc1; 54% Wt (n=4), 85% TgA (n=7), 67% TgA;N-WASP βKO (n=8) and 62% N-WASP βKO (n=3). Wt versus TgA, ***P=0.0001, TgA versus TgA;N-WASP βKO, **P=0.0014. (D) Mean fluorescence intensity quantification of the Isl1 and Ins double immunostaining shown in B. Isl1 expression in Ins+ cells was reduced in TgA compared with Wt and was restored in TgA;N-WASP βKO. n represents number of Ins+ cells (pooled): at least 500 Ins+ were counted for each genotype, ***P<0.0001. (E) Random blood glucose measurements at P4. The elevated blood glucose levels observed in TgA mice was partially restored in TgA;N-WASP βKO mice (Wt and TgA, n=15; N-WASP βKO, n=4; TgA;N-WASP βKO, n=5; Wt versus TgA, ***P=0.0001; TgA versus TgA;N-WASP βKO, **P=0.0150). (F) Schematic of how caCdc42 cell-autonomously affects β cell differentiation/maturation and function. Cdc42 regulates expression of key β cell transcription factors, including Isl1 and MafA, and their targets (e.g. insulin) and Glut2 via N-WASP. The images are maximum intensity projections covering 10 μm. Error bars represent s.e.m. Scale bars: 20 μm.

