

Abstract
Budding viruses face a trade-off: virions need to efficiently attach to and enter uninfected cells while newly generated virions need to efficiently detach from infected cells. The right balance between attachment and detachment—the right amount of stickiness—is needed for maximum fitness. Here, we design and analyse a mathematical model to study in detail the impact of attachment and detachment rates on virus fitness. We apply our model to influenza, where stickiness is determined by a balance of the haemagglutinin (HA) and neuraminidase (NA) proteins. We investigate how drugs, the adaptive immune response and vaccines impact influenza stickiness and fitness. Our model suggests that the location in the ‘stickiness landscape’ of the virus determines how well interventions such as drugs or vaccines are expected to work. We discuss why hypothetical NA enhancer drugs might occasionally perform better than the currently available NA inhibitors in reducing virus fitness. We show that an increased antibody or T-cell-mediated immune response leads to maximum fitness at higher stickiness. We further show that antibody-based vaccines targeting mainly HA or NA, which leads to a shift in stickiness, might reduce virus fitness above what can be achieved by the direct immunological action of the vaccine. Overall, our findings provide potentially useful conceptual insights for future vaccine and drug development and can be applied to other budding viruses beyond influenza.
Keywords: influenza, within-host model, vaccines, drug treatment
1. Introduction
An important part of the infection cycle of every virus is the transition of virions from the infected cell that generated them to new uninfected cells. For budding viruses, a newly generated virion needs to be able to efficiently detach from the infected cell and attach to a new (uninfected) cell. The detachment step is optimized if the virion does not stick to the target cell membrane while the attachment step is most efficient if the virion sticks strongly to the target cell. This suggests that the virus needs to achieve some optimal level of ‘stickiness’ for maximum fitness. In this paper, we use a mathematical model to explore this stickiness balance between attachment and detachment and how it affects virus fitness. We focus on influenza, though the general findings probably apply to other budding viruses as well.
The interaction of the influenza virus with the host cell membrane is mediated by two key players: the haemagglutinin (HA) and the neuraminidase (NA) proteins. The HA protein is responsible for attachment of the influenza virus to sialic acid receptors on the membrane of the epithelial target cells. The NA protein, which cleaves sialic acid, helps virions detach from cells or from other virions. A number of experimental studies have shown that a balance between the ability of the HA to bind and the NA to cleave is needed to maximize virus production (e.g. [1–10] and the review in [11]).
Further evidence for the importance of a balance between HA and NA comes from NA-inhibitor drugs. These drugs bind to the NA protein and thereby suppress the ability of newly generated virions to detach from infected cells [12,13]. Influenza viruses can counteract the effect of NA inhibitors either by mutating the NA and thereby directly evading the drug, or by mutating the HA such that the binding strength is reduced, therefore reducing the need for a well-functioning NA [14–17]. Similarly, passaging of influenza in the presence of antibodies targeting the HA was shown to not only lead to the emergence of strains with mutations in HA, but also to additional mutations in NA [18], possibly to restore the stickiness balance. On the population level, relatively rapid evolution of both HA and NA occurs, though the interpretation of these evolutionary patterns is not straightforward [19–21]. While the evidence that a balance between HA and NA affects fitness is strong, experiments are usually only able to investigate a few HA and NA combinations at a time. In addition, HA and NA balance (i.e. stickiness) and virus fitness are rarely quantified in a systematic way that would allow one to draw conclusions towards the ability of the virus to sustain itself in a population, i.e. its transmission fitness.
For systematic and quantitative investigations of complicated processes such as influenza infection dynamics, mathematical and computational modelling approaches have been shown to be valuable tools. Several models have previously been devised to study the overall infection process for influenza infections [22,23]. Similarly, models describing the process of attachment and detachment of virus to cells have also been previously developed [24–30]. Here, we develop and analyse a new mathematical model that combines these two aspects and describes the dynamics of a viral infection taking explicitly into account virus attachment and detachment processes.
Our model allows us to study the impact of varying virus stickiness (i.e. different levels of HA and NA activity that correspond to different attachment and detachment rates) on transmission fitness. We obtain a fitness landscape for virus transmission fitness as a function of attachment and detachment rates. We use this framework to explore the impact of antivirals, vaccines and the immune response on the optimal level of stickiness and fitness of the virus. We find that hypothetical NA enhancer drugs might occasionally perform better than the currently available NA inhibitors in reducing virus fitness; that vaccines targeting HA or NA might reduce fitness not only because of increased immune response strength but also because of shifting virus stickiness; and that both an increased B cell/antibody or T-cell-mediated immune response lead to maximum fitness at higher stickiness. Finally, we show how changes in other virus and host phenotypes affect fitness and the optimal level of stickiness at which fitness is maximized.
2. Material and methods
2.1. Mathematical model of infection dynamics
Our model is shown schematically in figure 1 and table 1 summarizes model parameters and variables. The equations for the model are given in appendix A. A description of the model is as follows.
Figure 1.

Schematic of the model. The quantities being tracked are virus V, uninfected and infected cells with n virions bound to the surface, Un and In, and an immune response X, all expressed in particles per millilitre. Free virions (black) attach to uninfected cells at rate  or infected cells at rate
  The attachment is reversible, and detachment can occur at rates
  and
and  (the extra factors of n or n+1 in the flow rates account for multiple bound virions). Bound virions (white) are internalized into uninfected or infected cells at rates gu and gi. If an internalized virion (grey) enters an already infected cell, it does not alter the state of the infected cell. A fraction f of virions internalized into uninfected cells turn those cells into productively infected cells. Infected cells produce progeny virions at rate p, which are initially bound to the infected cell membrane (not drawn in the figure). The virions bound to infected cells can detach from the infected cells at rate
  to become free virions. Infected cells die and virions are cleared at fixed rates d and c, respectively. Also modelled is an adaptive immune response, which we consider a simplified representation of either a B cell/antibody or CD8+ CTL response. The immune response is described by a simple exponential growth term at rate r, corresponding to clonal expansion of T cells/B cells. The immune response is assumed to either clear free virions at a rate w1 (antibody/B-cell response) or kill infected cells at rate w2 (CTL response).
Table 1.
Model parameters and initial conditions. Unless otherwise stated, the parameter values shown in this table are used for all simulations shown in the results section. For some scenarios, we vary parameters to investigate how results are affected. The density of uninfected cells was estimated by assuming a locally densely packed collection of cells, with each cell having a volume of about 20 μm3 [31–33].
| symbol | meaning | value | comment/source |
|---|---|---|---|
| U0(t = 0) | uninfected target cells with no virions bound | 1.25×10⁸ per ml | see caption |
| Un(t = 0) | uninfected target cells with n virions bound | 0 | |
| In(t = 0) | infected target cells with n virions bound | 0 | |
| V(t = 0) | inoculum dose (infectious virions) | 100 per ml | arbitrary choice |
| X(t = 0) | immune response | 1 | see text |
| p | production rate of cell-bound infectious virions | 100 per day | [33–36] |
| d | death rate of infected cells | 2 per day | 12 h lifespan [22,37,38] |
| c | virion clearance rate | 6 per day | 4 h lifespan [22,31,35,39,40] |
| r | rate of clonal expansion of the immune response | 1 per day | [41–45] |
| gu | rate at which virions are internalized and lead to production of progeny virus | 4 per day | 6 h eclipse phase [22,34,35,46,47] |
| gi | rate at which virions are internalized into infected cells | varied | see text |
| f | probability that an internalized virus causes infection | varied | see text |
 |
rate for virion attachment to uninfected/infected cells | varied | see text |
 |
rate of virion detachment from uninfected/infected cells | varied | see text |
| w1/w2 | rate of virus or infected cell clearance by antibodies or CTLs | varied | see text |
The quantities being tracked in the model are infectious virus, uninfected and infected cells and a component of the adaptive immune response (either B cells/antibodies or cytotoxic T lymphocytes (CTLs)). Free virions, V, bind to uninfected cells, Un, at the mass–action attachment rate  Note that
  is not a pure rate but has—in addition to units of inverse time—units of volume in the numerator. This is needed since we model virus and cells as concentrations and need to cancel the volume units in the model. Keeping this in mind, we will nevertheless for simplicity in the following refer to
  as attachment rate. The subscript for the uninfected cells, Un, identifies the number of virions that are bound to the cell. Attachment is reversible, and detachment can occur at the detachment rate
  (this is a true rate with units of inverse time). Bound virions can enter cells, internalization is assumed to occur for a single virion at a time [48]. While acknowledging that the virion dynamics within a cell entails multiple steps encompassing internalization, uncoating, transfer to the nucleus, and production and assembly of progeny virions (previously modelled in [49–51]), we do not include these within-cell details in our model. Instead, we choose a value for the internalization rate, gu, such that it encompasses the whole eclipse phase, namely to include both the process of virus entry into a cell and the transport to the cell nucleus and turning a cell into an infected, virus-producing cell [52]. If a virion enters an uninfected cell, a certain fraction, f, of those uninfected cells will be turned into an infected, virus-producing cell. Infected cells are labelled as In where n again indicates the number of virions bound to the surface of the cell. Infected cells produce progeny virions at rate p, which are initially bound to the infected cell membrane. The bound virions can detach from the infected cells at rate
  to become free virions. Free virions can go on to attach to uninfected cells, as just described. Additionally, they can (re)-attach to infected cells at rate
  , and can be internalized by those cells at rate gi. If a virion is internalized by an already infected cell, it does not alter the state of the infected cell.
We also model an adaptive immune response, which we consider a simplified representation of a B cell/antibody or CD8+ CTL response. We use a simple exponential growth model for the immune response, which corresponds to clonal expansion. The rate r describes the rate of clonal expansion and is chosen in line with experimental data (table 1). An alternative immune response model that includes activation of the adaptive response by antigen is presented in the electronic supplementary material. The effect of the immune response is modelled as either clearance of free virions at a rate w1 (antibody/B-cell response) or killing of infected cells at rate w2 (CTL response). By adjusting the rates w1 and w2, we can simulate antibody/B cell or CTL responses of varying strength. While this is obviously a very simplified way of expressing the complicated dynamics of antibody/B-cell and T-cell activation and effector dynamics, and more detailed models could be used [53], this simple representation of the B-cell and T-cell response suffices for our purpose of studying the impact of either antibody/B cell or CTL responses on fitness and optimal stickiness. The immune response is expressed in arbitrary units and we set its starting value to X(0) = 1. Note that we model only the immune response dynamics during the expansion phase. This is justified since the peak and subsequent decline of the adaptive response usually occurs several days after virus has been cleared, and in the following we are interested only in the infection dynamics up to the time of virus clearance.
2.2. Defining viral fitness
We want to know how virus fitness depends on stickiness, i.e. the balance of binding and release activity of the virus. We therefore need to quantify fitness. We consider a virus to be more fit if it is better able to transmit infection between hosts. For an infection such as influenza, free virions contained in droplets or deposited on fomites are the main route of transmission. It is therefore plausible and consistent with experimental evidence to assume that—all else equal—transmission, and with it fitness, is proportional to the area under the virus titre curve [32,54–60] (but see [61] for a counter-example). This leads to an expression for a measure of fitness given by
| 2.1 |
where D is the duration of the infectious period. We define the infectious period in all our simulations as the time between onset of infection and drop of virus below one virion. The additional rescaling by the logarithm makes presentation easier, and also makes sense from a biological point of view since the probability of causing infection in a new host often scales with the logarithm of the dose [62]. This rescaling does not affect the results and conclusions. In a recent study, we found some evidence that the amount of virus shedding can be described by a Hill function of the logarithm of the virus load [32]. If we use such a relation and multiply total shedding by virus concentration, we arrive at a slightly different expression for fitness [32,63]. Results with such a more complicated expression for fitness, and another expression integrating over the log of the virus load, are mostly similar, though some differences exist. We provide results for such alternative fitness definitions and some additional discussion in the electronic supplementary material.
2.3. Model implementation
The model is implemented in the R programming language [64]. The maximum number of bound virions we track (i.e. the number of compartments for uninfected and infected cells) is capped at some upper value, N. Ideally, we would choose N to be the maximum number of virions bound to a cell. However, this quantity is not well known, and probably is in the thousands, which would mean a set of differential equations with several thousand compartments, which would be computationally prohibitive to analyse. We therefore instead choose a value for N (usually more than 100) that was large enough to ensure that this artificial limitation of compartments had no effect on the results. We did so by tracking the number of cells in the last compartments (i.e. UN and IN − 1) and ensured that these values always stayed below 1. The computer code is available from the authors upon request.
3. Results
The main question throughout this paper is how virus fitness (as defined by equation (2.1)) is affected by the ability of the virus to bind to and be released from cells, i.e. how fitness is affected by the attachment and detachment rates, k+ and k−. For most of the results we present, we assume that attachment and detachment rates are the same for uninfected and infected cells, i.e.  (We show some results where the attachment and detachment rates are different for uninfected and infected cells below.) We define virus stickiness as the ratio of the attachment to detachment rate, i.e. S = k+/k−.
3.1. Balance between binding and release in the absence of an immune response
We begin by analysing how attachment and detachment rates, k+ and k−, and stickiness, the ratio S = k+/k−, affect fitness in the absence of an immune response (w1 = w2 = 0). This corresponds to an in vitro setting, for which we are able to perform some direct comparison between our results and existing data (see §3.2). Figure 2 shows fitness as a function of k+ and k−. The dark (blue) regions are low-fitness areas in which the virus is not able to establish an infection, i.e. the initial virus inoculum rapidly disappears without ever increasing (corresponding to R0 < 1 [65,66]). The brighter (red) areas are those in which a strong infection occurs and total virus load is high. High fitness is only achieved in a fairly confined region of k+ and k− values. Further, for a given value of one of the rates, the other rate has a range of ‘matching’ values for which high fitness is achieved. As k− is changed, the dotted black curve indicates the maximum fitness ridge for different combinations of k+ and k−. For the maximum level of fitness at a given value of k−, one finds that virus stickiness, S, varies within a relatively small range of two orders of magnitude, as can be seen in the inset figure. This inset shows a slice through the fitness surface along the high-fitness ridge (black dotted curve). For changing k− values, the plot shows maximum fitness and the level of stickiness that leads to maximum fitness. The figure confirms the experimentally known fact that if a virus is too sticky (S is too large), newly created virions cannot leave the cell that produced them or immediately attach to neighbouring uninfected or infected cells. This results in little free virus at any given time, and therefore low fitness (dramatically demonstrated by the NA-inhibitor drugs). Additionally, many virions are ‘lost’ because they enter already infected cells. Similarly, if S is too low, it means that virions are not very good at attaching and entering target cells, which leads to fewer infected cells and therefore reduced virus production, again reducing overall fitness. Fitness is high in a range of S values for which the balance between attachment and detachment is ‘just right’. While the fitness landscape can change depending on the exact values of the parameters chosen for the model, one finds that as long as choices are within biologically reasonable ranges, the overall shape changes little. The electronic supplementary material shows a few fitness landscape figures for different parameter values; the overall shape is retained.
Figure 2.
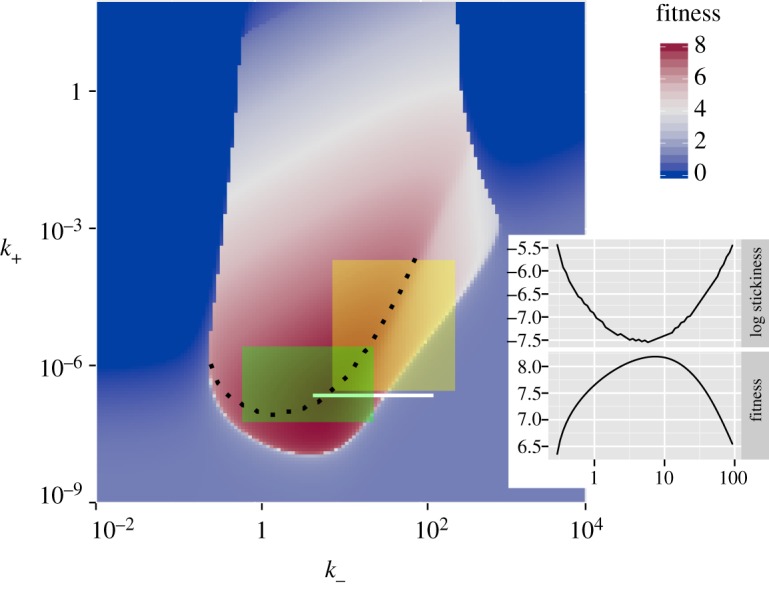
Virus fitness (equation (2.1)) as a function of the attachment and detachment rates k− and k+ (with k− in units of inverse days and k+ in units of millilitre over days). The three rectangles indicate ranges reported in three different experimental studies (see text). The inset shows a slice along the dotted high-fitness ridge line: for varying levels of k−, the level of stickiness (S = k+/k−) that optimizes fitness, and the level of fitness are plotted. In this scenario, no immune response is present (w1 = w2 = 0), we assumed all virions are infectious (f = 1) and attachment, detachment and internalization rates are the same for uninfected and infected cells  Other parameter values are as given in table 1. For plotting purposes, any values with fitness, F, below 0 were set to zero. (Online version in colour.)
3.2. Comparison of the model with experimental data
A number of, mainly in vitro, studies have looked at influenza virus binding and release properties, and usually report findings such as we find with our model, namely that a balance between binding and release, an intermediate value of stickiness, leads to high virus load (see [11] for a review of some of the work). Unfortunately, these experimental results are rarely reported in a form that would allow direct comparison with our model. We were able to find a few studies that allow some form of comparison.
Xu et al. recently reported the HA binding avidity and NA enzymatic activity for several influenza strains (fig. 6 in [10]). They found that virus strains that transmitted well were found along a straight diagonal line on a log–log plot of HA binding and NA activity strength. The right half of the high-fitness ridge as shown in figure 2 follows approximately such a diagonal straight line on a log–log plot of attachment and detachment rates. Unfortunately, the experimental units in that paper do not lend themselves easily to a more direct comparison with our study.
Figure 6.
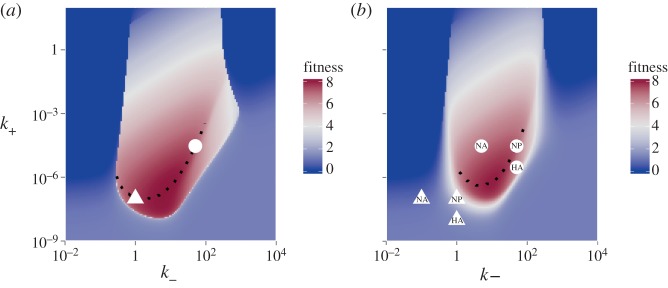
Illustration of the effect of potential vaccines targeting different influenza genes. (a) The fitness landscape in the absence of the immune response, re-plotted from figure 2. Two points with high fitness are marked (white triangle and circle). (b) The fitness landscape in the presence of a non-sterilizing antibody-based vaccine (modelled as w1 = 0.1). Overall fitness is reduced, the amount of reduction depending on the original location in the high-fitness region. In addition, a vaccine that targets HA will shift k+ to lower values, and a vaccine that mainly targets NA will shift k− to lower values. Possible HA or NA vaccines that reduce k+ or k− 10-fold are marked in the figure for two different initial locations of the virus. This can lead to additional loss of fitness, again depending on the location of the original strain on the fitness landscape. A vaccine that targets other genes, such as NP or M2, is not expected to shift stickiness. (Online version in colour.)
A few other studies do provide quantitative measurements of attachment and release rates that allow a more direct comparison with our model. Nunes-Correia et al. [29] reported attachment and detachment rates for the H1N1 PR8 strain of influenza A in MDCK cells at 4°C and 20°C for both high-affinity and low-affinity binding sites. The reported values for the attachment rates, k+, for different temperatures and affinity sites ranged between 2.9 × 10⁻⁷ and 2.1 × 10⁻⁴ ml d–1. (To obtain values for k+, we used Ci in eqns (3) and (4) of their paper, obtained by multiplying different values for ci with Ni as reported in their table 2 and converted from their units (M−1 s−1) to units of our model system (ml d−1).) Detachment rates, k− (their Di) were reported in the range of 8.6–259.2 per day. The yellow rectangle in figure 2 indicates this range of values (transparent rectangle with dashed frame in the greyscale version).
Critchley & Dimmock [67] studied influenza A/PR/8/34 virus binding to neomembranes of bovine brain lipid (which contain sialoglycolipids) at a range of temperatures from 10 to 35°C. Using their per-receptor attachment rate, combined with the approximate 1000 binding sites per cell reported by Nunes-Correia et al. [29] leads to virus–cell attachment rates in the range of 2.1–2.5×10⁻⁷ ml d–1 and detachment rates (k−) in the range of 5–142 per day. The narrow white rectangle in figure 2 indicates this range of values.
Hidari et al. [68] studied binding of a human influenza A/Aichi/2/68 (H3N2) and duck influenza A/Duck/Hongkong/313/4/78 (H5N3) to gangliosides with either α2–3- or α2–6-linked sialic acid residues. Again, using their per-receptor attachment rates and converting them to our system leads to virus–cell attachment rates for the different virus–substrate combinations in the range of 0.6–27 × 10−7 ml d–1 and detachment rates in the range of 0.7–27 per day. The green rectangle in figure 2 indicates this range of values (grey, semi-transparent rectangle with solid frame in the greyscale version).
Finally, Wagner et al. [69] found that for a virus with a strong HA and a somewhat strong NA, reducing NA activity approximately sixfold while retaining HA activity led to a decline in virus load (see figs 4 and 6 in [69]). We focus on the data for the G1,2 strain reported in [69] as the other strains lead to culture saturation effects in the growth experiments and we therefore consider the data for those other strains less reliable. Virus in the experiment was measured in HA units, while our model uses infectious virions as the base unit. We accounted for this by normalizing both the data and model virus load to have a maximum of 1. As it is impossible to know exactly what values of k+ and k− in our model correspond to those for the experimental set-up, we tried different values. We constrained the values we tried to those that are roughly in the range of the experimental studies just described. Additionally, we assumed that the sixfold reduction in NA activity as measured by the experimental assay [69] corresponds to a sixfold reduced value of k− in our model. Figure 3 shows that it is possible to get relatively decent agreement between model and experiment.
Figure 3.
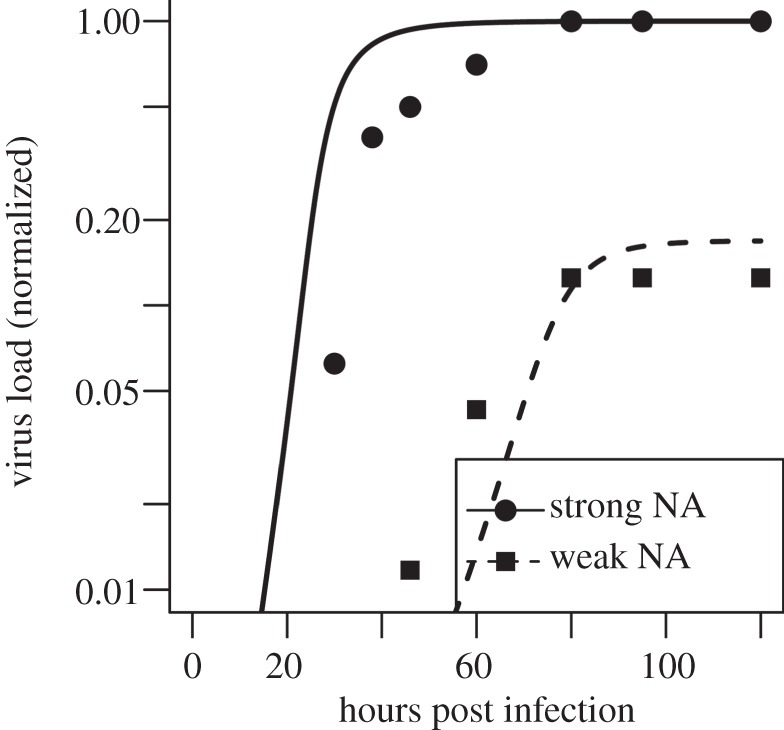
Comparison of model results (lines) with experimental data (symbols) from an in vitro experiment [69]. The solid line and circles show virus production for a virus with a relatively high NA activity, the dashed line and squares show virus levels for a virus strain that has around a sixfold reduction in NA activity [69], which we equate to a sixfold reduction of the detachment rate k−. Since the experiment and the model express virus in different units, and the number of uninfected cells in the experiment is not known, we normalized the data such that the maximum virus titre for both experiment and model is 1. We start the simulation with no free virus and I(0) = U(0)/1000, in accordance with the experimental set-up. The values for k− were set to 6 and 1 for the strong and weak NA virus, respectively, and the value for k+ was set to 10−6. Those values are in the range of values obtained from the in vitro experiments as discussed in the text. Viral clearance rate was set to 0 to match the fact that HA does not decay significantly over the duration of the experiment. Remaining values for the parameters are as described for figure 2.
Overall, comparison with experimental data shows that our model can reproduce results found in experimental studies in at least a semi-quantitative way. Specifically, our model predicts high fitness for the virus in ranges for the attachment and detachment rates that agree within orders of magnitude with reported experimental data for these quantities.
3.3. The effects of anti-influenza drugs on stickiness and fitness
The shape of the fitness surface as a function of k+ and k− suggests some interesting implications for the effectiveness of anti-influenza drugs. One prominent class of anti-influenza drugs, the NA inhibitors (zanamivir, peramivir and oseltamivir), bind to the NA protein, thereby preventing its functioning. This prevents virions detaching from infected cells, i.e. it reduces k−. If such a reduction in k− is strong enough, virus fitness can be significantly reduced (solid black arrow in figure 4). If fitness reduction is large enough, virus might not be able to replicate anymore and is unlikely to evolve resistance. However, it seems that while NA inhibitors do reduce virus fitness, there is residual fitness and ongoing virus replication (dashed black arrow). In this case, the virus can evolve resistance. This can be achieved by mutating the NA protein such that the drug does not bind well anymore [70–72]. This leads to an effective restoration of NA function and therefore increase in k−, possibly back to the previous level. Another set of mutants that was found had mutations not in the NA but in the HA. These mutations presumably reduced the strength of binding (lower k+), thereby reducing the need for strong NA activity [14,17] and restoring most of the original fitness (dotted black arrow) [73].
Figure 4.
Illustration of the effect of anti-influenza drugs. The fitness landscape is replotted from figure 2, with arrows added to explain the functioning of different anti-influenza drugs. NA inhibitors reduce k−, illustrated by the solid (strong reduction) and dashed (weak reduction) black arrows. Influenza can evolve resistance and regain fitness by mutating the NA protein, such that the drug does not bind well anymore. This leads to an effective restoration of NA function and increase in k−. Another way to restore fitness is by mutating HA to reduce its binding activity (dotted black arrow). The solid and dashed white arrows illustrate hypothetical drugs that increase NA or decrease HA activity (see the text for explanation). (Online version in colour.)
Depending on where the virus is located on the stickiness–fitness landscape, the NA inhibitors might not be operating in the optimal direction with regard to stickiness. For a virus located on the right part of the high-fitness region, a large reduction in k− is needed to lower fitness significantly (solid black arrow). In contrast, a smaller increase in k− is needed to push the virus towards very low-fitness levels (solid white arrow). This suggests that a hypothetical drug that would increase NA activity and thereby k−, i.e. a ‘NA-enhancer drug’, could have a much more dramatic effect on virus fitness. Alternatively, a hypothetical drug that works as HA inhibitor [74] and reduces k+ could have a similarly strong effect (dashed white arrow) and push the virus off the high-fitness region. Such HA inhibitors are one of the main functions of a successful antibody-based immune response and effective influenza vaccines, which we will discuss in the following sections. Potentially, the best drug would be one that both enhances NA activity and decreases HA activity. This would not allow the virus to restore fitness through mutations in either NA or HA alone, multiple mutations would probably be required for the virus to restore fitness, making drug resistance less probable. Another class of anti-influenza drugs, the M2 inhibitors, do not directly affect k+ or k−. However, they do impact other parameters of our model (namely fraction of infectious virions, f), which in turn impacts optimal stickiness. We investigate this further below.
3.4. The effects of an immune response on stickiness and fitness
The two main effector arms of the adaptive immune response, humoral (B cell/antibody, Ab) or cellular (CTLs), play a major role in the clearance of influenza and many other pathogens. They are also the basis of any effective vaccine. In this section, we explore how either one of these immune responses affects virus fitness and the optimal level of stickiness. To do so, we increase either w1 (clearance rate of virus by antibodies) or w2 (killing rate of infected cells by CTL) in our model and find the optimal level of fitness and the stickiness level, S, at which fitness is maximized. Figure 5a,c shows the expected: namely an increasing immune response leads to a reduction in fitness and a larger fraction of cells or viruses are removed by CTL or Ab.
Figure 5.
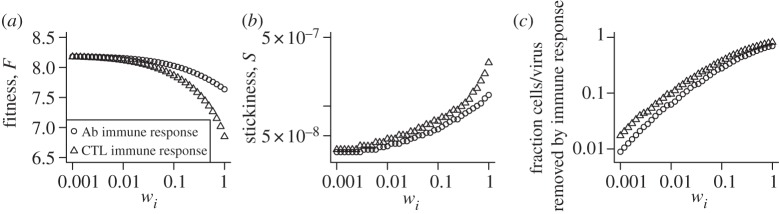
The impact of B cell/antibody (Ab) or CTL immune responses on fitness and stickiness. Immune response strength is increased by increasing virus clearance, w1, for the Ab response and increasing infected cell killing, w2, for the CTL response. (a) Maximum fitness as a function of immune response strength. (b) Stickiness as a function of immune response strength. (c) Total fraction of cells or viruses killed/removed by the immune response during the infection. For every value of immune response strength, wi, we scanned across the k− and k+ parameter space to determine the maximum fitness and the level of stickiness at which this maximum fitness is achieved. Parameter values are as described for figure 2.
As for stickiness, it increases with an increase in either Ab or CTL response. The increase in stickiness for the antibody-based immune response can be understood as follows: increased antibody levels lead to a higher clearance rate of free virions, which means it becomes more advantageous for the virus to spend less time outside of cells and more time attached to or inside of cells, hence the increased stickiness. The increase in stickiness in the presence of antibodies has been observed before in experimental studies. Hensley et al. [75] showed that in the presence of a strong immune response, influenza evolved changes in HA that increase virus binding to cell surface receptors (i.e. increase stickiness). A similar phenomenon was observed for some mutations in the pandemic 2009 strain [76] and its impact on the evolution of influenza was studied in [77].
For the CTL response, the increase in stickiness can be explained by the increased killing of infected cells, which in turn means that less virus gets lost being internalized by infected cells and relatively more virus attaches to uninfected cells only, turning them into infected cells. This again leads to improved fitness for an increased level of stickiness. As far as we are aware, our prediction that an increased CTL response will also increase stickiness has not been made before.
We also investigated the full fitness landscape as a function of k+ and k− in the presence of the immune response. The overall result resembles that for the scenario without an immune response, with reduced fitness and a narrowing of high fitness. Figures for fitness landscapes in the presence of medium or strong CTL or Ab immune response are shown in the electronic supplementary material. We also show in the electronic supplementary material the viral load dynamics for the model with an immune response and compare it with data from influenza infections in humans to show that the model can reproduce viral titre kinetics observed in vivo. Finally, we also considered an alternative immune response model that includes activation of the adaptive response by antigen. This model is described in the electronic supplementary material, which leads to very similar results.
3.5. The effects of vaccination on stickiness and fitness
Current influenza A vaccines are based mainly on antibody responses targeting the HA and to some lesser extent the NA protein [78,79]. An optimal vaccine leads to sterilizing immunity, i.e. the pre-existing immune memory is so strong that the infection is unable to establish. If this is not the case, vaccines can still often be useful by lowering the impact of the infection, through reduction of virus load, morbidity or mortality. In addition to their direct immunological impact, vaccines that mainly target HA (as most influenza vaccines currently do) or NA will lead to a shift in stickiness. As figure 6 illustrates, such a shift in stickiness could lead to further loss of fitness. This depends on the exact location in fitness space at which the virus is located. Around the bottom of the high-fitness area, where the maximum fitness ridge is located, a reduction in HA strength (i.e. k+ in our model) would probably lead to a strong loss of fitness due to unbalanced stickiness, in addition to the fitness loss due to increased immune strength. For NA vaccines (which reduce k− in our model), locations on the left part of the high-fitness area will also probably lead to a large reduction in fitness. If instead the virus is located in the high-fitness region towards the right, the reduction in NA strength has a smaller impact on fitness. Lastly, new vaccines that target genes other than HA or NA, such as the M2 or NP proteins, are in development [79–82] and it has been proposed that such vaccines, if they are able to prevent vaccine escape by influenza, might have an important impact on influenza control [83]. Such vaccines would not be expected to affect k+ or k− and impact virus fitness only through increased immune response strength.
3.6. The effects of neuraminidase expression by infected cells on stickiness and fitness
A recent study provided evidence that once cells are infected, the production and transport of NA to the outside of the infected cell prevents further virions from attaching [84]. This might prevent superinfections of cells, which has been postulated to reduce virus fitness. A similar phenomenon is receptor downregulation observed in some viruses, which has also been suggested as a strategy to avoid superinfection. Early NA expression or receptor downregulation will also impact stickiness. Specifically, stickiness of uninfected and infected cells will be different, with the latter one having a lower stickiness due to the NA proteins expressed (or receptors downregulated) on the outside of the infected cells. To investigate this impact on fitness and stickiness, we consider a situation where the rates of attachment of virus to infected and uninfected cells differ, i.e.  More specifically, we write
  and determine the effect of a decrease in α from 1 (early NA expression has no effect on binding to infected cells) to a value close to 0 (early NA expression has a strong effect on binding to infected cells). Figure 7 shows that a lower level of binding strength to infected cells
  relative to the strength of binding to uninfected cells leads to higher values of optimal stickiness. This is expected, as virions in such a situation do not get ‘wasted’ by binding to already infected cells, making higher overall stickiness beneficial. However, the reduced loss of virions due to attachment and internalization into already infected cells leads to only a slight increase in fitness.
Figure 7.
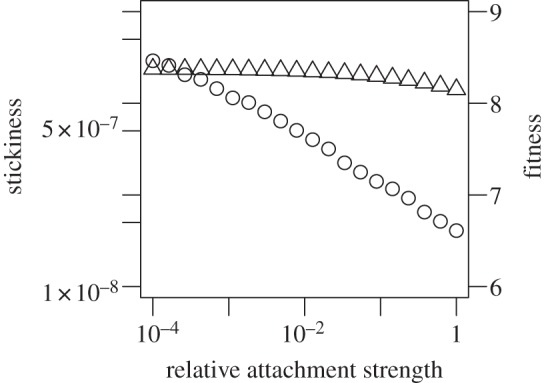
The impact of relative attachment strength of infected versus uninfected cells on fitness (triangles) and stickiness (circles). The relative attachment strength of infected versus uninfected cells,  , was varied. For α = 1, virions bind equally well to uninfected and infected. This corresponds to all the scenarios considered in the main text. Values of α < 1 correspond to early expression of NA by infected cells leading to a reduction in binding to infected cells. For each value of α, we scan over k− and k+, while ensuring that
  The model contains a low-strength antibody-based immune response (w1 = 10−2, w2 = 0). Similar results are found if we instead use a CTL response (not shown). Any parameters not varied are fixed and chosen as described in the main text.
3.7. The effects of virus infectivity on stickiness and fitness
Apart from the NA inhibitors, another important class of anti-influenza drugs currently exists, namely the M2 inhibitors, amantadine and rimantadine. Those drugs work intracellularly and essentially prevent virions from establishing a productive infection, which corresponds to a lower probability of infection parameter, f, in our model. We can investigate whether there are interactions between changes in virion infectiousness and optimal stickiness and fitness. As shown in figure 8, a reduction in infectiousness (a lower f) leads to reduced fitness, which is as expected. It also leads to an increase in stickiness. As infectiousness decreases, relatively more virions are needed to bind to and enter cells to sustain a robust infection process. Therefore, the balance shifts to higher stickiness. The model therefore predicts that in the presence of M2 inhibitors, which would lower virion infectiousness, the virus would evolve towards higher levels of stickiness. It might be interesting to see whether this prediction is borne out by, for instance, passaging the virus in the presence of the M2 inhibitors and measuring potential changes in stickiness.
Figure 8.
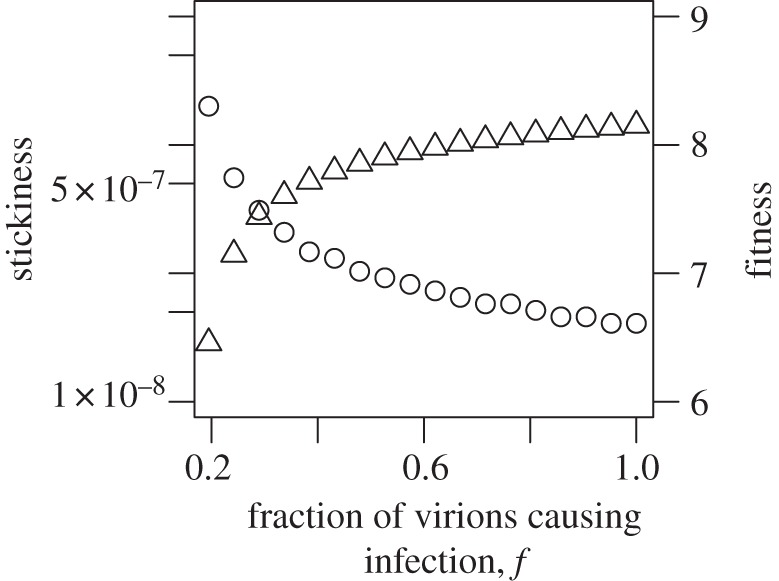
The impact of virion infectiousness on fitness (triangles) and stickiness (circles). The fraction of virons that lead to productive infection of cells, f, is varied. For each value of f, we scan over k+ and k− to determine optimal fitness and the level of stickiness at which this is achieved. The model contains a low-strength antibody-based immune response (w1 = 10−2, w2 = 0). Similar results are found if we instead use a CTL response (not shown). Any parameters not varied are fixed and chosen as described in the main text.
4. Discussion
Every budding enveloped virus needs to solve the problem of both entering and exiting cells efficiently. One way or another, viruses have figured out how to balance binding and release to achieve the right level of stickiness. Here, we studied this issue of optimal stickiness and how it impacted virus transmission fitness, using influenza as an example. In agreement with previous experimental studies, we found that, in general, extremely sticky viruses (strong HA, weak NA) or viruses with very weak binding strength (weak HA, strong NA) have low fitness, and a balance between attachment and detachment, i.e. the right level of stickiness, is required for high fitness. Our model was able to capture experimental findings on a semi-quantitative level. Results from our model lead to specific predictions for anti-influenza drugs. We found that given the non-symmetric shape of the fitness landscape with regard to binding and release rates, in addition to the ‘direct’ potency of a drug—arguably the most important factor—indirect effects that alter stickiness might be worth considering. Specifically, our study suggests that if the real fitness landscape has the shape we find from our model, a hypothetical NA-enhancer drug might potentially perform better than an inhibitor. Alternatively, HA inhibitors should do very well as drugs, too. Our results also suggest that a combination of multiple drugs might be worth further investigation, not only to prevent resistance [33] but also to achieve synergistic effects on virus fitness reduction.
Using our model to study the impact of either an antibody/B-cell-based or CTL-based immune response, we found that as immune response strength increases, a shift in the balance between HA and NA towards greater optimal stickiness occurs. This was recently observed experimentally for the case of an antibody-mediated immune response [75]. As far as we know, the suggestion that a CTL-based immune response should lead to a similar increase in stickiness is a novel prediction.
We were able to use our model to discuss the effects of different antibody-based vaccines. Based on our model, we predict that vaccines which mainly target HA are especially potent owing to the double effect of increasing immune response and shifting virus stickiness towards lower fitness, while vaccines that mainly target NA might not always have this added effect of fitness reduction because of stickiness shifting. Vaccines targeting proteins such as M2 and NP, which play no role in stickiness, are expected to affect virus fitness only through direct immune-mediated effects (i.e. higher virus clearance). As far as we know, the idea of indirect effects of vaccines on virus fitness, in addition to direct immune-mediated effects, is another novel prediction.
Finally, we show that reduced stickiness of infected cells owing to early NA expression on infected cells (or equivalently, receptor downregulation), or reduced reduction of virion infectiousness (owing to, for instance, the presence of M2 inhibitor drug) both lead to a shift in optimal stickiness towards higher levels. The impact of changes in other phenotypes is briefly described in the electronic supplementary material.
Another phenomenon worth discussing is temperature-dependent virus fitness. Scull et al. [85] recently showed the temperature dependence of human and avian strains and the reduced ability of the latter to grow at lower temperatures, presumably because avian strains are adapted to higher temperatures of the avian intestinal tract. Figure 2 can be used to conceptualize temperature-dependent fitness as it relates to HA and NA functionality and stickiness. As is true for most biological/chemical reactions, both rates of attachment and detachment decrease with decreasing temperature [29,67]. If the decrease is strong enough, the virus could leave the optimal fitness region, even if stickiness, i.e. the balance between HA and NA, stayed constant (i.e. the virus would be pushed far enough towards the lower left corner in figure 2 to end up in a low-fitness region). Alternatively—and more likely—while both attachment and detachment rates change with temperature, they do not necessarily change by the same amount. This changes stickiness and could potentially also reduce fitness by moving the virus off the high-fitness region. The specific impact of temperature obviously depends on the position in the fitness landscape and temperature also probably influences other factors besides attachment and detachment, for instance, the activity of the viral polymerase, which in our model would affect other parameters, such as the virus production rate. More detailed information would therefore be needed to better judge why strains adapted to a specific temperature perform worse at other temperatures—suboptimal stickiness might be one reason.
While the agreement we found between our model and existing data suggests that our model is able to adequately reproduce the main features of the biological system, our results should be considered qualitative or at best semi-quantitative, given that our model is still relatively simple and might not be able to capture all the complexities of the ‘real-world’ experimental studies. Specifically, it is not clear to what extent the fitness surface from our model reproduces the ‘real’ surface landscape of influenza fitness with regard to attachment and detachment rates.
Although we believe that the predictions made by our study are worth testing with further experimental studies, the caveat is of course that—as always—models are simplified representations of the real system and might not fully capture the biological reality. The explicit inclusion of the virion binding and release processes makes our model more complicated compared with most models that have been used to describe influenza infection [22,86]; however our model is still far from being able to describe all the important processes that occur during an infection. For instance, HA is known not only to be responsible for virus binding, but also for fusion of the virion with the cell [87]. Although most evidence suggests that the regions on the HA protein responsible for receptor binding differ from those that drive fusion, there might be interactions between them, which would impose constraints on the ability of the virus to independently optimize both. Similarly, the NA protein might also have additional roles. For instance, it was suggested that the cleavage of sialic acid by NA on both mucins and target cells allows the virion to better diffuse, reach and successfully infect the next uninfected cell [88,89]. Another study implicated NA in intracellular processes [90]. These other effects could impact the optimal level of stickiness. Our brief analysis of stickiness and its interaction with other phenotypes shown in the electronic supplementary material illustrates some of these complexities.
Two main features that are lacking in our model are stochasticity and explicit spatial structure. Stochastic events are likely to play an important role at the beginning of an infection, and in fact might even occasionally lead to no infection taking off. Therefore, stochastic effects probably impact the edge areas where the virus shifts from fitness too low to establish an infection to fitness levels that can establish an infection but might not always because of stochastic extinction before an infection has been established (this corresponds to fitness levels with R0 slightly above one [65,66]). Once attachment and detachment rates are such that a successful infection can occur, numbers of both virions and infected cells rapidly increase to levels at which the deterministic description is a good approximation. Given that our main outcome of virus fitness is measured as the integral over the whole infection, it is likely to be robust with respect to stochasticity—provided an infection has taken off, which we assume to be given for our model.
The role of spatial structure might have a stronger impact on the overall infection dynamics. A few recent studies showed that considering spatial features for within-host infection can impact the results [36,91–95]. How exactly this would affect our system is not immediately obvious. The fitness measurement as defined here, namely area under the virus load curve, does not depend on details such as proximity between uninfected and infected cells [93,96], kinetic features such as speed of infection spread [94] or potentially oscillatory behaviour for persistent infections [92]. We expect that while a spatial model would probably affect the absolute level of virus fitness, relative changes of fitness with changes in attachment and detachment rates should show a similar pattern as observed for the non-spatial model. In support of this assumption, we are currently in the process of implementing a stochastic, spatially explicit agent-based model and preliminary results suggest that the overall shape of the fitness landscape looks similar. We therefore believe that it is valid to assume that even though details might vary, the overall conceptual and qualitative findings presented here will likely apply relatively independent of model choice and do represent intrinsic features of the biological system.
While we have focused on influenza virus, other enveloped, budding viruses face the same trade-off between attachment and detachment and therefore need to evolve similar balances between certain proteins mediating those mechanisms to achieve an optimal level of stickiness. Our modelling framework is expected to apply to other enveloped, budding viruses causing acute infections. For viruses causing persistent infections, one would need to include target cell regeneration and a different way of quantifying fitness might also be more suitable [65]. However, the general ideas outlined here will still apply.
To summarize, we have shown that virus fitness strongly depends on the rates of attachment and detachment of virions of target cells, and that a balance between these rates is needed to achieve high fitness. We found that hypothetical NA enhancer drugs might perform better than the currently available NA inhibitors in reducing virus fitness; that vaccines targeting mainly HA perform better than vaccines targeting mainly NA; and that both an increased B cell/antibody or T-cell-mediated immune response leads to maximum fitness at higher stickiness. Several of our results suggest potentially interesting implications for vaccine or drug design. The idea that if the fitness landscape is not symmetric and changes in some direction have more impact compared with changes in other directions can be potentially exploited to design vaccines or drugs with maximum potency. We believe that further studies that combine experimental and theoretical approaches to map out the fitness landscape with respect to the binding and release rates could suggest better ways to design new anti-influenza drugs and vaccines.
Acknowledgements
We thank the reviewers for useful and constructive feedback, which helped to greatly improve this paper.
Appendix A. Model equations
The differential equations for the model described in words and graphically in the main text are given by
 |
The index n runs from n = 1, … , N − 2 and N is the maximum number of compartments (virions bound to a cell) allowed in the simulation. Uninfected cells have a maximum of N virions bound to them; an uninfected cell with N virions bound can have a virion enter the cell, turning it into an infected cell with N − 1 bound virions (which explains why there is one less compartment for the infected cells). Ideally, we would choose N to be the maximum number of virions bound to a cell. However, this quantity is not well known, and probably is in the thousands, which would mean a set of differential equations with several thousand compartments, which would be computationally prohibitive to analyse. We therefore instead choose a value for N that is large enough (usually greater than 100) to ensure that this artificial limitation of compartments had no effect on the results. We did so by tracking the number of cells in the last compartments (i.e. UN and IN−1) and ensured that these values always stayed below 1. For definitions and explanations of the model variables and biological parameters, see the main text.
Funding statement
R.A. and V.Z. were supported by MIDAS U01GM070749. A.H. was supported by NIH grant no. 1R56AI091938-01.
References
- 1.Das SR, et al. 2013. Defining influenza A virus hemagglutinin antigenic drift by sequential monoclonal antibody selection. Cell Host Microbe 13, 314–323. ( 10.1016/j.chom.2013.02.008) [DOI] [PMC free article] [PubMed] [Google Scholar]
- 2.Hughes MT, Matrosovich M, Rodgers ME, McGregor M, Kawaoka Y. 2000. Influenza A viruses lacking sialidase activity can undergo multiple cycles of replication in cell culture, eggs, or mice. J. Virol. 74, 5206–5212. ( 10.1128/JVI.74.11.5206-5212.2000) [DOI] [PMC free article] [PubMed] [Google Scholar]
- 3.Ilyushina NA, Govorkova EA, Webster RG. 2005. Detection of amantadine-resistant variants among avian influenza viruses isolated in North America and Asia. Virology 341, 102–106. ( 10.1016/j.virol.2005.07.003) [DOI] [PubMed] [Google Scholar]
- 4.Liu C, Eichelberger MC, Compans RW, Air GM. 1995. Influenza type A virus neuraminidase does not play a role in viral entry, replication, assembly, or budding. J. Virol. 69, 1099–1106. [DOI] [PMC free article] [PubMed] [Google Scholar]
- 5.Lu B, Zhou H, Chan W, Kemble G, Jin H. 2006. Single amino acid substitutions in the hemagglutinin of influenza A/Singapore/21/04 (H3N2) increase virus growth in embryonated chicken eggs. Vaccine 24, 6691–6693. ( 10.1016/j.vaccine.2006.05.062) [DOI] [PubMed] [Google Scholar]
- 6.Lu B, Zhou H, Ye D, Kemble G, Jin H. 2005. Improvement of influenza A/Fujian/411/02 (H3N2) virus growth in embryonated chicken eggs by balancing the hemagglutinin and neuraminidase activities, using reverse genetics. J. Virol. 79, 6763–6771. ( 10.1128/JVI.79.11.6763-6771.2005) [DOI] [PMC free article] [PubMed] [Google Scholar]
- 7.Mishin VP, Novikov D, Hayden FG, Gubareva LV. 2005. Effect of hemagglutinin glycosylation on influenza virus susceptibility to neuraminidase inhibitors. J. Virol. 79, 12 416–12 424. ( 10.1128/JVI.79.19.12416-12424.2005) [DOI] [PMC free article] [PubMed] [Google Scholar]
- 8.Mitnaul LJ, Matrosovich MN, Castrucci MR, Tuzikov AB, Bovin NV, Kobasa D, Kawaoka Y. 2000. Balanced hemagglutinin and neuraminidase activities are critical for efficient replication of influenza A virus. J. Virol. 74, 6015–6020. ( 10.1128/JVI.74.13.6015-6020.2000) [DOI] [PMC free article] [PubMed] [Google Scholar]
- 9.Rudneva IA, Sklyanskaya EI, Barulina OS, Yamnikova SS, Kovaleva VP, Tsvetkova IV, Kaverin NV. 1996. Phenotypic expression of HA-NA combinations in human-avian influenza A virus reassortants. Arch. Virol. 141, 1091–1099. ( 10.1007/BF01718612) [DOI] [PubMed] [Google Scholar]
- 10.Xu R, Zhu X, McBride R, Nycholat CM, Yu W, Paul-son JC, Wilson IA. 2012. Functional balance of the hemagglutinin and neuraminidase activities accompanies the emergence of the 2009 H1N1 influenza pandemic. J. Virol. 86, 9221–9232. ( 10.1128/JVI.00697-12) [DOI] [PMC free article] [PubMed] [Google Scholar]
- 11.Wagner R, Matrosovich M, Klenk H-D. 2002. Functional balance between haemagglutinin and neuraminidase in influenza virus infections. Rev. Med. Virol. 12, 159–166. ( 10.1002/rmv.352) [DOI] [PubMed] [Google Scholar]
- 12.Gubareva LV, Kaiser L, Hayden FG. 2000. Influenza virus neuraminidase inhibitors. Lancet 355, 827–835. ( 10.1016/S0140-6736(99)11433-8) [DOI] [PubMed] [Google Scholar]
- 13.Moscona A. 2005. Neuraminidase inhibitors for influenza. N. Engl. J. Med. 353, 1363–1373. ( 10.1056/NEJMra050740) [DOI] [PubMed] [Google Scholar]
- 14.Bantia S, Ghate AA, Ananth SL, Babu YS, Air GM, Walsh GM. 1998. Generation and characterization of a mutant of influenza A virus selected with the neuraminidase inhibitor bcx-140. Antimicrob. Agents Chemother. 42, 801–807. [DOI] [PMC free article] [PubMed] [Google Scholar]
- 15.Herlocher ML, Truscon R, Elias S, Yen H-L, Roberts NA, Ohmit SE, Monto AS. 2004. Influenza viruses resistant to the antiviral drug oseltamivir: transmission studies in ferrets. J. Infect. Dis. 190, 1627–1630. ( 10.1086/424572) [DOI] [PubMed] [Google Scholar]
- 16.Ilyushina NA, Bovin NV, Webster RG. 2012. Decreased neuraminidase activity is important for the adaptation of H5N1 influenza virus to human airway epithelium. J. Virol. 86, 4724–4733. ( 10.1128/JVI.06774-11) [DOI] [PMC free article] [PubMed] [Google Scholar]
- 17.McKimm-Breschkin JL, Blick TJ, Sahasrabudhe A, Tiong T, Marshall D, Hart GJ, Bethell RC, Penn CR. 1996. Generation and characterization of variants of NWS/G70C influenza virus after in vitro passage in 4-amino-neu5ac2en and 4-guanidino-neu5ac2en. Antimicrob. Agents Chemother. 40, 40–46. [DOI] [PMC free article] [PubMed] [Google Scholar]
- 18.Hensley SE, Das SR, Gibbs JS, Bailey AL, Schmidt LM, Bennink JR, Yewdell JW. 2011. Influenza A virus hemagglutinin antibody escape promotes neuraminidase antigenic variation and drug resistance. PLoS ONE 6, e15190 ( 10.1371/journal.pone.0015190) [DOI] [PMC free article] [PubMed] [Google Scholar]
- 19.Kryazhimskiy S, Dushoff J, Bazykin GA, Plotkin JB. 2011. Prevalence of epistasis in the evolution of influenza A surface proteins. PLoS Genet. 7, e1001301 ( 10.1371/journal.pgen.1001301) [DOI] [PMC free article] [PubMed] [Google Scholar]
- 20.Sandbulte MR, et al. 2011. Discordant antigenic drift of neuraminidase and hemagglutinin in H1N1 and H3N2 influenza viruses. Proc. Natl Acad. Sci. USA 108, 20 748–20 753. ( 10.1073/pnas.1113801108) [DOI] [PMC free article] [PubMed] [Google Scholar]
- 21.Westgeest KB, et al. 2012. Genetic evolution of the neuraminidase of influenza A (H3N2) viruses from 1968 to 2009 and its correspondence to haemagglutinin evolution. J. Gen. Virol. 93, 1996–2007. ( 10.1099/vir.0.043059-0) [DOI] [PMC free article] [PubMed] [Google Scholar]
- 22.Beauchemin CAA, Handel A. 2011. A review of mathematical models of influenza A infections within a host or cell culture: lessons learned and challenges ahead. BMC Public Health 11(Suppl. 1), S7 ( 10.1186/1471-2458-11-S1-S7) [DOI] [PMC free article] [PubMed] [Google Scholar]
- 23.Smith AM, Perelson AS. 2011. Influenza A virus infection kinetics: quantitative data and models. Wiley Interdiscip. Rev. Syst. Biol. Med. 3, 429–445. ( 10.1002/wsbm.129) [DOI] [PMC free article] [PubMed] [Google Scholar]
- 24.Bentz J, Nir S, Covell DG. 1988. Mass action kinetics of virus-cell aggregation and fusion. Biophys. J. 54, 449–462. ( 10.1016/S0006-3495(88)82978-3) [DOI] [PMC free article] [PubMed] [Google Scholar]
- 25.Brendel V, Perelson A. 1987. Kinetic analysis of adsorption processes. SIAM J. Appl. Math. 47, 1306–1319. ( 10.1137/0147086) [DOI] [Google Scholar]
- 26.Chou T. 2007. Stochastic entry of enveloped viruses: fusion versus endocytosis. Biophys. J. 93, 1116–1123. ( 10.1529/biophysj.107.106708) [DOI] [PMC free article] [PubMed] [Google Scholar]
- 27.Magnus C, Regoes RR. 2012. Analysis of the subunit stoichiometries in viral entry. PLoS ONE, 7, e33441 ( 10.1371/journal.pone.0033441) [DOI] [PMC free article] [PubMed] [Google Scholar]
- 28.Magnus C, Rusert P, Bonhoeffer S, Trkola A, Regoes RR. 2009. Estimating the stoichiometry of human immunodeficiency virus entry. J. Virol. 83, 1523–1531. ( 10.1128/JVI.01764-08) [DOI] [PMC free article] [PubMed] [Google Scholar]
- 29.Nunes-Correia I, Ramalho-Santos J, Nir S, Pedroso de Lima MC. 1999. Interactions of influenza virus with cultured cells: detailed kinetic modeling of binding and endocytosis. Biochemistry 38, 1095–1101. ( 10.1021/bi9812524) [DOI] [PubMed] [Google Scholar]
- 30.Wickham TJ, Granados RR, Wood HA, Hammer DA, Shuler ML. 1990. General analysis of receptor-mediated viral attachment to cell surfaces. Biophys. J. 58, 1501–1516. ( 10.1016/S0006-3495(90)82495-4) [DOI] [PMC free article] [PubMed] [Google Scholar]
- 31.Baccam P, Beauchemin C, Macken CA, Hayden FG, Perelson AS. 2006. Kinetics of influenza A virus infection in humans. J. Virol. 80, 7590–7599. ( 10.1128/JVI.01623-05) [DOI] [PMC free article] [PubMed] [Google Scholar]
- 32.Handel A, Longini IM, Antia R. 2007. Neuraminidase inhibitor resistance in influenza: assessing the danger of its generation and spread. PLoS Comput. Biol. 3, e240 ( 10.1371/journal.pcbi.0030240) [DOI] [PMC free article] [PubMed] [Google Scholar]
- 33.Perelson AS, Rong L, Hayden FG. 2012. Combination antiviral therapy for influenza: predictions from modeling of human infections. J. Infect. Dis. 205, 1642–1645. ( 10.1093/infdis/jis265) [DOI] [PMC free article] [PubMed] [Google Scholar]
- 34.Beauchemin CAA, McSharry JJ, Drusano GL, Nguyen JT, Went GT, Ribeiro RM, Perelson AS. 2008. Modeling amantadine treatment of influenza A virus in vitro. J. Theor. Biol. 254, 439–451. ( 10.1016/j.jtbi.2008.05.031) [DOI] [PMC free article] [PubMed] [Google Scholar]
- 35.Horsfall FL. 1955. Reproduction of influenza viruses; quantitative investigations with particle enumeration procedures on the dynamics of influenza A and B virus reproduction. J. Exp. Med. 102, 441–473. ( 10.1084/jem.102.4.441) [DOI] [PMC free article] [PubMed] [Google Scholar]
- 36.Mitchell H, et al. 2011. Higher level of replication efficiency of 2009 (H1N1) pandemic influenza virus than those of seasonal and avian strains: kinetics from epithelial cell culture and computational modeling. J. Virol. 85, 1125–1135. ( 10.1128/JVI.01722-10) [DOI] [PMC free article] [PubMed] [Google Scholar]
- 37.Brydon EWA, Smith H, Sweet C. 2003. Influenza A virus-induced apoptosis in bronchiolar epithelial (NCI-H292) cells limits pro-inflammatory cytokine release. J. Gen. Virol. 84, 2389–2400. ( 10.1099/vir.0.18913-0) [DOI] [PubMed] [Google Scholar]
- 38.Price GE, Smith H, Sweet C. 1997. Differential induction of cytotoxicity and apoptosis by influenza virus strains of differing virulence. J. Gen. Virol. 78, 2821–2829. [DOI] [PubMed] [Google Scholar]
- 39.Canini L, Carrat F. 2011. Population modeling of influenza A/H1N1 virus kinetics and symptom dynamics. J. Virol. 85, 2764–2770. ( 10.1128/JVI.01318-10) [DOI] [PMC free article] [PubMed] [Google Scholar]
- 40.Choppin PW. 1963. Multiplication of two kinds of influenza A2 virus particles in monkey kidney cells. Virology 21, 342–352. ( 10.1016/0042-6822(63)90195-8) [DOI] [PubMed] [Google Scholar]
- 41.Belz GT, Xie W, Doherty PC. 2001. Diversity of epitope and cytokine profiles for primary and secondary influenza A virus-specific CD8+ T cell responses. J. Immunol. 166, 4627–4633. [DOI] [PubMed] [Google Scholar]
- 42.Handel A, Antia R. 2008. A simple mathematical model helps to explain the immunodominance of CD8 T cells in influenza A virus infections. J. Virol. 82, 7768–7772. ( 10.1128/JVI.00653-08) [DOI] [PMC free article] [PubMed] [Google Scholar]
- 43.Handel A, Longini IM, Antia R. 2010. Towards a quantitative understanding of the within-host dynamics of influenza A infections. J. R. Soc. Interface 7, 35–47. ( 10.1098/rsif.2009.0067) [DOI] [PMC free article] [PubMed] [Google Scholar]
- 44.Iwasaki T, Nozima T. 1977. Defense mechanisms against primary influenza virus infection in mice. I. The roles of interferon and neutralizing antibodies and thymus dependence of interferon and antibody production. J. Immunol. 118, 256–263. [PubMed] [Google Scholar]
- 45.Legge KL, Braciale TJ. 2005. Lymph node dendritic cells control CD8+ T cell responses through regulated FasL expression. Immunity 23, 649–659. ( 10.1016/j.immuni.2005.11.006) [DOI] [PubMed] [Google Scholar]
- 46.Cairns HJF, Edney M, DeStGroth SF. 1952. Quantitative aspects of influenza virus multiplication. 1. Production of incomplete virus. 2. Heterologous interference. 3. Average liberation time. 4. Definition of constants and general discussion. J. Immunol. 69, 155–181. [PubMed] [Google Scholar]
- 47.Horsfall FL. 1954. On the reproduction of influenza virus; quantitative studies with procedures which enumerate infective and hemagglutinating virus particles. J. Exp. Med. 100, 135–161. ( 10.1084/jem.100.2.135) [DOI] [PMC free article] [PubMed] [Google Scholar]
- 48.Rust MJ, Lakadamyali M, Zhang F, Zhuang X. 2004. Assembly of endocytic machinery around individual influenza viruses during viral entry. Nat. Struct. Mol. Biol. 11, 567–573. ( 10.1038/nsmb769) [DOI] [PMC free article] [PubMed] [Google Scholar]
- 49.Heldt FS, Frensing T, Pflugmacher A, Grpler R, Peschel B, Reichl U. 2013. Multiscale modeling of influenza A virus infection supports the development of direct-acting antivirals. PLoS Comput. Biol. 9, e1003372 ( 10.1371/journal.pcbi.1003372) [DOI] [PMC free article] [PubMed] [Google Scholar]
- 50.Heldt FS, Frensing T, Reichl U. 2012. Modeling the intracellular dynamics of influenza virus replication to understand the control of viral RNA synthesis. J. Virol. 86, 7806–7817. ( 10.1128/JVI.00080-12) [DOI] [PMC free article] [PubMed] [Google Scholar]
- 51.Sidorenko Y, Reichl U. 2004. Structured model of influenza virus replication in MDCK cells. Biotechnol. Bioeng. 88, 1–14. ( 10.1002/bit.20096) [DOI] [PubMed] [Google Scholar]
- 52.Lakadamyali M, Rust MJ, Babcock HP, Zhuang X. 2003. Visualizing infection of individual influenza viruses. Proc. Natl Acad. Sci. USA 100, 9280–9285. ( 10.1073/pnas.0832269100) [DOI] [PMC free article] [PubMed] [Google Scholar]
- 53.Dobrovolny HM, Reddy MB, Kamal MA, Rayner CR, Beauchemin CAA. 2013. Assessing mathematical models of influenza infections using features of the immune response. PLoS ONE 8, e57088 ( 10.1371/journal.pone.0057088) [DOI] [PMC free article] [PubMed] [Google Scholar]
- 54.Carrat F, Vergu E, Ferguson NM, Lemaitre M, Cauchemez S, Leach S, Valleron A-J. 2008. Time lines of infection and disease in human influenza: a review of volunteer challenge studies. Am. J. Epidemiol. 167, 775–785. ( 10.1093/aje/kwm375) [DOI] [PubMed] [Google Scholar]
- 55.Chen SC, Chio CP, Jou LJ, Liao CM. 2009. Viral kinetics and exhaled droplet size affect indoor transmission dynamics of influenza infection. Indoor Air 19, 401–413. ( 10.1111/j.1600-0668.2009.00603.x) [DOI] [PubMed] [Google Scholar]
- 56.Hall CB, Douglas RG, Jr, Geiman JM, Meagher MP. 1979. Viral shedding patterns of children with influenza B infection. J. Infect. Dis. 140, 610–613. ( 10.1093/infdis/140.4.610) [DOI] [PubMed] [Google Scholar]
- 57.Halloran SK, Wexler AS, Ristenpart WD. 2012. A comprehensive breath plume model for disease transmission via expiratory aerosols. PLoS ONE 7, e37088 ( 10.1371/journal.pone.0037088) [DOI] [PMC free article] [PubMed] [Google Scholar]
- 58.Lange A, Ferguson NM. 2009. Antigenic diversity, transmission mechanisms, and the evolution of pathogens. PLoS Comput. Biol. 5, e1000536 ( 10.1371/journal.pcbi.1000536) [DOI] [PMC free article] [PubMed] [Google Scholar]
- 59.Lipsitch M, Moxon ER. 1997. Virulence and transmissibility of pathogens: what is the relationship? Trends Microbiol. 5, 31–37. ( 10.1016/S0966-842X(97)81772-6) [DOI] [PubMed] [Google Scholar]
- 60.Spicknall IH, Koopman JS, Nicas M, Pujol JM, Li S, Eisenberg JNS. 2010. Informing optimal environmental influenza interventions: how the host, agent, and environment alter dominant routes of transmission. PLoS Comput. Biol. 6, e1000969 ( 10.1371/journal.pcbi.1000969) [DOI] [PMC free article] [PubMed] [Google Scholar]
- 61.Tumpey TM, et al. 2007. A two-amino acid change in the hemagglutinin of the 1918 influenza virus abolishes transmission. Science 315, 655–659. ( 10.1126/science.1136212) [DOI] [PubMed] [Google Scholar]
- 62.Haas CN. 1983. Estimation of risk due to low doses of microorganisms: a comparison of alternative methodologies. Am. J. Epidemiol. 118, 573–582. [DOI] [PubMed] [Google Scholar]
- 63.Handel A, Brown J, Stallknecht D, Rohani P. 2013. A multi-scale analysis of influenza A virus fitness trade-offs due to temperature-dependent virus persistence. PLoS Comput. Biol. 9, e1002989 ( 10.1371/journal.pcbi.1002989) [DOI] [PMC free article] [PubMed] [Google Scholar]
- 64.R Core Team. 2013. R: a language and environment for statistical computing. Vienna, Austria: R Foundation for Statistical Computing. [Google Scholar]
- 65.Gilchrist MA, Coombs D, Perelson AS. 2004. Optimizing within-host viral fitness: infected cell lifespan and virion production rate. J. Theor. Biol. 229, 281–288. ( 10.1016/j.jtbi.2004.04.015) [DOI] [PubMed] [Google Scholar]
- 66.Heffernan JM, Smith RJ, Wahl LM. 2005. Perspectives on the basic reproductive ratio. J. R. Soc. Interface 2, 281–293. ( 10.1098/rsif.2005.0042) [DOI] [PMC free article] [PubMed] [Google Scholar]
- 67.Critchley P, Dimmock NJ. 2004. Binding of an influenza A virus to a neomembrane measured by surface plasmon resonance. Bioorgan. Med. Chem. 12, 2773–2780. ( 10.1016/j.bmc.2004.02.042) [DOI] [PubMed] [Google Scholar]
- 68.Hidari KIPJ, Shimada S, Suzuki Y, Suzuki T. 2007. Binding kinetics of influenza viruses to sialic acid-containing carbohydrates. Glycoconj. J. 24, 583–590. ( 10.1007/s10719-007-9055-y) [DOI] [PubMed] [Google Scholar]
- 69.Wagner R, Wolff T, Herwig A, Pleschka S, Klenk HD. 2000. Interdependence of hemagglutinin glycosylation and neuraminidase as regulators of influenza virus growth: a study by reverse genetics. J. Virol. 74, 6316–6323. ( 10.1128/JVI.74.14.6316-6323.2000) [DOI] [PMC free article] [PubMed] [Google Scholar]
- 70.Gubareva LV, Robinson MJ, Bethell RC, Webster RG. 1997. Catalytic and framework mutations in the neuraminidase active site of influenza viruses that are resistant to 4-guanidino-neu5ac2en. J. Virol. 71, 3385–3390. [DOI] [PMC free article] [PubMed] [Google Scholar]
- 71.McKimm-Breschkin JL, Sahasrabudhe A, Blick TJ, McDonald M, Colman PM, Hart GJ, Bethell RC, Varghese JN. 1998. Mutations in a conserved residue in the influenza virus neuraminidase active site decreases sensitivity to neu5ac2en-derived inhibitors. J. Virol. 72, 2456–2462. [DOI] [PMC free article] [PubMed] [Google Scholar]
- 72.Tai CY, Escarpe PA, Sidwell RW, Williams MA, Lew W, Wu H, Kim CU, Mendel DB. 1998. Characterization of human influenza virus variants selected in vitro in the presence of the neuraminidase inhibitor gs 4071. Antimicrob. Agents Chemother. 42, 3234–3241. [DOI] [PMC free article] [PubMed] [Google Scholar]
- 73.Sheu TG, et al. 2008. Surveillance for neuraminidase inhibitor resistance among human influenza A and B viruses circulating worldwide from 2004 to 2008. Antimicrob. Agents Chemother. 52, 3284–3292. ( 10.1128/AAC.00555-08) [DOI] [PMC free article] [PubMed] [Google Scholar]
- 74.Yang J, Li M, Shen X, Liu S. 2013. Influenza A virus entry inhibitors targeting the hemagglutinin. Viruses 5, 352–373. ( 10.3390/v5010352) [DOI] [PMC free article] [PubMed] [Google Scholar]
- 75.Hensley SE, et al. 2009. Hemagglutinin receptor binding avidity drives influenza A virus antigenic drift. Science 326, 734–736. ( 10.1126/science.1178258) [DOI] [PMC free article] [PubMed] [Google Scholar]
- 76.O'Donnell CD, et al. 2012. Antibody pressure by a human monoclonal antibody targeting the 2009 pandemic H1N1 virus hemagglutinin drives the emergence of a virus with increased virulence in mice. MBio 3, e00120 ( 10.1128/mBio.00120-12) [DOI] [PMC free article] [PubMed] [Google Scholar]
- 77.Yuan H-Y, Koelle K. 2013. The evolutionary dynamics of receptor binding avidity in influenza A: a mathematical model for a new antigenic drift hypothesis. Phil. Trans. R. Soc. B 368, 20120204 ( 10.1098/rstb.2012.0204) [DOI] [PMC free article] [PubMed] [Google Scholar]
- 78.Ellebedy AH, Webby RJ. 2009. Influenza vaccines. Vaccine 27, D65–D68. ( 10.1016/j.vaccine.2009.08.038) [DOI] [PMC free article] [PubMed] [Google Scholar]
- 79.Osterhaus A, Fouchier R, Rimmelzwaan G. 2011. Towards universal influenza vaccines? Phil. Trans. R. Soc. B 366, 2766–2773. ( 10.1098/rstb.2011.0102) [DOI] [PMC free article] [PubMed] [Google Scholar]
- 80.Li Z, Gabbard JD, Mooney A, Gao X, Chen Z, Place RJ, Tompkins SM, He B. 2013. Single-dose vaccination of a recombinant parainfluenza virus 5 expressing NP from H5N1 provides broad immunity against influenza A viruses. J. Virol. 87, 5985–5993. ( 10.1128/JVI.00120-13) [DOI] [PMC free article] [PubMed] [Google Scholar]
- 81.Price DA, et al. 2009. Public clonotype usage identifies protective gag-specific CD8+ T cell responses in SIV infection. J. Exp. Med. 206, 923–936. ( 10.1084/jem.20081127) [DOI] [PMC free article] [PubMed] [Google Scholar]
- 82.Schotsaert M, De Filette M, Fiers W, Saelens X. 2009. Universal M2 ectodomain-based influenza A vaccines: preclinical and clinical developments. Expert Rev. Vaccines 8, 499–508. ( 10.1586/erv.09.6) [DOI] [PMC free article] [PubMed] [Google Scholar]
- 83.Arinaminpathy N, Ratmann O, Koelle K, Epstein SL, Price GE, Viboud C, Miller MA, Grenfell BT. 2012. Impact of cross-protective vaccines on epidemiological and evolutionary dynamics of influenza. Proc. Natl Acad. Sci. USA 109, 3173–3177. ( 10.1073/pnas.1113342109) [DOI] [PMC free article] [PubMed] [Google Scholar]
- 84.Huang I-C, Li W, Sui J, Marasco W, Choe H, Farzan M. 2008. Influenza A virus neuraminidase limits viral superinfection. J. Virol. 82, 4834–4843. ( 10.1128/JVI.00079-08) [DOI] [PMC free article] [PubMed] [Google Scholar]
- 85.Scull MA, Gillim-Ross L, Santos C, Roberts KL, Bordonali E, Subbarao K, Barclay WS, Pickles RJ. 2009. Avian influenza virus glycoproteins restrict virus replication and spread through human airway epithelium at temperatures of the proximal airways. PLoS Pathog. 5, e1000424 ( 10.1371/journal.ppat.1000424) [DOI] [PMC free article] [PubMed] [Google Scholar]
- 86.Smith AM, Adler FR, McAuley JL, Gutenkunst RN, Ribeiro RM, McCullers JA, Perelson AS. 2011. Effect of 1918 PB1-F2 expression on influenza A virus infection kinetics. PLoS Comput. Biol. 7, e1001081 ( 10.1371/journal.pcbi.1001081) [DOI] [PMC free article] [PubMed] [Google Scholar]
- 87.Floyd DL, Ragains JR, Skehel JJ, Harrison SC, Oijen AM. 2008. Single-particle kinetics of influenza virus membrane fusion. Proc. Natl Acad. Sci. USA 105, 15 382–15 387. ( 10.1073/pnas.0807771105) [DOI] [PMC free article] [PubMed] [Google Scholar]
- 88.Matrosovich MN, Matrosovich TY, Gray T, Roberts NA, Klenk H-D. 2004. Neuraminidase is important for the initiation of influenza virus infection in human airway epithelium. J. Virol. 78, 12 665–12 667. ( 10.1128/JVI.78.22.12665-12667.2004) [DOI] [PMC free article] [PubMed] [Google Scholar]
- 89.Ohuchi M, Asaoka N, Sakai T, Ohuchi R. 2006. Roles of neuraminidase in the initial stage of influenza virus infection. Microbes Infect. 8, 1287–1293. ( 10.1016/j.micinf.2005.12.008) [DOI] [PubMed] [Google Scholar]
- 90.Su B, Wurtzer S, Rameix-Welti M-A, Dwyer D, van der Werf S, Naffakh N, Clavel F, Labrosse B. 2009. Enhancement of the influenza A hemagglutinin (HA)-mediated cell-cell fusion and virus entry by the viral neuraminidase (NA). PLoS ONE 4, e8495 ( 10.1371/journal.pone.0008495) [DOI] [PMC free article] [PubMed] [Google Scholar]
- 91.Beauchemin C. 2006. Probing the effects of the well-mixed assumption on viral infection dynamics. J. Theor. Biol. 242, 464–477. ( 10.1016/j.jtbi.2006.03.014) [DOI] [PubMed] [Google Scholar]
- 92.Funk GA, Jansen VAA, Bonhoeffer S, Killingback T. 2005. Spatial models of virus-immune dynamics. J. Theor. Biol. 233, 221–236. ( 10.1016/j.jtbi.2004.10.004) [DOI] [PubMed] [Google Scholar]
- 93.Handel A, Yates A, Pilyugin SS, Antia R. 2009. Sharing the burden: antigen transport and firebreaks in immune responses. J. R. Soc. Interface 6, 447–454. ( 10.1098/rsif.2008.0258) [DOI] [PMC free article] [PubMed] [Google Scholar]
- 94.Holder BP, Liao LE, Simon P, Boivin G, Beauchemin CAA. 2011. Design considerations in building in silico equivalents of common experimental influenza virus assays. Autoimmunity 44, 282–293. ( 10.3109/08916934.2011.523267) [DOI] [PubMed] [Google Scholar]
- 95.Howat TJ, Barreca C, O'Hare P, Gog JR, Grenfell BT. 2006. Modelling dynamics of the type I interferon response to in vitro viral infection. J. R. Soc. Interface 3, 699–709. ( 10.1098/rsif.2006.0136) [DOI] [PMC free article] [PubMed] [Google Scholar]
- 96.Handel A, Yates A, Pilyugin SS, Antia R. 2007. Gap junction-mediated antigen transport in immune responses. Trends Immunol. 28, 463–466. ( 10.1016/j.it.2007.08.006) [DOI] [PubMed] [Google Scholar]