

Abstract
A central question in movement research is how animals use information and movement to promote encounter success. Current random search theory identifies reorientation patterns as key to the compromise between optimizing encounters for both nearby and faraway targets, but how the balance between intrinsic motor programmes and previous environmental experience determines the occurrence of these reorientation behaviours remains unknown. We used high-resolution tracking and imaging data to describe the complete motor behaviour of Caenorhabditis elegans when placed in a novel environment (one in which food is absent). Movement in C. elegans is structured around different reorientation behaviours, and we measured how these contributed to changing search strategies as worms became familiar with their new environment. This behavioural transition shows that different reorientation behaviours are governed by two processes: (i) an environmentally informed ‘extrinsic’ strategy that is influenced by recent experience and that controls for area-restricted search behaviour, and (ii) a time-independent, ‘intrinsic’ strategy that reduces spatial oversampling and improves random encounter success. Our results show how movement strategies arise from a balance between intrinsic and extrinsic mechanisms, that search behaviour in C. elegans is initially determined by expectations developed from previous environmental experiences, and which reorientation behaviours are modified as information is acquired from new environments.
Keywords: search behaviour, reorientation patterns, environmental uncertainty, stochasticity, superdiffusion, Caenorhabditis elegans
1. Introduction
Nearly all organisms, from single cells to large animals, forage by controlling their motor patterns [1–3]. Foraging is a complex and multifaceted behaviour. It includes pre-detection components such as search and taxis and complex post-detection events such as pursuing (chasing down) or handling (opening, subduing, swallowing) prey [2,4,5]. Foraging animals change their motor patterns in response to surrounding environmental cues or as a result of previous experiences and learning processes [2]. An animal's response to environmental cues depends substantially on the spatial and temporal structure of environmental information [1–3]. Highly localized cues may trigger area-restricted searching [6,7] or acute avoidance reactions [8], whereas environmental gradients are exploited by both performing taxis, where animals move towards a desirable environment or avoid an unfavourable one, or by different types of kinesis (e.g. klinokinesis, orthokinesis), where movement is modulated by a non-directional response of the local cue intensity [2,9]. Foraging movement should not only be thought of as a set of stereotyped behavioural reactions to specific environmental stimuli [10]. External cues may be diffuse (non-directional), of variable quality (low signal-to-noise ratio), intermittent (complex presence–absence dynamics), or simply absent. Under such conditions, organisms may undertake specific search strategies to efficiently explore space [11] until some useful environmental information can be followed and exploited, and such strategies can be thought of as a major component of pre-detection foraging behaviour when information is substantially limited.
How should animals interact with the environment and use information when cues are scarce? On the one hand, current random search theory [12,13] has shown that reorientation behaviour can provide an adequate balance between intensive (local) and extensive (non-local) search [14,15], releasing the tension between optimizing for local and distant targets without previous information about the target spatial distribution. On the other hand, we know animals learn and have expectations based on previous experiences about their environment. Unfortunately, even though attempts have been made [16–20], it is still extremely difficult to relate field-recorded animal trajectories convincingly to recently developed stochastic search theory [21,22]. Accurate control of sensory inputs, memory and internal states of the animal in the wild is overwhelmingly difficult, and that limits the possibility of showing how animals use information to modify their reorientation patterns or to what extent, in the absence of information, intrinsic motor programmes optimize the balance between intensive (local) and extensive (non-local) search. In movement ecology studies [23], the size, sampling, quality and statistical analysis of animal movement datasets are critical factors. Ideally, data should be collected continuously, at high frequency, to capture fast dynamics, but also over a long timescale to generate statistically significant samples. The determination of behavioural states [23,24] needs to be quantified in a comprehensive and objective way. Environmental conditions also need to be handled carefully to control the amount of information available to the animal.
An experiment that fits these requirements is the study of Caenorhabditis elegans search behaviour in a well-controlled, homogeneous laboratory environment. C. elegans is a small nematode (1 mm) with a compact well-described neuronal system and can be studied at many scales: genes, neurons and networks [25–28]. It has a complex yet tractable search strategy that is generated by a relatively simple locomotive repertoire [29]. On the surface of agar plates, worms crawl forward (crawl) and backwards (reversal) by propagating undulatory waves along their body. These worms can also interrupt their crawling motions (i.e. reorientation behaviours) by bending their body deeply to form the shape of the Greek letter omega (omega), by pausing (pause) or by executing a more complex composite behaviour (pirouette), which is a sequence of a reversal and an omega performed closely in time [30].
We quantified the worm's search behaviour with a high-level of detail to characterize the underlying behavioural mechanisms governing their search patterns. We performed a relocation experiment from a resourced environment to one without resources in order to investigate how past experience modulates search with minimal intervention of external cues, and to determine whether innate stochastic search behaviour exists. Before the experiment, C. elegans were well fed and during the experiment they searched the surface of an agar plate without food. The tracking data were sampled at high resolution and magnification, capturing both the trajectory and body posture of single worms freely behaving as they move on the surface of agar plates [31,32]. We improved previous image processing software [31] to be able to detect worm behaviours with high accuracy, and provide a complete behavioural dataset of individual searching, distinguishing crawling and reorientation types that enable us to characterize the worm search patterns.
2. Material and methods
2.1. Experimental set-up
2.1.1. Tracking microscopy
The tracking microscope has been described previously [31,32] and is similar to other tracking systems [33–36]. In summary, the imaging system was designed to translocate around a fixed-position assay plate. As the worm moves on the surface of the plate, the system follows the movements of the worm while capturing images at 4 Hz and recording its centre-of-mass position.
2.1.2. Worm preparation
Fifty-two individuals, C. elegans strain N2, were grown at 20°C and maintained under standard laboratory conditions [37]. Fresh nematode growth medium (NGM) assay plates (1.7% Bacto agar, 0.25% Bacto-peptone, 0.3% NaCl, 1 mM CaCl2, 1 mM MgSO4, 25 mM potassium phosphate buffer, 5 µg ml−1 cholesterol) were partially dried by leaving uncovered for 1 h. A copper ring (5.1 cm inner diameter) pressed into the agar surface prevented worms from crawling to the side of the plate. Young adults were rinsed of Escherichia coli by transferring them from OP50 food plates into NGM buffer (same inorganic ion concentration as NGM assay plates) and letting them swim for 1 min. Individual worms were transferred from the NGM buffer to the centre of the assay plate (9 cm Petri dish). The plates were covered and tracking began after 1 min and lasted no longer than 60 min.
2.2. Diffusive properties of search
To quantify the worm diffusive properties of the 52 individuals, we computed the mean-squared displacement (MSD),  of all worm trajectories (population level) and checked whether the diffusion process was normal (i.e. MSD increasing linearly with time) or anomalous (nonlinear relationship with time). The MSD of a set of N individual displacements xn from an origin location to a location at time t is given by
  , where Ks is the generalized diffusion coefficient, and s is the diffusion exponent. Diffusivity domains can be distinguished by analysis of the anomalous diffusion exponent s subdiffusion for 0 < s < 1, superdiffusion for s > 1, normal Brownian diffusion for s = 1 and ballistic motion for s = 2.
2.3. Behavioural flagging
Reorientation events of the population of 52 worms were detected from the segmented binary images using standard imaging processing, computer vision techniques [37–40] and eigenworm analysis [31,41]. Binary images were skeletonized to derive the worm's centreline. Omegas were detected by calculating solidity (less than 0.70) and errors in skeletonization, which occur when worms touch or cross during omegas. If a reversal followed within two frames (0.5 s), then the behaviour is flagged as a pirouette. The frequency distribution of the time between omegas following reversals was bimodal; therefore, we used the maximum time of the first peak (two frames) as a threshold for the pirouette behaviour. Velocity of the worm's undulatory cycle was measured using eigenworm analysis [31,41] and used to flag reversals and pauses. The behavioural detection algorithm (see electronic supplementary material, figure S1) was applied to the image dataset of 52 individuals, 30 min each (total of 374 400 frames) and, in total, it detected 937 reversals, 1064 omegas, 1125 pirouettes and 387 pauses. This method was validated by computing the percentage of behaviours detected by the algorithm to the ones detected by human observation. We used a control dataset of behaviours observed by eye for five experimental runs (a total of 36 000 frames) representing 10% of the entire dataset. The algorithm detected over 92% (on average) of the number of omegas and reversals that were identified by eye (see the electronic supplementary material, table S1). The 8% misidentified behavioural responses were due to noisy images, in which the worm body could not be extracted. Omegas with low body compressibility (‘wide’ omega bends) and pauses coinciding with a straight body posture were misidentified by crawls and reversals, respectively.
2.4. Pre-filtering data before analysis
If the worm stopped moving before the completion of the run, then the data were excluded. We could see a clear and separable behavioural effect caused by mechanical stimulus on the reorientation frequency time series for the first 760 frames (3.2 min), which we explicitly removed in our final dataset. In the end, the following analyses are based on tracks and images of 52 individuals. Tracks were of 26.8 s each and with a total number of 2889 reorientation behaviours: 788 reversals, 860 omegas, 935 pirouettes and 306 pauses.
2.5. Orientational memory loss
To study the role of reorientation behaviours on the loss of orientational memory, we quantified the effect of each reorientation type on the overall direction of the trajectory. For that, we computed (i) the turning angle distribution generated by each reorientation type, and (ii) the angular correlation of the trajectory as a function of reorientation type for each one of the 52 individual worms of our study.
Turning angle distribution generated by each reorientation type: reorientations are located in between two crawls (periods of forward motion). The turning angle θ generated via a specific reorientation was computed by calculating the difference between the absolute angles of the vectors following the overall direction of the crawl just before and just after the reorientation. The vectors are defined using the first and last time frames of each crawl.
Angular correlation of the trajectory as a function of reorientation type: the angular correlation function
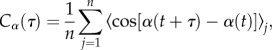 |
where α(t) is the local tangent angle at time t, τ is the time lag (from 1 to 13 s), j is the worm id and n is the total number of worms (52) was calculated from the centre-of-mass data (trajectory) to study the worm's directionality of motion over time. We combined the behavioural data with the trajectory data and sampled segment types ST from the trajectory that are crawls separated by a specific type T of reorientation (e.g. crawl–reversal–crawl). The angular correlation function was computed for both the original segments ST and their correspondent null model, which is a bootstrapping (499 times) of random segments of the same length as ST of the same trajectory (see the electronic supplementary material, figure S8). The correlation function Cα(τ) was computed for each ST using different lag sizes τ and it was averaged over all the segments over all the 52 individuals (black line in figure 3). For the null model case, standard error bars of the mean of Cα(τ) were computed for each lag size τ (dashed line in figure 3). The difference between the solid lines representing sequences of crawls interrupted by reorientation types and the dashed line representing the null model (random segments of the original trajectory) show how strong the contribution of each behaviour is towards changes in direction. The further the lines are from each other, the larger the contribution of the reorientation behaviour is evident.
Figure 3.

The role of reorientations in the direction of motion. Black lines correspond to the angular correlation decay of a consecutive sequence of crawls separated by a specific reorientation behaviour. Dashed lines (null models) show the angular correlation decay of segments sampled from the original trajectory (that can have any reorientation type within them) of the same size as the sequence of crawls represented by the black line. (a) Crawls with only reversals or (b) with only omegas produce sequences with a similar angular correlation as the null model indicating that reversals and omegas have a lower impact on the average orientational memory loss of the trajectory compared with pirouetting. (c) Crawls with only pirouettes show shorter correlation times (stronger decay) than the null model indicating a strong impact on the orientational memory loss. (d) Crawls with only pausing show longer correlation times (smaller decay) than the null model indicating a minimal effect of this reorientation type on the average orientational memory loss.
2.6. Probability distribution of omega time inter-events
We selected among three probabilistic models of the exponential family (simple, double and stretched exponentials) to identify the best-fitting probability distribution of the time intervals between omegas at both the individual and population levels of the 52 individual worms. In particular, we used Kolmogorov–Smirnov (KS) tests [42] and the likelihood functions of the probability density functions (pdfs; of the three models) over a bounded range and for pre-binned data [17]. We described the three pdfs, their corresponding transformation when considering pre-binned data, and their resulting likelihood function in the electronic supplementary material, text S1. For model selection, we include only those individuals that had performed at least 30 omegas during the tracking period for the individual level analysis.
2.7. Relationship between reorientation and crawl types
To test the statistical independence between reorientation and crawl types in our worm population, we performed a contingency table analysis followed by a chi-squared approximation for proportions [43]. We determined both the relationship between reorientations and crawls occurring immediately after, and between reorientations and crawls that preceded them. For the dependent relationship between reorientations and their previous crawls, we studied in more detail the connection between the different types of behaviours. In particular, we performed a two-tailed Z-score test statistic Z (α = 0.05) [43] to test the null hypothesis 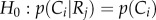 against the alternative hypothesis
 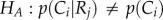 where i, and j represent, respectively, the different crawl and reorientation types presented in figure 5b. For the behaviours with dependent relationships, we used the departures from the expected frequency between reorientation events and their previous crawls to determine whether they are positively (above expected frequency) or negatively (below the expected frequency) correlated.
Figure 5.
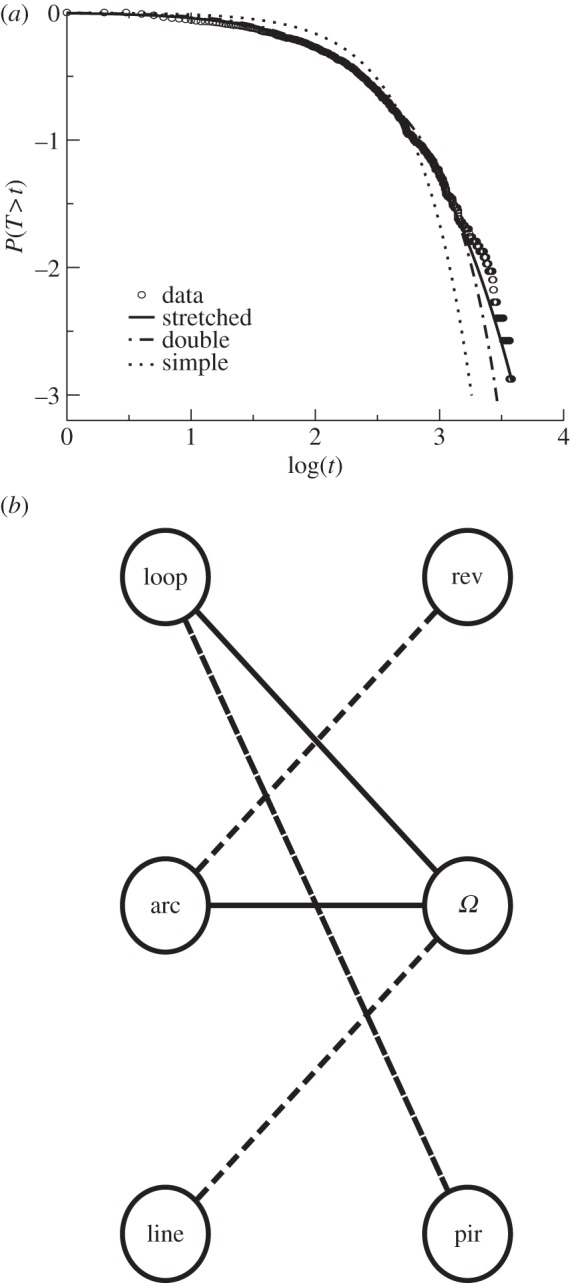
Caenorhabditis elegans omega-based search template and interdependencies between reorientation-crawl pairings. (a) Probability distribution of omega inter-events at the population level (52 worms). The fit between the empirical data and the stretched exponential distribution (solid line) is better than those obtained with the double exponential (dashed line) and the simple exponential (dotted line) distributions. (b) Loop–omega and arc–omega pairings are positively correlated (solid arrows), whereas loop–pirouette, arc–reversal and line–omega pairings are negatively correlated (dashed arrows). The non-existence of an arrow between a reorientation–crawl pairing indicates independency between them.
2.8. Average time to close a loop and characteristic inter-event times for omegas
The average time to close a loop was calculated as the average time to close a circle τ = 2πr/s, where r = 1/|k| and s is the speed. These averages are taken over all the trajectories that contain loops. The average speed of a loop is 0.3 mm s−1 and the median of loops’ curvature k is 4.1 mm–1, so τ = 5.4 s. The characteristic inter-event time for omegas q = 6.7 s was taken directly from the stretched exponential likelihood fit at the population level.
2.9. Models of search behaviour
Inspired by our data analyses, we have developed a modelling framework that allows us to compare the search efficiency in a patchy landscape of simple correlated random walks with different degrees of sinuosity ρ (crawling behaviour) to strategies that additionally incorporate both stationary/non-modulated (omega) and non-stationary/signal-modulated (pirouette) reorientation behaviours. To do so, we use four behavioural combinations according to the models in the electronic supplementary material, table S2: model 1, crawling behaviour (correlated random walk); model 2, crawling behaviour with omegas; model 3, crawling behaviour with pirouettes; and model 4, crawling behaviour with both omegas and pirouettes. The details of the modelling framework are provided in the electronic supplementary material. Search efficiency was computed as the number of encounters per travelled distance, averaged over 500 individuals.
3. Results
The tracking system captures both the trajectory and the body postures of single worms freely moving on the surface of agar plates (Material and methods). Figure 1a shows representative high-resolution tracking data and a detailed image of the worm captured during the experiment. The scaling behaviour of the MSD across time shows that the worms do not passively diffuse while searching, but instead perform more complex movements such that the population spreading while searching is superdiffusive with an anomalous diffusion exponent s1 = 1.37 (greater than 1), up to the limiting scale of the experimental system that can be associated with the crossover towards a subdiffusive regime s2 = 0.46 (less than 1; figure 1b). The pairing of large-scale tracks (worm centre-of-mass trajectory) and small-scale behavioural data (body postures) allows us to flag crawls and reorientation behavioural events and produce comprehensive trajectories (figure 1a) and ethograms (figure 1c) that show the transition between a number of crawling and reorientation behaviours used by worms to explore the environment. Our analysis indicates a number of different types of crawling motions and reorientation behaviours. Crawling motions are not always straight, but often form arcing or looping trajectories [32]. We flagged crawling behaviour based on curvature and angular concordance [44] into four categories: lines, open arcs, closed arcs and loops (see the electronic supplementary material, text S2 and figures S2 and S3). We identified four types of reorientation behaviour: reversals, omegas, pauses and pirouettes (figure 1c; Material and methods).
Figure 1.

Individual worm track and population ethogram. (a) A 30 min tracking run showing the centre-of-mass movements of a single C. elegans worm. Inset shows raw worm image. Behavioural events are labelled as crawls (black), reversals (blue), omegas (cyan), pirouettes (orange) and pauses (red). (b) Spreading capacity of the worm population measured as the MSD across time (52 worm trajectories starting from the same origin point). Two regimes were found: superdiffusive with slope s1 = 1.37 > 1 (solid line) and subdiffusive with 0 < s2 = 0.46 < 1 (dashed line). The worm population does not passively diffuse through the environment. Their spreading is accelerated, covering a range of spatio-temporal scales up to the limiting scale of the experimental system (5.1 cm), where spreading then becomes subdiffusive. (c) Population ethogram (n = 52) showing individual behavioural variability. Behavioural events are colour coded as above, except crawls that are in grey.
The overall movement patterns did not show any directional bias (Rayleigh tests of uniformity [45], applied to the first and last positions of each trajectory, p-value = 0.56, n = 52), confirming the absence of landscape gradients or cue-biased large-scale movement, i.e. search and not taxis was the main driver of the overall movement pattern. We quantified how each type of reorientation contributed to the loss of orientational memory by both calculating turning angle distributions and performing angular correlation analyses of trajectories (figures 2 and 3). Pirouettes generated a distribution centred at 180° turns and accounted for the strongest effect on the loss of orientational memory at the trajectory scale. Contrary to what has been reported for insects [46], pauses generated almost no turning at all. Reversals and omegas generated almost uniformly distributed turning angles, showing a notable effect on orientational memory loss (figure 3), but not as strong as with pirouetting. Our results show that different types of reorientations generate different turning angle distributions and break the directional persistence of the animal to different degrees, suggesting that distinct reorientation strategies may have different roles within the search process.
Figure 2.

The frequency distribution of turning angles generated by each reorientation behaviour. The frequency distribution of turning angles (18° interval bars) generated by (a) reversals, (b) omegas, (c) pirouettes and (d) pauses was computed from the analysis of 52 worms during the approximately 27 min assay period. Reversal and omega distributions are close to uniformity. The pirouette frequency distribution is centred around large turning angles (90–180°) values, whereas pause frequency distribution is centred around small turning angles (0–90°).
We further investigated the temporal dynamics of the different types of reorientations and crawls (figure 4; electronic supplementary material, text S3). We found that the worm's searching behaviour is a combination of time-dependent and time-independent components. The frequency of certain types of reorientations (pirouettes and reversals) and crawls (lines and arcs) decreased through time (Spearman's correlation range: ρs ∈ [−1, −0.58], p-value < 0.05; electronic supplementary material, tables S2 and S3), whereas the frequency of omegas, pausing and looping is time-independent (ρs∈[-0.30, 0.20], p-value = 0.31, 0.51 and 0.99, respectively; electronic supplementary material, tables S2 and S3).
Figure 4.
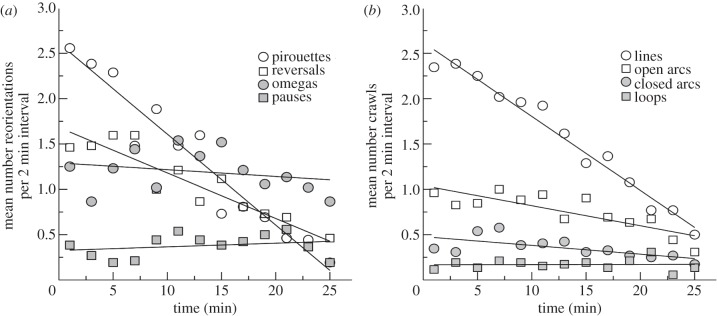
Temporal patterns of C. elegans search behaviour. The mean number of behaviours of (a) reorientation events and (b) crawling events was computed per 38 s time periods over an approximately 27 min assay search. Pirouettes (open circle) and reversals (open square) decrease over time, whereas omegas (filled circle) and pauses (filled square) are constant over time. Lines (open circle), open arcs (open square) and closed arcs (filled circle) crawling types decrease over time, whereas loops (filled square) are constant over time.
For the observation window of our experiments (about 30 min), our results indicate that omegas, which lead to uniformly distributed turning angle distributions (figure 2), control for basal, time-independent exploratory behaviour. In comparison, pirouette and reversals are related to a behavioural or physiological memory that decays through time. Assuming that time-dependent and time-independent reorientations represent two separate behavioural modules, we characterized the inter-event time distribution for omegas to explore the efficiency of the underlying stationary stochastic process in promoting encounter success [16]. The shape of the distribution determines whether large but rare inter-event times are less (simple exponential) or more probable (double exponential, stretched exponential). The latter feature implies a wide range of crawl lengths and the presence of intensive/extensive search patterns. We found that the omega inter-event time distribution is best characterized by a stretched exponential at the population level (figure 5a; Material and methods; electronic supplementary material, tables S4 and S5; KS test, p-value = 0.59; G-test, p-value = 0.92), whereas the double exponential distribution is the best fit at the individual level (see the electronic supplementary material, figure S4; tables S6 and S7; text S4). Despite the presence of characteristic times for omegas, both the combination of fast and slow omega turning rates (double exponential; [47]) or the presence of a heavy-tailed time inter-event distribution (stretched exponential) can promote intensive/extensive search patterns and accelerated (superdiffusive) spreading over a range of scales (figure 1a). In addition, we found that the emerging characteristic timescales of omega turn distributions could be associated with an intrinsic locomotory constraint of C. elegans: on average, crawls have some finite curvature [32], hence, the longer the crawl the larger the possibility of looping (i.e. spatial oversampling; see electronic supplementary material, figure S5). We estimated (Material and methods) that the average time for closing loops (5.4 s) is of the same order as the characteristic inter-event time for omegas (6.7 s, stretched exponential fit). Hence, an important function of omegas in the exploratory behavioural template may be to avoid spatial oversampling by preventing excessive looping.
To understand better the inherent structure of C. elegans search patterns we also investigated whether crawling and reorientation behaviours were independent of each other (Material and methods). We found that reorientations were all independent of the following crawl type (p-value = 0.06, n = 1717) but dependent on the previous crawl type (p-value = 3.28 × 10⁻⁷, n = 1714; see the electronic supplementary material, figure S6; tables S8 and S9). Omegas were positively correlated with previous loops (p-value = 0.037, n = 41) and arcs (p-value = 0.004, n = 214), and negatively correlated with lines (p-value = 1.2 × 10⁻⁴, n = 204). Pirouettes and reversals rarely finished loops or arcs, respectively (figures 5b; electronic supplementary material, table S10). The hypothesis that omegas are commonly used to break curved crawls was not only supported by the latter results, but we also found that there was a significant negative correlation between the number of omegas in a trajectory and the average length of loops (Spearman's rank correlation ρ = −0.53, p-value < 0.01).
Our simulations (Material and methods and the electronic supplementary material) showed that stationary reorientation templates (omegas), interrupting sinuous movements at times drawn from stretched exponentials, can indeed improve the search efficiency (figure 6). If signal-modulated, then area-restricted search behaviour is added to the stationary reorientation template (pirouettes), then the search efficiency further improves. As expected, the search efficiency improves much more based on reactive (non-stationary) turning behaviour linked to environmental cues or past memory than based on non-reactive/stationary stochastic reorientation templates. Nonetheless, the best search strategy comes out when combining both types of reorientation behaviours.
Figure 6.

Caenorhabditis elegans search modelling framework. (a) Conceptual diagram showing the presence of signal-modulated (non-stationary) and non-modulated (stationary) reorientation behaviour and the four potential behavioural combinations implemented. Round shapes: C. elegans behaviours. Grey polygons: behavioural switches. (b) Visualization of the path generated by model 4 (crawling behaviour plus omegas = On and pirouettes = On), with sinuosity ρ = 0.9 in a heterogeneous target landscape. Black dotted line: trajectory. Grey circles: targets. Blue circles: omegas. Red circles: pirouettes. Red-dotted line: subsets of the trajectory influenced by area-restricted-search behaviour. (c) Average search efficiency (number of targets found per distance travelled) for different values of directional correlation (ρ) and the different random walk models. Model 1: crawling behaviour (correlated random walk with sinuosity ρ). Model 2: crawling with omegas. Model 3: crawling with pirouettes. Model 4: crawling with both omegas and pirouettes.
4. Discussion
Caenorhabditis elegans moves with a limited locomotory repertoire, but we have shown that in homogeneous, information-limited environments, it produces complex and flexible search behaviours by combining locomotion primitives. These basic movement behaviours are not independently controlled. There are at least first-order correlations between behavioural states, where reorientation events are dependent on the previous crawling events. The movement of many organisms has been described by a run-and-tumble model [9,16,46,48], however, the worm's search movement cannot be represented by such a strategy [32] for a number of reasons: (i) crawl types differ in their straightness, (ii) there are correlations between reorientation and crawling events, (iii) some of the behavioural transitions are time-dependent, and (iv) the stationary components of behaviour generate complex movement patterns.
Omegas are responsible for a stationary, multi-scale, search component that holds over 30 min and covers a wide range of spatial scales. These features have been recognized as efficient random search behaviour that adequately trades-off for nearby and distant targets in heterogeneous landscapes [12,13,16], where scale-free reorientation patterns comprise the limiting optimal case [15,16]. Multi-scale search templates are also observed in other organisms [46,49–51], but there has been little understanding on what sets these scales. Despite the huge variability of omega turn inter-event times, here we found that C. elegans exhibits a characteristic timescale for omegas connected to intrinsic locomotory constraints such as not being able to move straight for a long time. Worms tend to end looping trajectories with omegas, reducing the risk of self-crossing paths. Examples of other motor behaviours responding to similar constraints are spiral motions of microorganisms [49], which are thought to allow the organism to average out locomotory biases and to swim in straighter paths, and characteristic turning frequencies in flagellated bacteria, which are constrained by sampling limits for diffusive sensing [52].
In addition to a stationary and multi-scale search movement template, C. elegans also exhibits a non-stationary, adjustable reorientation pattern (pirouettes and reversal turns) that changes in time in relation to expectations of food location. It is well known that the worm intensifies the search to a restricted area (high pirouette rates) when food or rewarding environmental cues are present [27,53]. Here, we show that well-fed C. elegans, influenced by past environmental memory or a present measure of internal state [53], also performs area-restricted search (based on both pirouettes and reversals) where food encounter expectations are high and gradually decreases pirouette and reversal rates when it fails to find food, expanding its search range.
Previous experiments have revealed that as the memory of a past resource-rich environment is gradually lost, and cues for new resources are missing, animals switch their strategies from intensive to extensive search modes [46,54]. The relevance of our results is to show that, at least for C. elegans, the story is not that simple. Our results reveal that these worms constantly maintain, in the background, a stationary and complex movement template that combines both intensive and extensive searches, and controls for excessive oversampling. An important question remains as to why such a random search template is needed for the survival of animals that can learn and use environmental information for their own profit? Learning and memory generate expectations on the environment, which undoubtedly animals use for search and survival. However, the environment is noisy and the animal's expectations (their model of the world) are not always accurate. For example, in our experiment, C. elegans performs an intense area-restricted search in an empty area for about 20 min based on an erroneous association of past environmental information. The worms expect to find food nearby based on a pre-condition that does not hold anymore. Yet, animals have a way to hedge their bets on their world model by generating an efficient background search template. This background search template is an important behavioural module often disregarded (see [10,51]) but may be present in animals to deal with environmental uncertainty. We suggest that such a template should accommodate motor constraints and incorporate generalized views on target locations, for example, the expectation of targets being nearby and faraway from one's position. More generally, our results suggest that motor behaviour that is not reinforced by environmental stimuli (e.g. taxis), can be constructed on the basis of empirically grounded expectation, reflecting both information learned by recent individual experiences (flexible and adjustable components) or fixed in motor programmes across evolutionary times (intrinsic, less flexible, templates).
Based on the above arguments, one could make the following predictions: (i) incorporating complex reorientation patterns (e.g. stretched exponential omega turns) should increase the search efficiency when compared with pure correlated random walking (pure crawling behaviour); (ii) the impact of such (omega) reorientation templates on search efficiency should be larger as we generate more straight-lined crawls; (iii) signal- or memory-modulated reorientations (pirouettes) should have a much stronger positive effect on search efficiency than stationary reorientation templates (omegas); (iv) the incorporation of both stationary and non-stationary (responding to memory or to environmental cues) reorientation components into a search strategy should lead to the best search efficiency outcome. All of these predictions are fulfilled in our simulations run in patchy landscapes, where reorientation mechanisms become important [14,15]. Our simulation results depend on specific parametrizations and should be taken as a qualitative demonstration of these concepts.
Our results show the great potential of studying the motor mechanisms of C. elegans in controlled laboratory environments to unravel both internal and external drivers of animal movement behaviour. Many of the current (but also classic) questions about search, optimal foraging theory, and more generally, movement ecology [23], can be addressed by means of model organisms. Future research on C. elegans can uncover neuronal [26] and genetic [25] mechanisms underlying the intrinsic stochastic behaviour of organisms, as well as quantify higher correlations between behavioural templates and the worm's adaptiveness for survival. Our results extend beyond C. elegans (see the electronic supplementary material, figure S7) and suggest that in a search process animals perform reorientation patterns that not only respond to external cues and/or gradients, but also are driven by their past memory and stochastic search templates, which highlight fundamental principles of organisms’ probabilistic models of the world and how to explore efficiently in the absence of environmental information.
Acknowledgements
L.C.M.S. was part of the PhD programme in Computational Biology at Gulbenkian Institute of Science, Portugal and is grateful for the financial support from Portuguese Foundation for Science and Technology (FCT), Portugal, SFRH/BD/32960/2006. F.B. acknowledges the Ramón y Cajal Programme, Ministry of Science and Innovation, Spain ref. RyC-2009-04133. F.B. and L.C.M.S. work was also supported by Plan Nacional I + D + i. Ministry of Science and Innovation, Spain, ref. BFU2010-22337. W.S.R. and F.B. acknowledge the HFSP grant, ref. RGY0084/2011. Susana Bernal, Katie Hampson and Daniel T. Haydon provided valuable feedback.
Data accessibility
The C. elegans image data are stored in the following repository: http://www.ryulab.ca:5000/fbsharing/P1Ncl80x.
References
- 1.Swingland R, Greenwood PJ. 1984. The ecology of animal movement. Oxford, UK: Clarendon Press. [Google Scholar]
- 2.Bell WJ. 1991. Searching behaviour: the behavioural ecology of finding resources. London, UK: Chapman and Hall. [Google Scholar]
- 3.Stephens DW, Brown JS, Ydenberg RC. 2007. Foraging: behavior and ecology. Chicago, IL: Chicago University Press. [Google Scholar]
- 4.Schoener TW. 1971. Theory of feeding strategies. Annu. Rev. Ecol. Syst. 2, 369–404. ( 10.1146/annurev.es.02.110171.002101) [DOI] [Google Scholar]
- 5.Green RF. 1980. Bayesian birds: a simple example of Oaten's stochastic model of optimal foraging. Theor. Popul. Biol. 18, 244–256. ( 10.1016/0040-5809(80)90051-9) [DOI] [Google Scholar]
- 6.Heinrich B. 1979. Resource heterogeneity and patterns of movement in foraging bumblebees. Oecologia 40, 235–245. ( 10.1007/BF00345321) [DOI] [PubMed] [Google Scholar]
- 7.Weimerskirch H, Pinaud D, Pawlowski F, Bost C-A. 2007. Does prey capture induce area-restricted search? A fine-scale study using GPS in a marine predator, the wandering albatross. Am. Nat. 170, 734–743. ( 10.1086/522059) [DOI] [PubMed] [Google Scholar]
- 8.Kiørboe T. 2008. A mechanistic approach to plankton ecology. Princeton, NJ: Princeton University Press. [Google Scholar]
- 9.Berg HC. 1993. Random walks in biology. Princeton, NJ: Princeton University Press. [Google Scholar]
- 10.Heisenberg M. 2009. Is free will an illusion? Nature 459, 164–165. ( 10.1038/459164a) [DOI] [PubMed] [Google Scholar]
- 11.Bartumeus F, da Luz MGE, Viswanathan GM, Catalan J. 2005. Animal search strategies: a quantitative random-walk analysis. Ecology 86, 3078–3087. ( 10.1890/04-1806) [DOI] [Google Scholar]
- 12.Raposo EP, Bartumeus F, da Luz MGE, Ribeiro-Neto PJ, Souza TA, Viswanathan GM. 2011. How landscape heterogeneity frames optimal diffusivity in searching processes. PLoS Comput. Biol. 7, e1002233 ( 10.1371/journal.pcbi.1002233) [DOI] [PMC free article] [PubMed] [Google Scholar]
- 13.Bartumeus F, Raposo EP, Viswanathan GM, da Luz MGE. 2013. Stochastic optimal foraging theory. In: Dispersal, individual movement and spatial ecology: a mathematical perspective (eds Lewis MA, Maini PK, Petrovskii SV.), pp. 3-32. Berlin, Germany: Springer–Verlag. [Google Scholar]
- 14.Bartumeus F. 2007. Levy processes in animal movement: an evolutionary hypothesis. Fractals 15, 151–162. ( 10.1142/S0218348X07003460) [DOI] [Google Scholar]
- 15.Bartumeus F, Levin SA. 2008. Fractal reorientation clocks: linking animal behavior to statistical patterns of search. Proc. Natl Acad. Sci. USA 105, 19 072–19 077. ( 10.1073/pnas.0801926105) [DOI] [PMC free article] [PubMed] [Google Scholar]
- 16.Viswanathan GM, Buldyrev SV, Havlin S, da Luz MG, Raposo EP, Stanley HE. 1999. Optimizing the success of random searches. Nature 401, 911–914. ( 10.1038/44831) [DOI] [PubMed] [Google Scholar]
- 17.Edwards AM, et al. 2007. Revisiting Lévy flight search patterns of wandering albatrosses, bumblebees and deer. Nature 449, 1044–1048. ( 10.1038/nature06199) [DOI] [PubMed] [Google Scholar]
- 18.Sims DW, et al. 2008. Scaling laws of marine predator search behaviour. Nature 451, 1098–1102. ( 10.1038/nature06518) [DOI] [PubMed] [Google Scholar]
- 19.Humphries NE, et al. 2010. Environmental context explains Lévy and Brownian movement patterns of marine predators. Nature 465, 1066–1069. ( 10.1038/nature09116) [DOI] [PubMed] [Google Scholar]
- 20.Humphries NE, Weimerskirch H, Queiroz N, Southall EJ, Sims DW. 2012. Foraging success of biological Lévy flights recorded in situ. Proc. Natl Acad. Sci. USA 109, 7169–7174. ( 10.1073/pnas.1121201109) [DOI] [PMC free article] [PubMed] [Google Scholar]
- 21.Viswanathan GM, Luz MGE, Raposo EP, Stanley EH. 2011. The physics of foraging: an introduction to random searches and biological encounters. Cambridge, UK: Cambridge University Press. [Google Scholar]
- 22.Bénichou O, Loverdo C, Moreau M, Voituriez R. 2011. Intermittent search strategies. Rev. Mod. Phys. 83, 81–129. ( 10.1103/RevModPhys.83.81) [DOI] [PubMed] [Google Scholar]
- 23.Nathan R, Getz WM, Revilla E, Holyoak M, Kadmon R, Saltz D, Smouse PE. 2008. A movement ecology paradigm for unifying organismal movement research. Proc. Natl Acad. Sci. USA 105, 19 052–19 059. ( 10.1073/pnas.0800375105) [DOI] [PMC free article] [PubMed] [Google Scholar]
- 24.Morales JM, Ellner SP. 2002. Scaling up animal movements in heterogeneous landscapes: the importance of behavior. Ecology 83, 2240–2247. ( 10.1890/0012-9658(2002)083[2240:SUAMIH]2.0.CO;2) [DOI] [Google Scholar]
- 25.Bargmann CI. 1993. Genetic and cellular analysis of behavior in C. elegans. Annu. Rev. Neurosci. 16, 47–71. ( 10.1146/annurev.ne.16.030193.000403) [DOI] [PubMed] [Google Scholar]
- 26.De Bono M, Maricq AV. 2005. Neuronal substrates of complex behaviors in C. elegans. Annu. Rev. Neurosci. 28, 451–501. ( 10.1146/annurev.neuro.27.070203.144259) [DOI] [PubMed] [Google Scholar]
- 27.Gray JM, Hill JJ, Bargmann CI. 2005. A circuit for navigation in Caenorhabditis elegans. Proc. Natl Acad. Sci. USA 102, 3184–3191. ( 10.1073/pnas.0409009101) [DOI] [PMC free article] [PubMed] [Google Scholar]
- 28.Mori I. 1999. Genetics of chemotaxis and thermotaxis in the nematode Caenorhabditis elegans. Annu. Rev. Genet. 33, 399–422. ( 10.1146/annurev.genet.33.1.399) [DOI] [PubMed] [Google Scholar]
- 29.Croll NA. 1975. Components and patterns in the behaviour of the nematode C. elegans. J. Zool. 176, 159–176. ( 10.1111/j.1469-7998.1975.tb03191.x) [DOI] [Google Scholar]
- 30.Pierce-Shimomura JT, Morse TM, Lockery SR. 1999. The fundamental role of pirouettes in Caenorhabditis elegans chemotaxis. J. Neurosci. 19, 9557–9569. [DOI] [PMC free article] [PubMed] [Google Scholar]
- 31.Stephens GJ, Johnson-Kerner B, Bialek W, Ryu WS. 2008. Dimensionality and dynamics in the behavior of C. elegans. PLoS Comput. Biol. 4, e1000028 ( 10.1371/journal.pcbi.1000028) [DOI] [PMC free article] [PubMed] [Google Scholar]
- 32.Stephens GJ, Johnson-Kerner B, Bialek W, Ryu WS. 2010. From modes to movement in the behavior of Caenorhabditis elegans. PLoS ONE 5, e13914 ( 10.1371/journal.pone.0013914) [DOI] [PMC free article] [PubMed] [Google Scholar]
- 33.Williams PL, Dusenbery DB. 1990. A promising indicator of neurobehavioral toxicity using the nematode Caenorhabditis elegans and computer tracking. Toxicol. Ind. Health 6, 425–440. ( 10.1177/074823379000600306) [DOI] [PubMed] [Google Scholar]
- 34.Cronin CJ, Mendel JE, Mukhtar S, Kim Y-M, Stirbl RC, Bruck J, Sternberg PW. 2005. An automated system for measuring parameters of nematode sinusoidal movement. BMC Genet. 6, 5 ( 10.1186/1471-2156-6-5) [DOI] [PMC free article] [PubMed] [Google Scholar]
- 35.Wang SJ, Wang Z-W. 2013. Track-a-worm, an open-source system for quantitative assessment of C. elegans locomotory and bending behavior. PLoS ONE 8, e69653 ( 10.1371/journal.pone.0069653) [DOI] [PMC free article] [PubMed] [Google Scholar]
- 36.Peliti M, Chuang JS, Shaham S. 2013. Directional locomotion of C. elegans in the absence of external stimuli. PLoS ONE 8, e78535 ( 10.1371/journal.pone.0078535) [DOI] [PMC free article] [PubMed] [Google Scholar]
- 37.Geng W, Cosman P, Baek J-H, Berry CC, Schafer WR. 2003. Quantitative classification and natural clustering of Caenorhabditis elegans behavioral phenotypes. Genetics 165, 1117–1126. [DOI] [PMC free article] [PubMed] [Google Scholar]
- 38.Cronin CJ, Feng Z, Schafer WR. 2006. Automated imaging of C. elegans behavior. Methods Mol. Biol. 351, 241–251. ( 10.1385/1-59745-151-7:241) [DOI] [PubMed] [Google Scholar]
- 39.Hoshi K, Shingai R. 2006. Computer-driven automatic identification of locomotion states in Caenorhabditis elegans. J. Neurosci. Methods 157, 355–363. ( 10.1016/j.jneumeth.2006.05.002) [DOI] [PubMed] [Google Scholar]
- 40.Huang K-M, Cosman P, Schafer WR. 2006. Machine vision based detection of omega bends and reversals in C. elegans. J. Neurosci. Methods 158, 323–336. ( 10.1016/j.jneumeth.2006.06.007) [DOI] [PubMed] [Google Scholar]
- 41.Likitlersuang J, Stephens G, Palanski K, Ryu WS. 2012. C. elegans tracking and behavioral measurement. J. Vis. Exp. 69, e4094 ( 10.3791/4094) [DOI] [PMC free article] [PubMed] [Google Scholar]
- 42.Clauset A, Shalizi CR, Newman MEJ. 2009. Power-law distributions in empirical data. SIAM Rev. 51, 661–703. ( 10.1137/070710111) [DOI] [Google Scholar]
- 43.Zar JH. 2010. Biostatistical analysis, 5th edn New Jersey, NJ: Prentice-Hall Inc. [Google Scholar]
- 44.Fortin M-J, Dale MRT. 2005. Spatial analysis: a guide for ecologists. Cambridge, UK: Cambridge University Press. [Google Scholar]
- 45.Batschelet E. 1981. Circular statistics in biology. New York, NY: Academic Press. [Google Scholar]
- 46.Bazazi S, Bartumeus F, Hale JJ, Couzin ID. 2012. Intermittent motion in desert locusts: behavioural complexity in simple environments. PLoS Comput. Biol. 8, e1002498 ( 10.1371/journal.pcbi.1002498) [DOI] [PMC free article] [PubMed] [Google Scholar]
- 47.Srivastava N, Clark DA, Samuel ADT. 2009. Temporal analysis of stochastic turning behavior of swimming C. elegans. J. Neurophysiol. 102, 1172–1179. ( 10.1152/jn.90952.2008) [DOI] [PMC free article] [PubMed] [Google Scholar]
- 48.Turchin P. 1998. Quantitative analysis of movement: measuring and modeling population redistribution in animals and plants. Sunderland, MA: Sinauer Associates. [Google Scholar]
- 49.Jennings HS. 1901. On the significance of the spiral swimming of organisms. Am. Nat. 35, 369–378. ( 10.1086/277922) [DOI] [Google Scholar]
- 50.Korobkova E, Emonet T, Vilar JMG, Shimizu TS, Cluzel P. 2004. From molecular noise to behavioural variability in a single bacterium. Nature 428, 574–578. ( 10.1038/nature02404) [DOI] [PubMed] [Google Scholar]
- 51.Brembs B. 2011. Towards a scientific concept of free will as a biological trait: spontaneous actions and decision-making in invertebrates. Proc. R. Soc. B 278, 930–939. ( 10.1098/rspb.2010.2325) [DOI] [PMC free article] [PubMed] [Google Scholar]
- 52.Berg HC, Purcell EM. 1977. Physics of chemoreception. Biophys. J. 29, 193–219. ( 10.1016/S0006-3495(77)85544-6) [DOI] [PMC free article] [PubMed] [Google Scholar]
- 53.Hills T, Brockie PJ, Maricq AV. 2004. Dopamine and glutamate control area-restricted search behavior in Caenorhabditis elegans. J. Neurosci. 24, 1217–1225. ( 10.1523/JNEUROSCI.1569-03.2004) [DOI] [PMC free article] [PubMed] [Google Scholar]
- 54.Kraemer PJ, Golding JM. 1997. Adaptive forgetting in animals. Psychon. Bull. Rev. 4, 480–491. ( 10.3758/BF03214337) [DOI] [Google Scholar]
Associated Data
This section collects any data citations, data availability statements, or supplementary materials included in this article.
Data Availability Statement
The C. elegans image data are stored in the following repository: http://www.ryulab.ca:5000/fbsharing/P1Ncl80x.